
You already know your Facebook insights are crucial for nudging your Facebook marketing strategy in the right direction. Facebook analytics give you the performance numbers you need to:
- Optimize your ad spend
- Improve the reach of your organic posts
- Give statistics you can report to stakeholders
- …And more
But Facebook bid adios to its native Facebook analytics tool (and the Facebook audience insights tool) in 2021. How do you get your Facebook analytics now? This article will tell you everything you need to know to measure your Facebook performance and get valuable insights.
What’s the difference between Facebook analytics and Facebook insights?
First things first: What’s the difference between Facebook analytics and Facebook insights?
- Facebook analytics refer to the raw numbers, data, and performance statistics
- Facebook insights refer to the learnings you derive from the above analytics
For example, let’s say you collate all your best-performing Facebook posts by finding all the content with the most engagement and reach. Here, you’re using Facebook analytics (likes, comments, shares, impressions, etc.) to determine which posts qualify as ‘best-performing’. After this collection, suppose you spot a pattern where most top performing posts were user-generated content. This is a Facebook insight you derived from your analytics.
Facebook offers raw analytics and some insights via its native tools. But you can also use third-party social media analysis tools to take a deeper dive into your performance metrics.
How to derive Facebook insights from 4 native Meta tools
Meta sunsetted its Facebook analytics tool to consolidate data from its other networks (like Instagram) all in one place. Now, you can view your Facebook Page performance in four ways inside Meta:
1. Professional dashboard
2. Meta business suite (only for Facebook Pages)
3. Meta ads manager (only if you run Facebook ads)
4. Facebook group insights (if you have a Facebook group)
1: Professional dashboard
The Professional dashboard is available for creators with professional mode on their Facebook profiles turned on and for Facebook Page insights. It contains simple surface-level Facebook analytics. If you’re looking for some quick insight into how your Facebook marketing is going, this is the best place to look at.
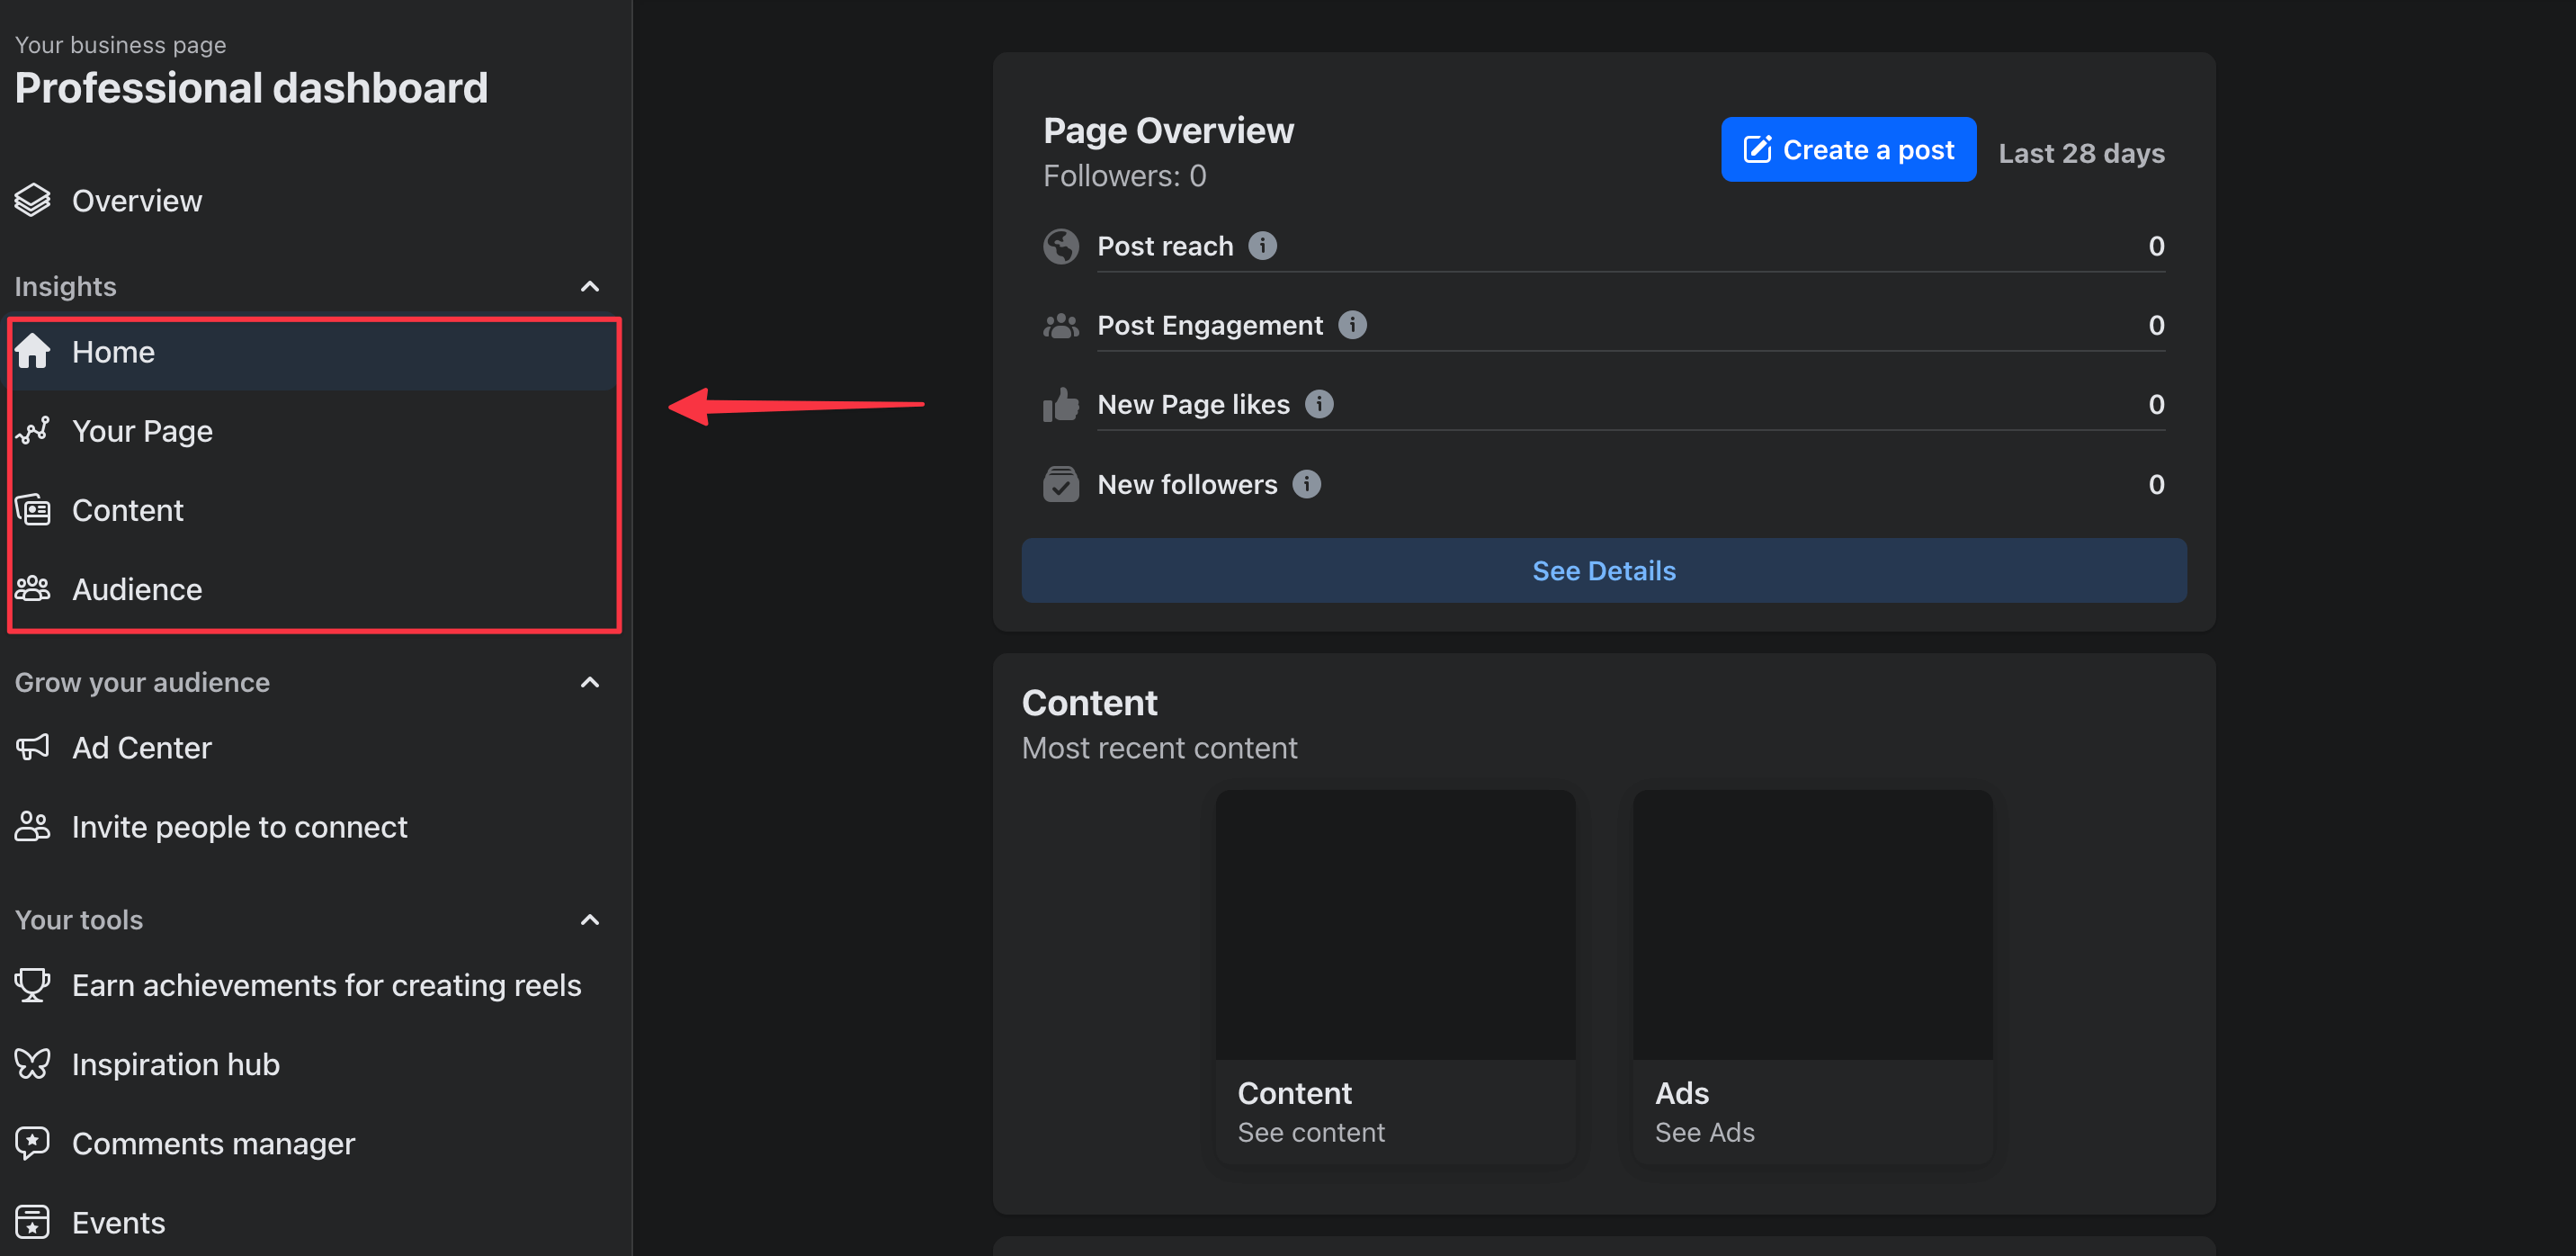
Inside the “Professional dashboard,” you’ll find an “Insight” tab containing four tabs:
1. Home: This section is a basic performance overview of your Page or profile for the past 28 days. You can see key metrics like overall page posts, total reach, page views, engagement, new followers, new page likes, recent content, and some basic info about your audience.
2. Your Page/Profile: Insights under this tab contain post reach, engagement, new followers, unfollows, and total interactions (likes, comments, shares, views, clicks) for the past 28 days.
3. Content: This page contains the public posts you’ve shared in the past 90 days (or you can filter for the past 7, 28, or 60 days) and how they’re performing individually.
4. Audience: Here, you can see fundamental demographic data (gender, age, and location) about the audience interacting with your Facebook Page or profile.
The professional dashboard is excellent if you simply want to do a quick flip-through of your Facebook posts’ performance. It’s not the most in-depth source of information, but it can get the ball rolling and is handy when you’re short on time.
It’s best to visit the professional dashboard regularly to stay in the loop on how your posts are performing and what audience demographics are interacting with your Page/profile.
2: Meta business suite
Meta business suite replaced Facebook analytics to become the source of native Facebook page insights. Facebook profiles with professional mode turned on don’t work inside Meta business suite at the time of writing this article.
The Meta business suite helps with many things (like unifying your inbox, scheduling content on Facebook and Instagram, etc.) including extracting in-depth Facebook analytics and insights into your organic and paid content on the platform.
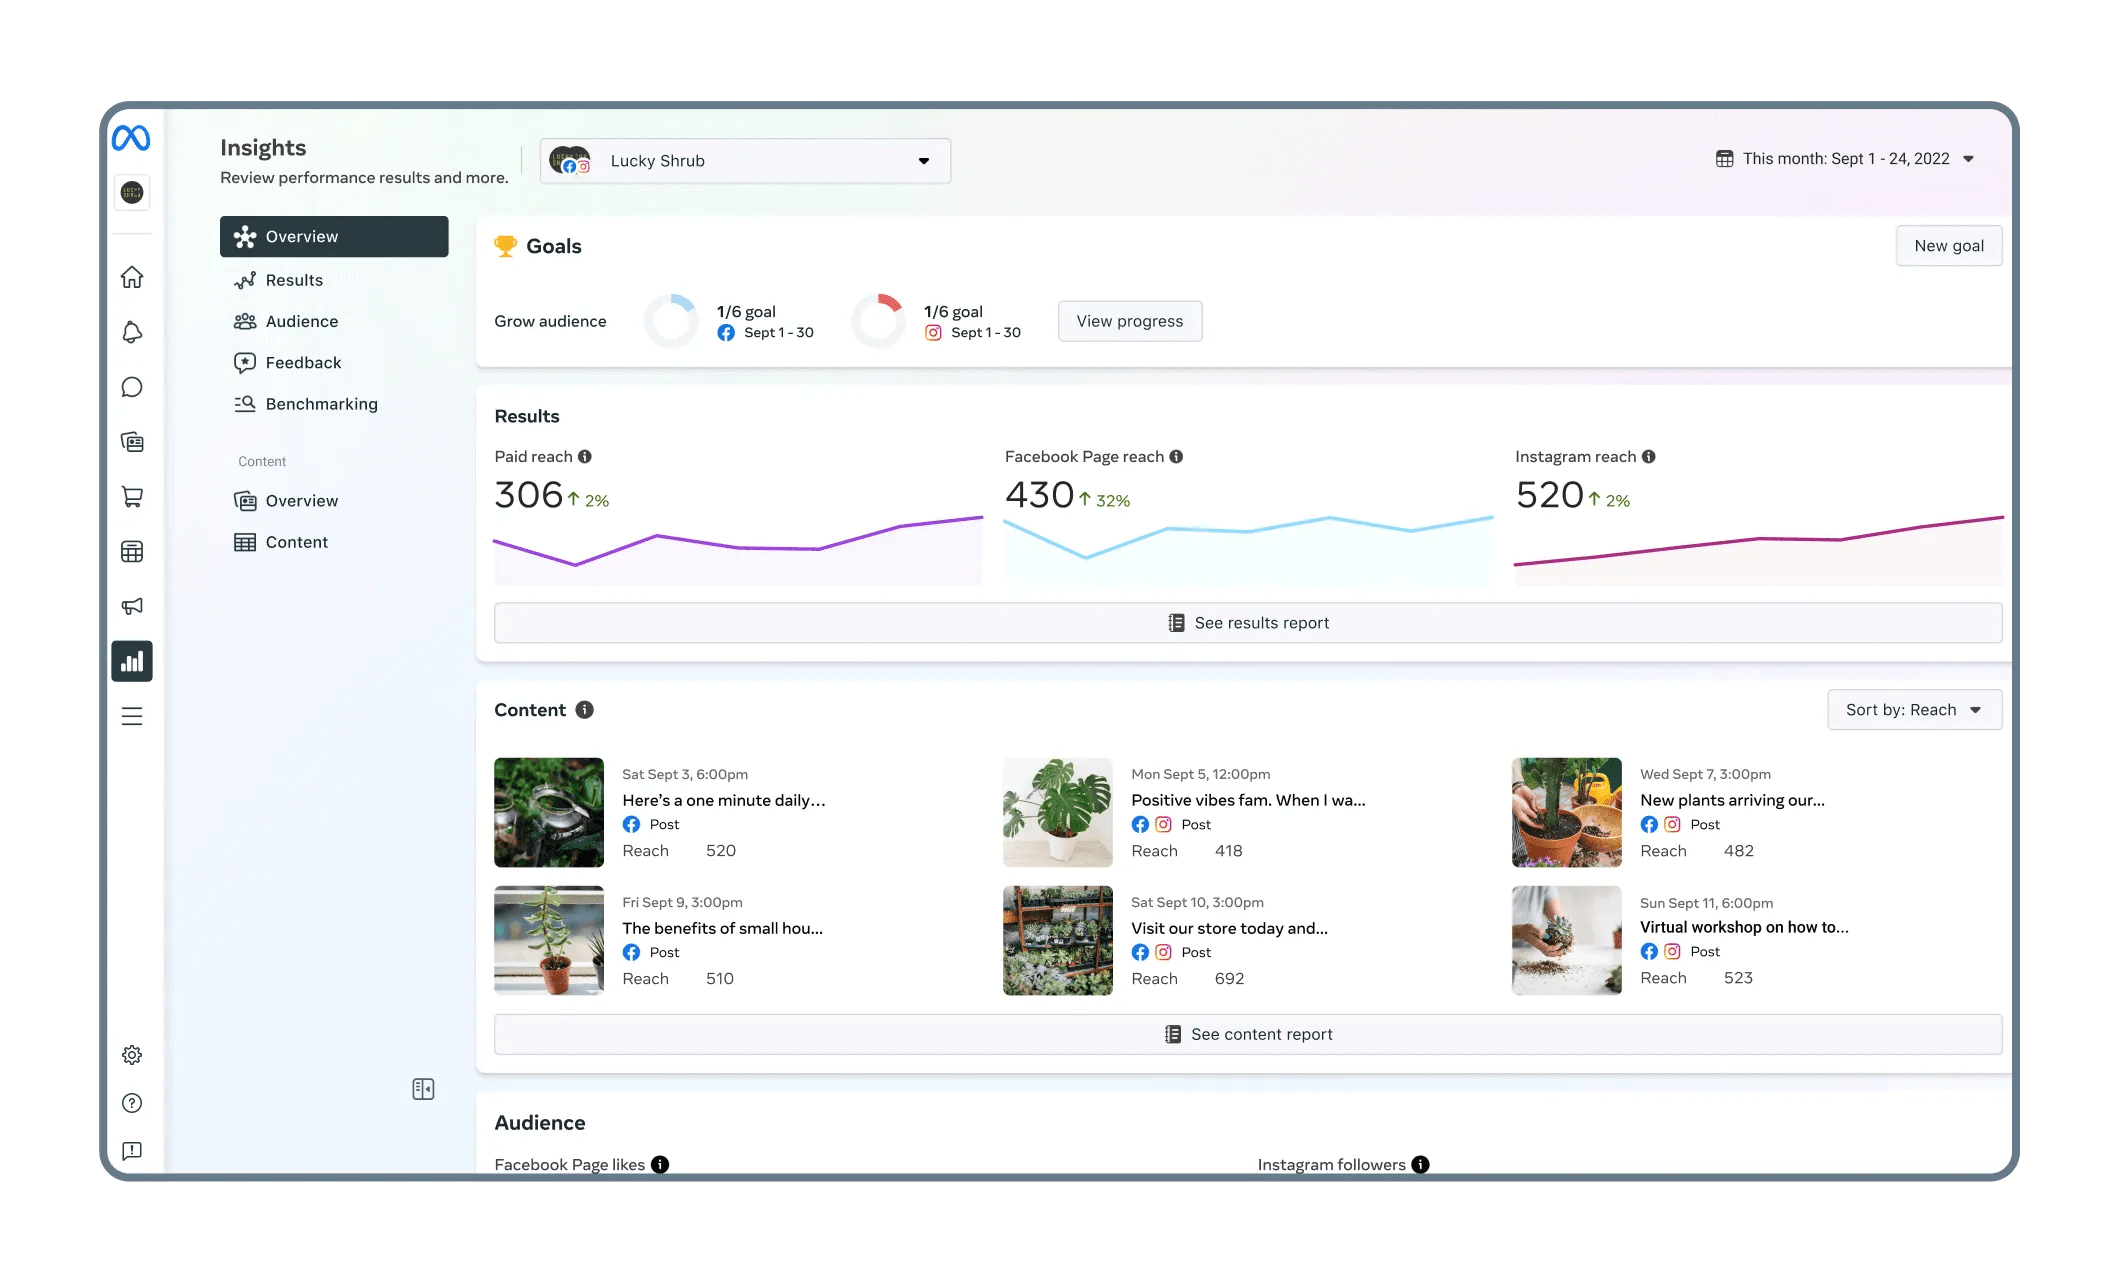
As soon as you log in to your Meta business suite, you’ll find an “Insights” section on the left menu. Within insights, eight tabs contain extensive and in-depth info on your Facebook performance:
1. Overview: This subsection contains the basic info on your Facebook Page insights. It includes daily and cumulative insights into how much reach you’ve gotten from your Facebook posts. The same tab also breaks down the reach numbers into 3-minute views, 1-minute views, minutes viewed, and content interactions on the X-axis and from followers & non-followers on the Y-axis.
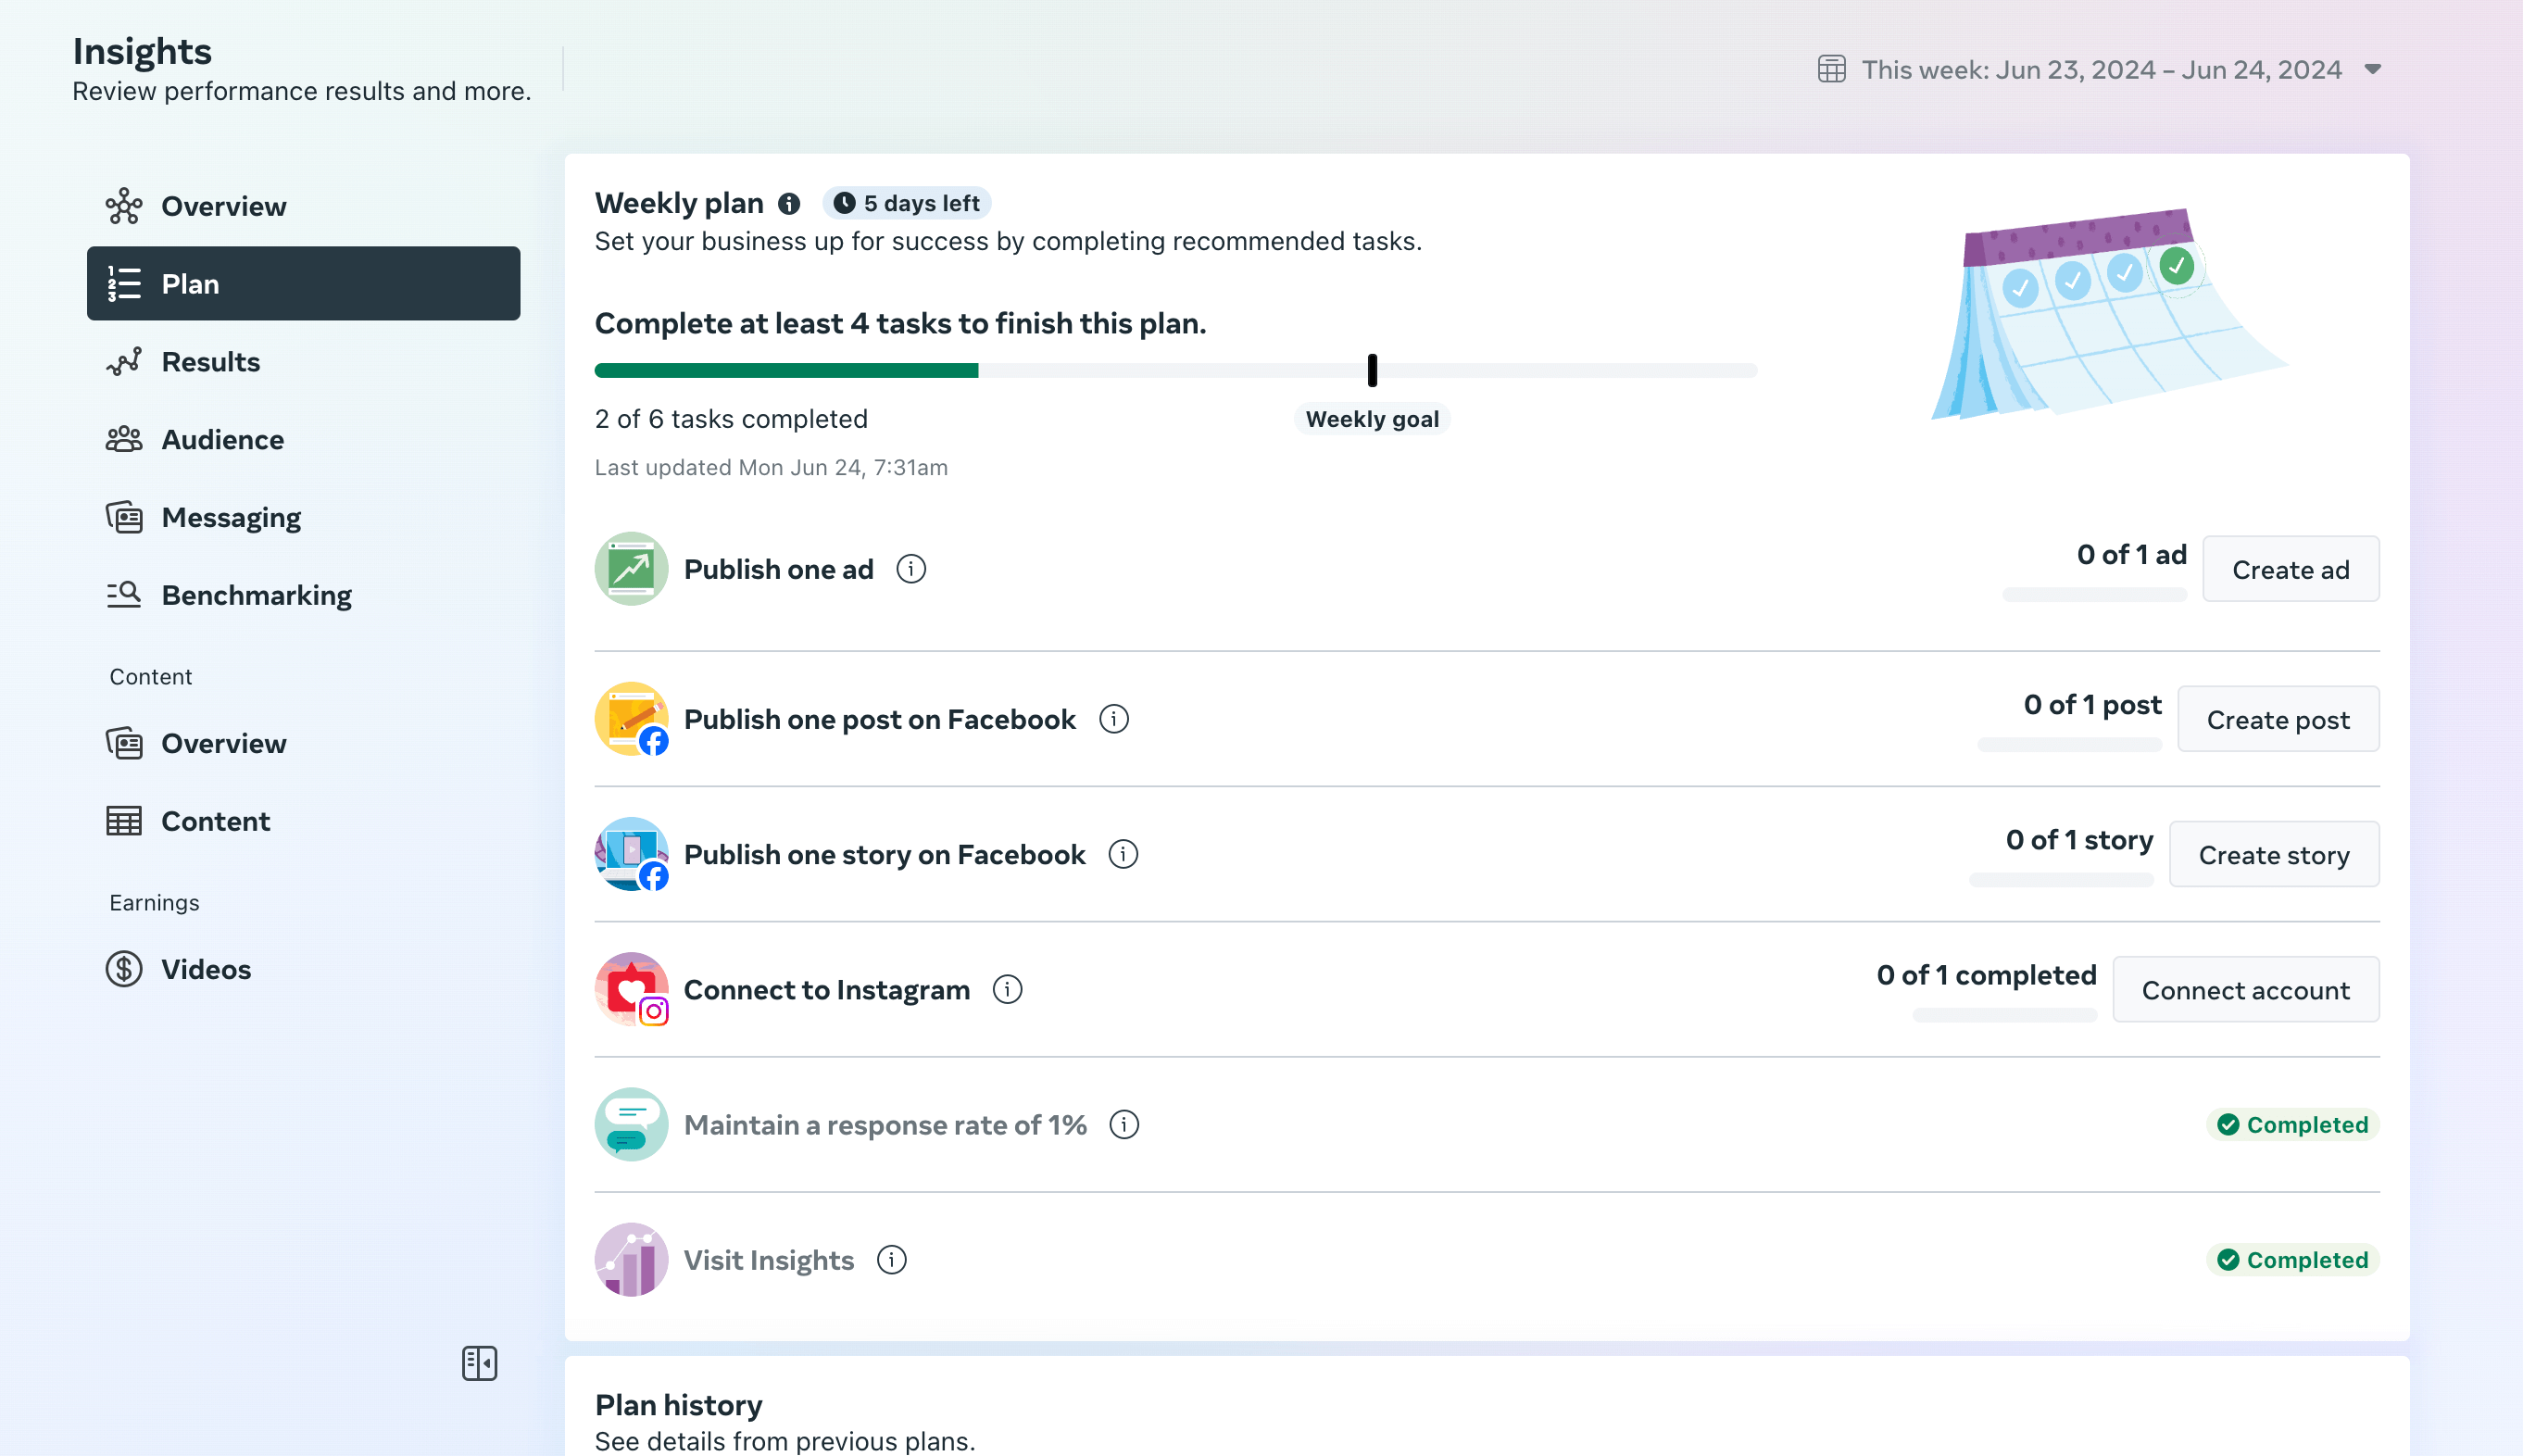
2. Plan: Here, Facebook helps you set goals and complete basic tasks it recommends to set yourself up for success — like the number of times you should post, setting up admins, etc. It’s a good tab to monitor in the beginning to understand Meta’s expectations and the features it offers.
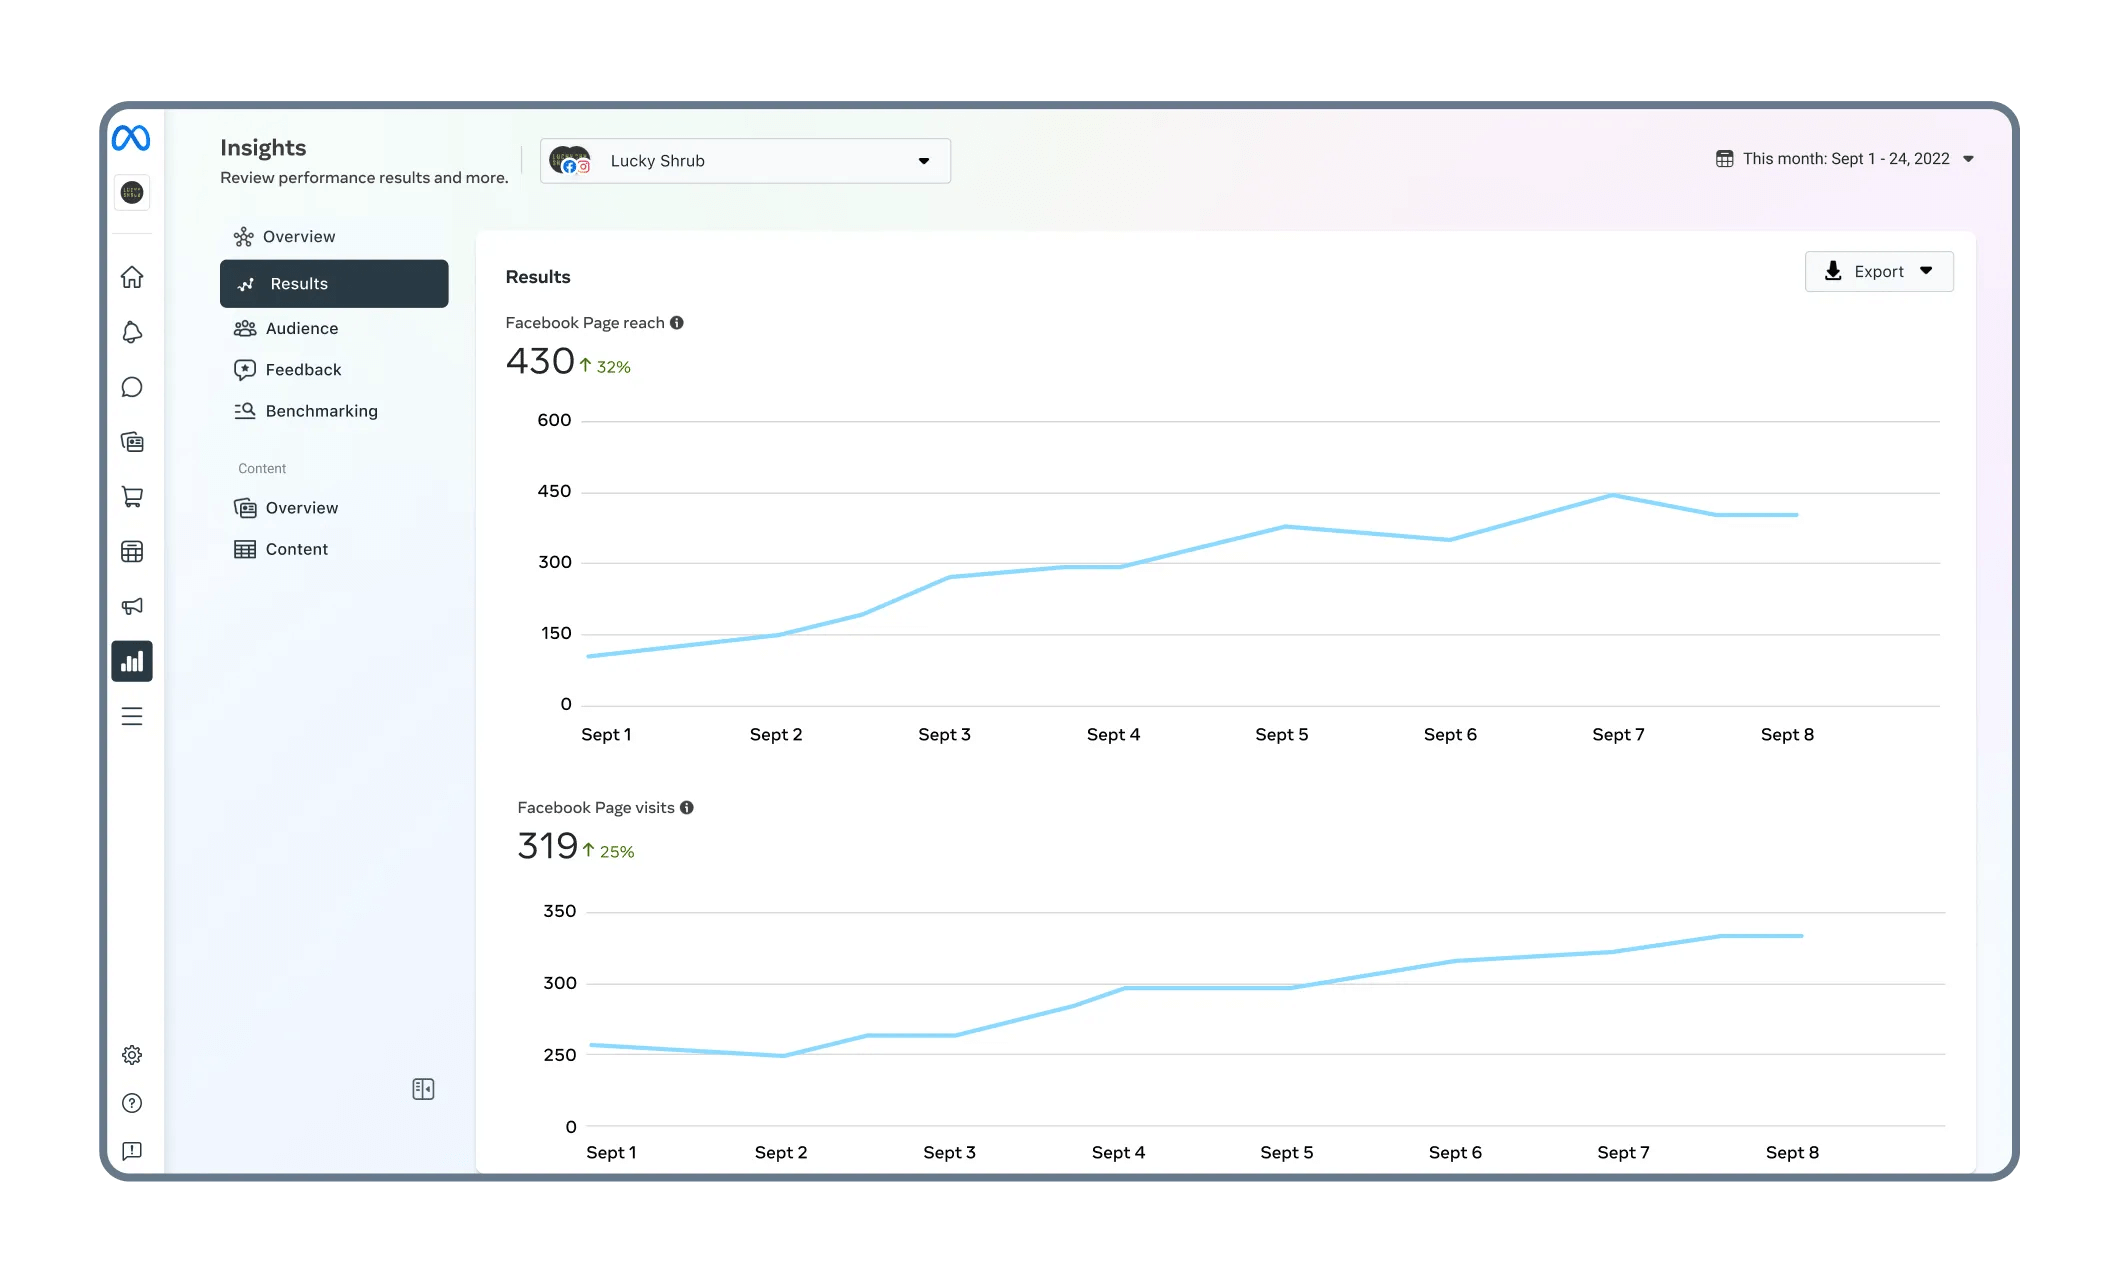
3. Results: This section helps you understand Facebook reach, Page views, follows, and ad performance over your selected timeline. It’s excellent for monitoring whether your Facebook analytics are increasing or decreasing over time. You can also come here to export these graphs for reporting to stakeholders.
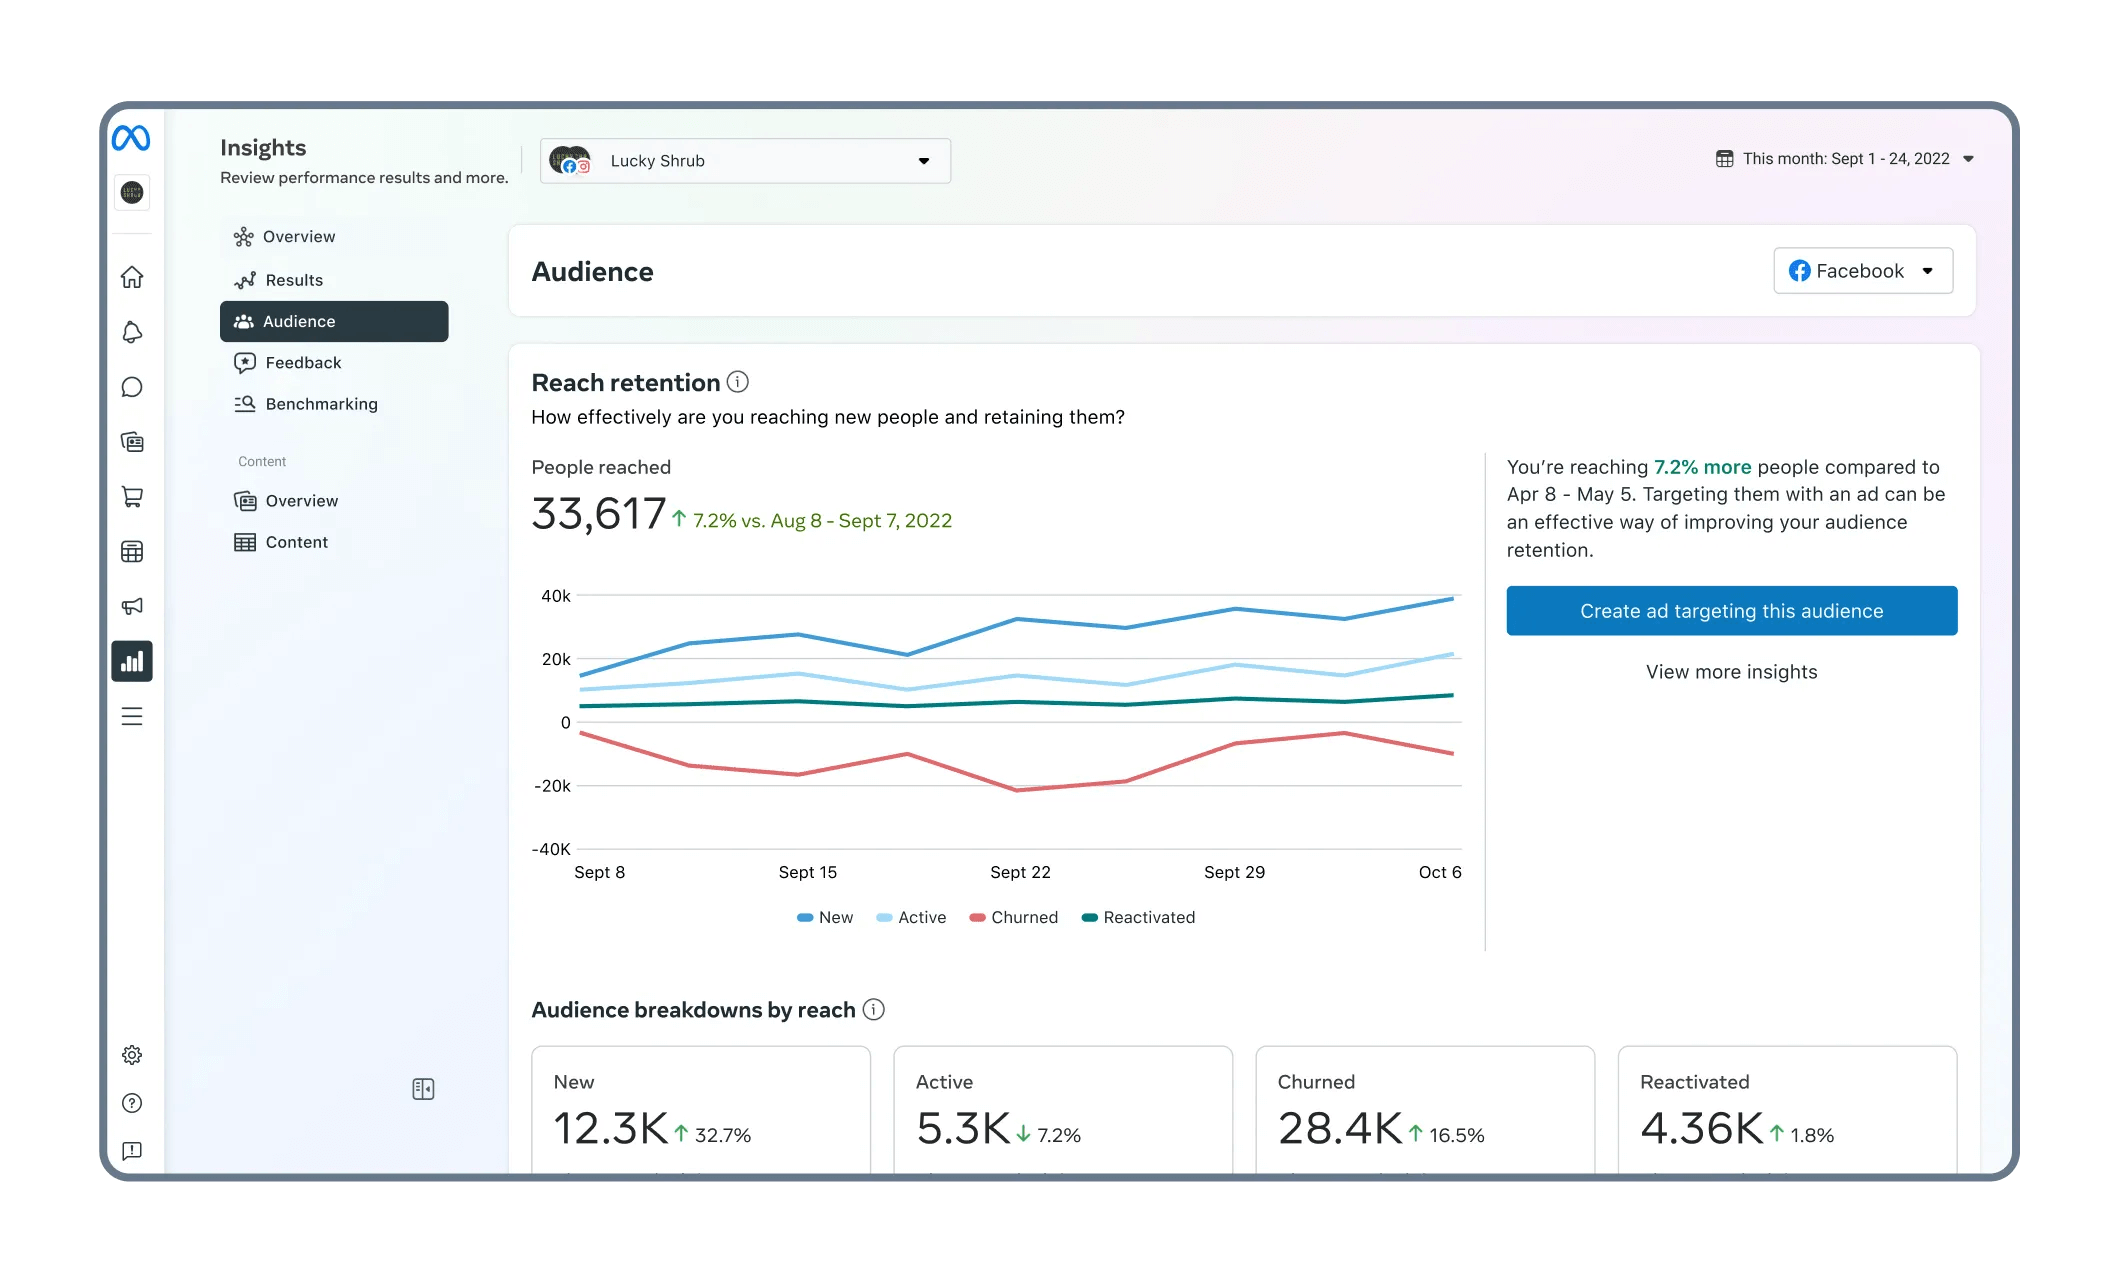
4. Audience: When Meta shut down Facebook Audience Insights, it didn’t eradicate it completely. Instead, Meta merged it into the business suite so you can continue to extract the granular details about your followers on Facebook. This tab contains:
- Trends: This tab shows metrics such as how your followers are increasing or decreasing, returning viewers, engaged followers over the timeline you’ve set. It also shows when you should post on Facebook by displaying the your audience’s most active times.
- Segments: Your target audience is divided into people who engage, follow, and message your Facebook Page. You can get insights into all these individual segments.
- Demographics: This is where you can see a breakdown of your audience’s demographic data — their age, gender, and location.
Potential audience: Here, you can add filters on who your ideal customer already is (where do they live? What’s their age? and more) and understand the number of people you can reach via your Facebook Page.
⚠️ Note: The number of people Facebook shares within the potential audience umbrella is an estimate. Don’t take it at face value.
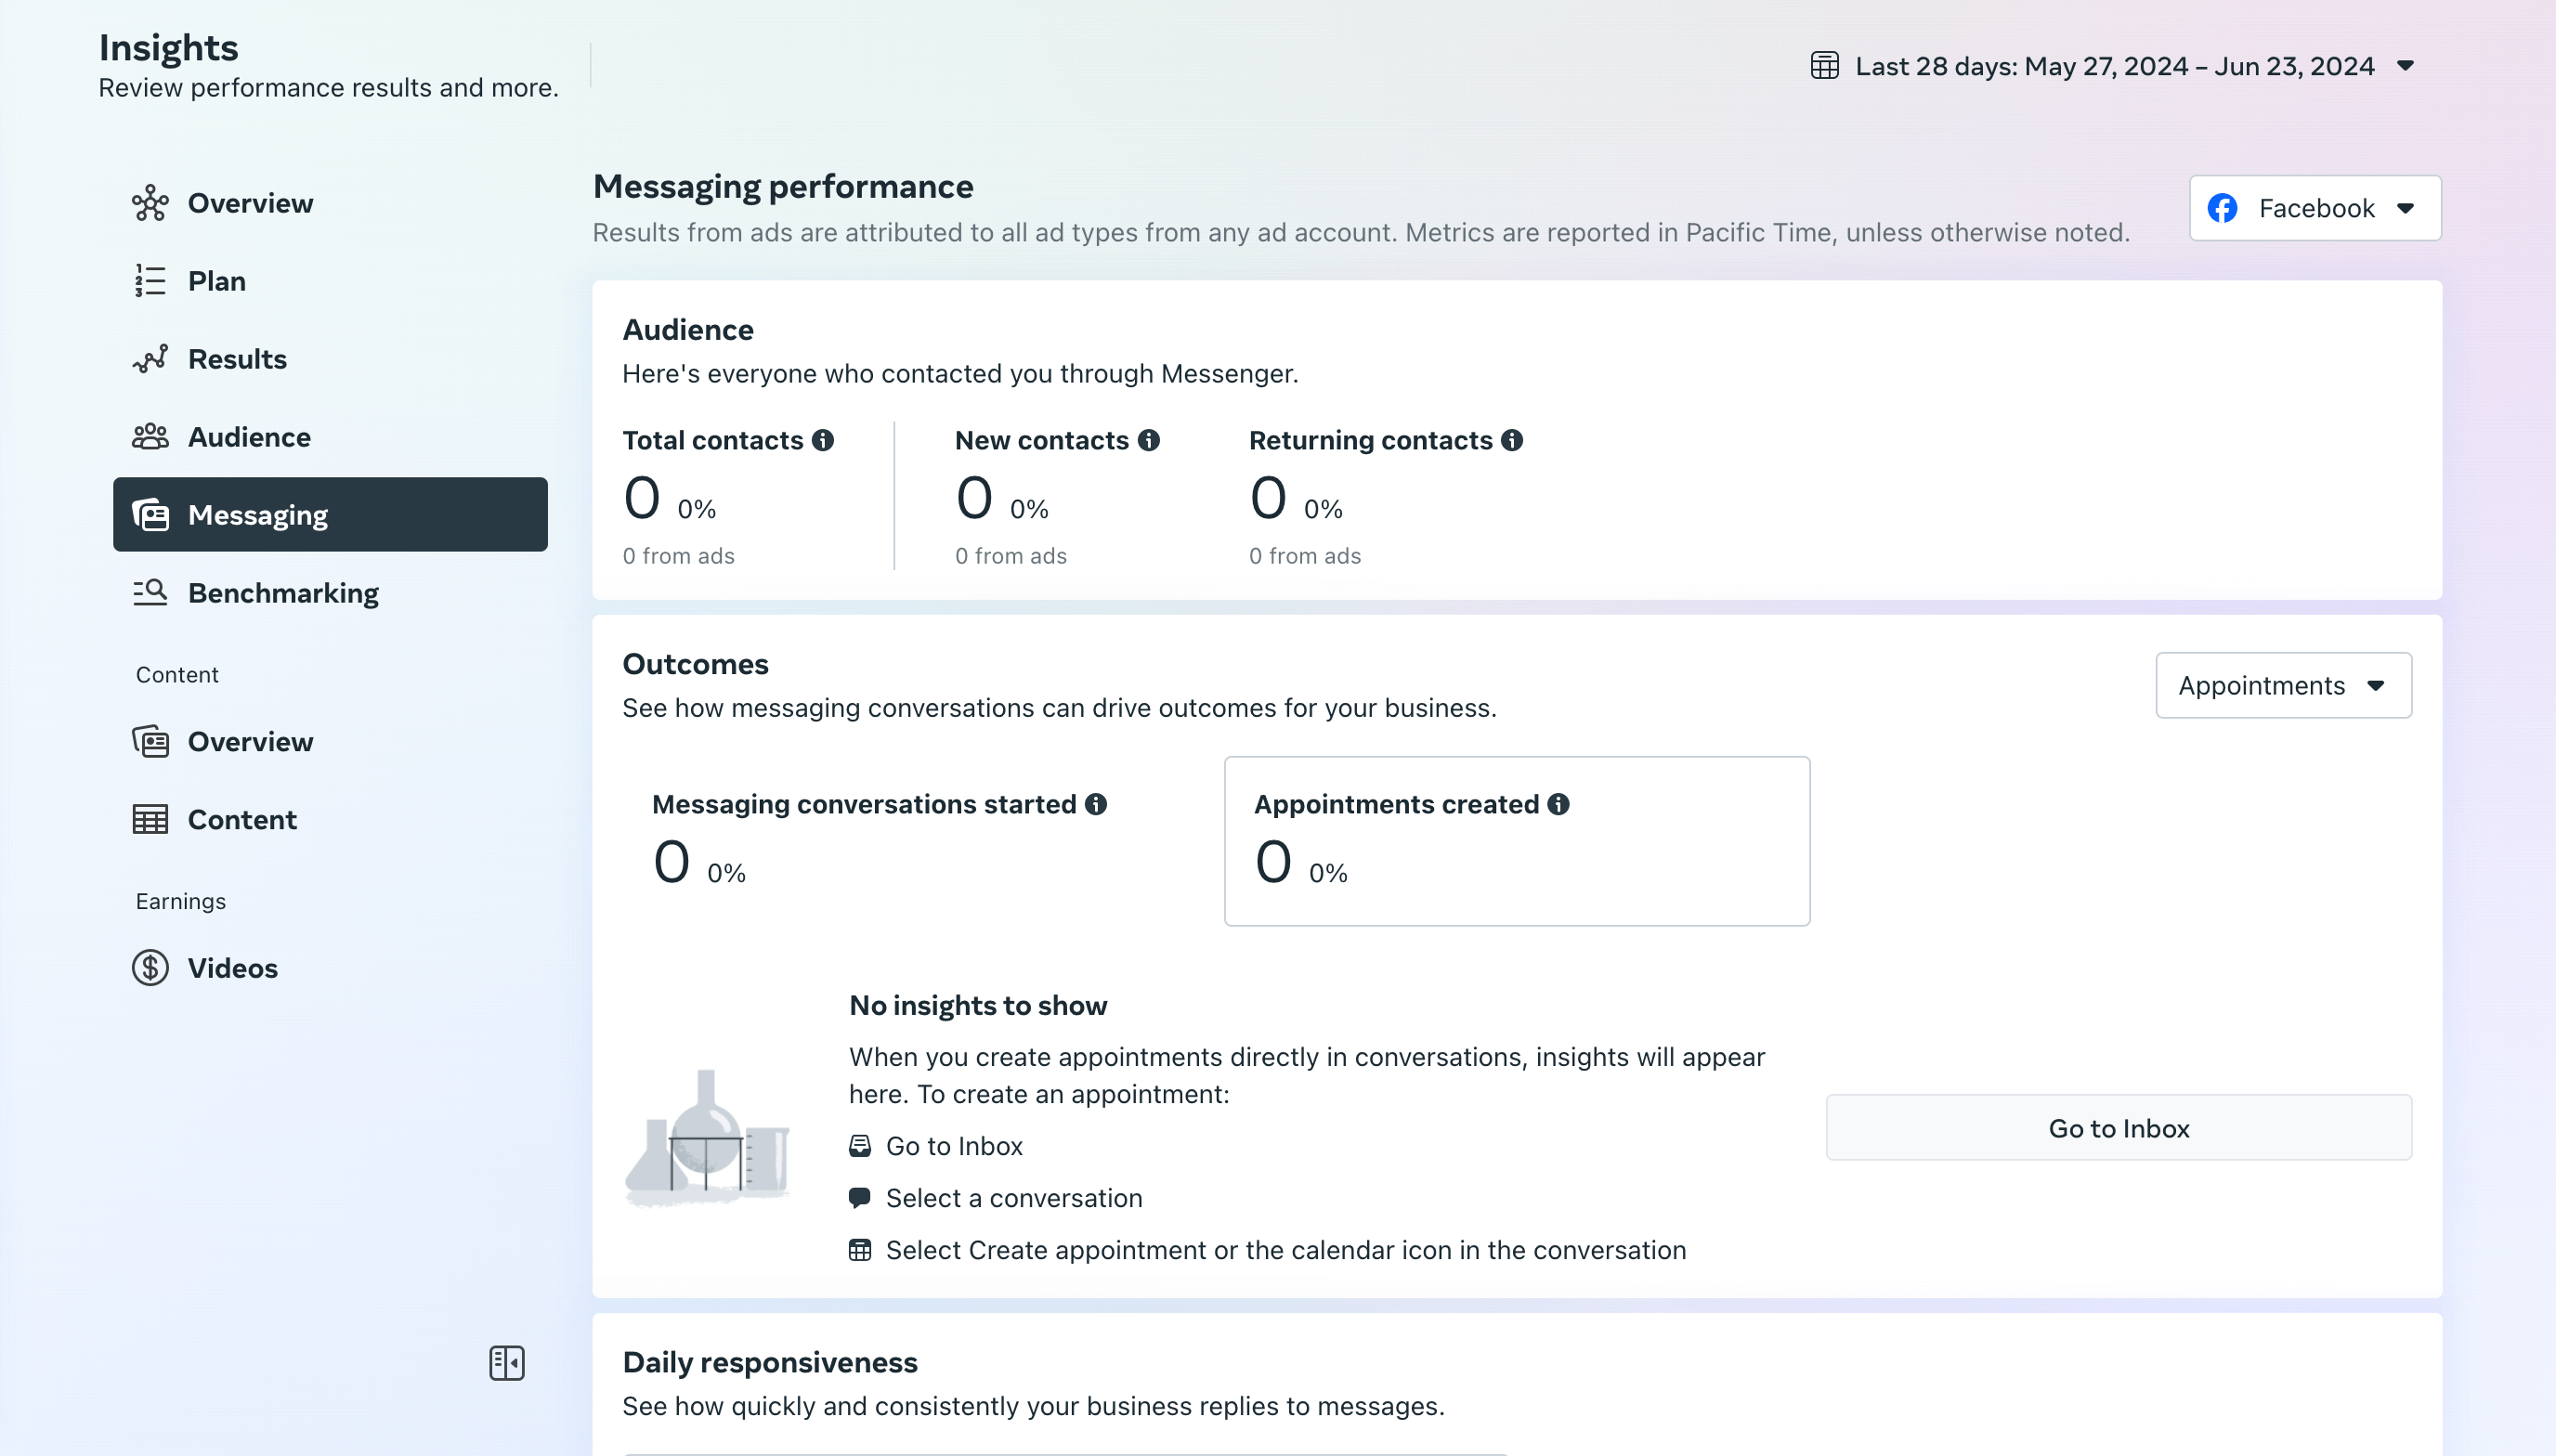
5. Messaging: If you practice any form of customer service via your Facebook Page, this section is a goldmine. You can see how many people contacted you via direct messages (DMs), admins data, number of people who were returning contacts, your response time, and how many of your Facebook conversations converted into booked appointments (if you use that feature).
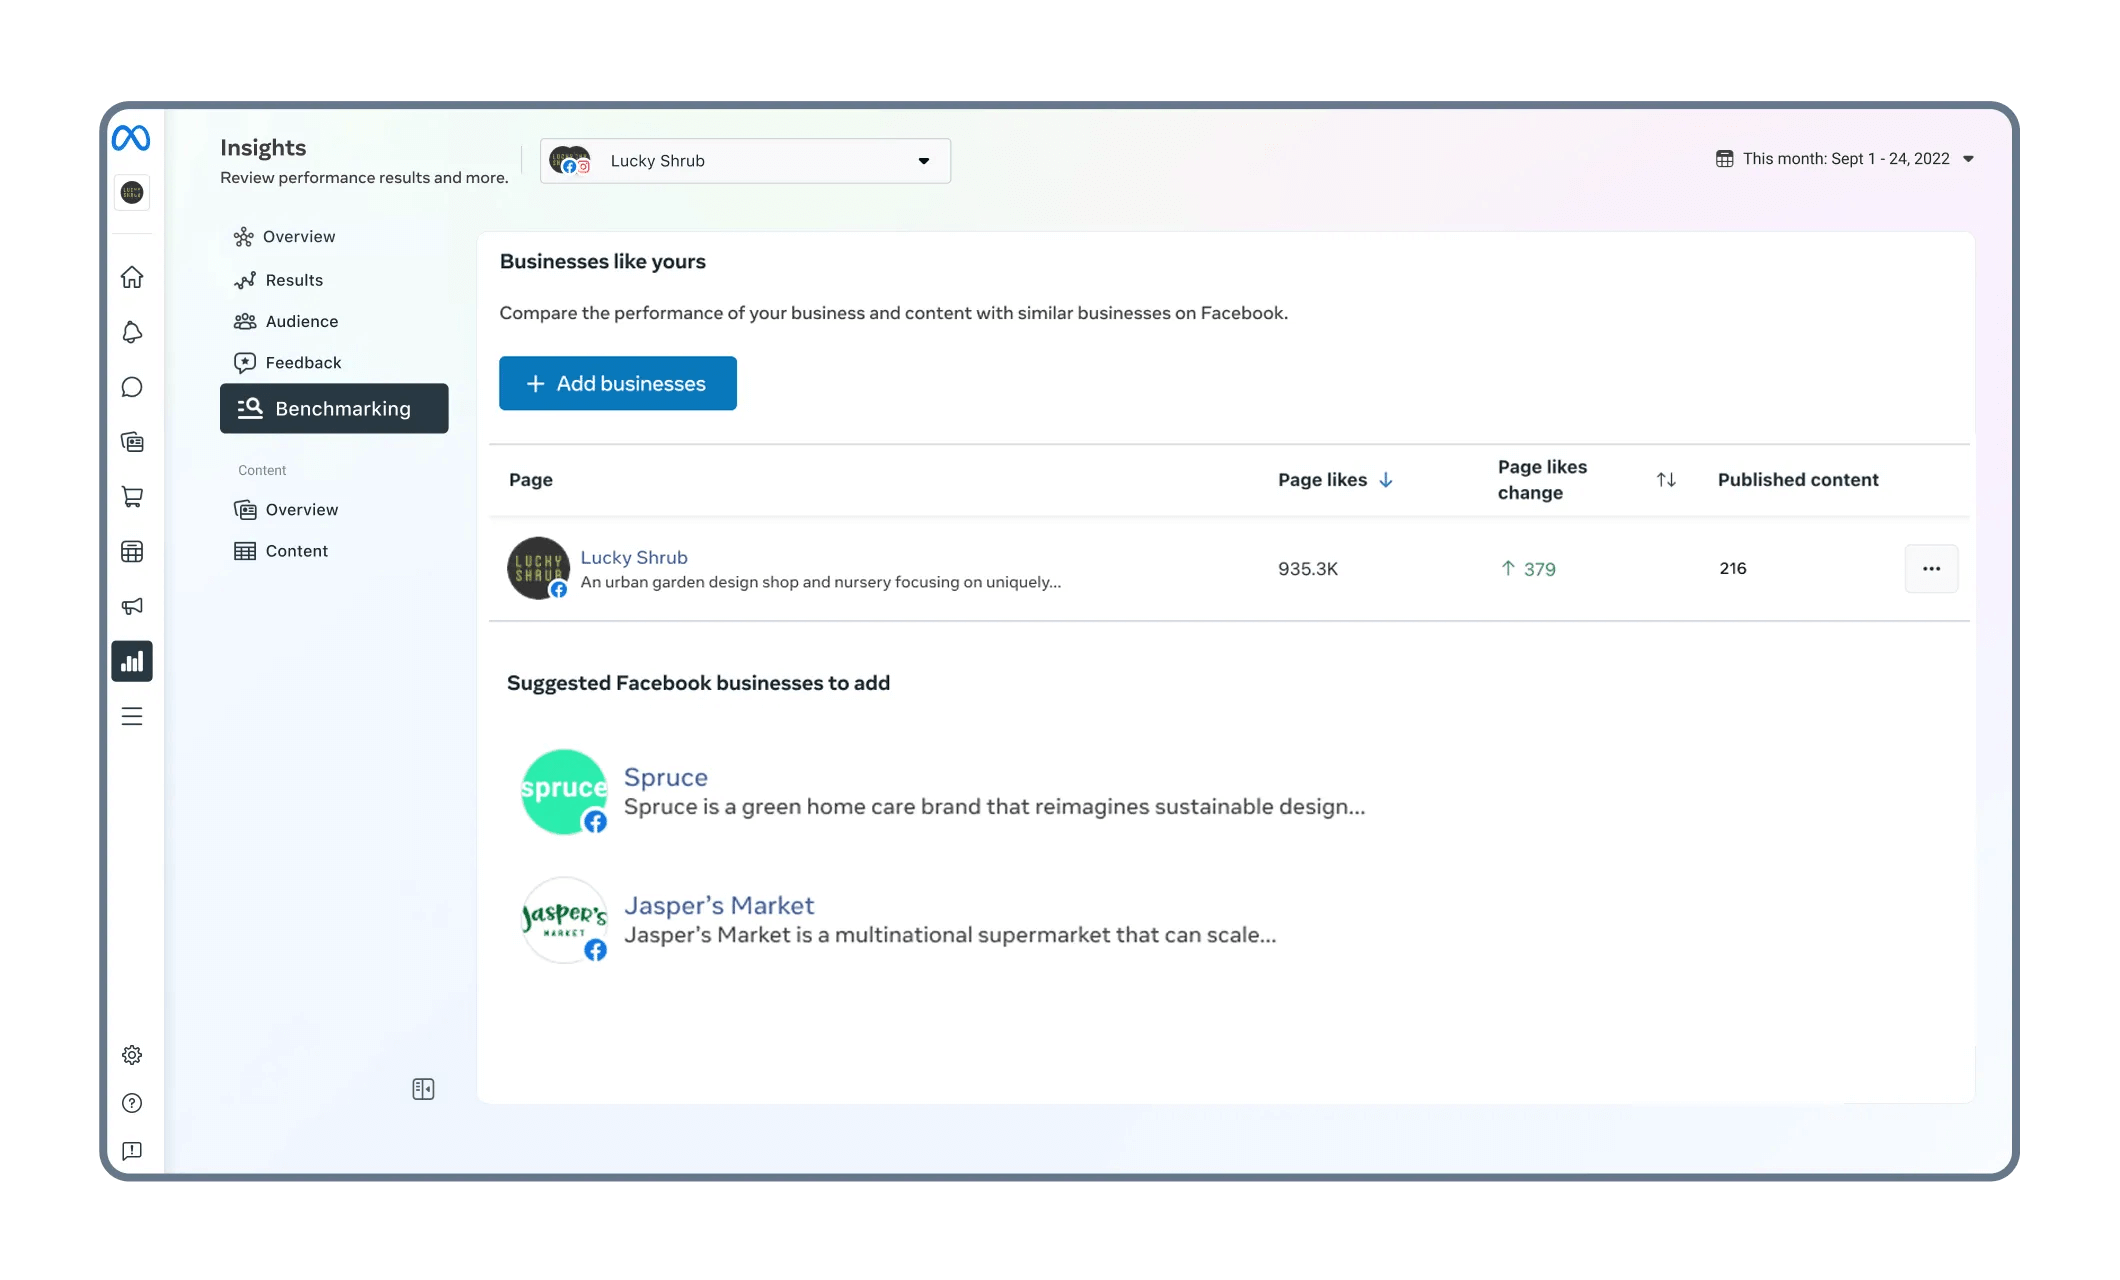
6. Benchmarking: This is the place where you can compare your Facebook performance to businesses that look like yours. You can either add your industry and evaluate insights like your comparative social media frequency to other companies in the same niche, your total followers & engagement vs. theirs, etc. This is in the “Business comparison” header.
Or, you can also add specific competitors and their Facebook Page(s) to compare your Facebook analytics to theirs. This is in the “Businesses to watch” header.
7. Overview (under “Content”): In this section, you can draw minute insights into every single Facebook post — from Facebook Reels to Facebook Stories. You can see your top content formats, audience retention, and also breakdown this data to compare organic vs. paid or followers vs. non-followers.
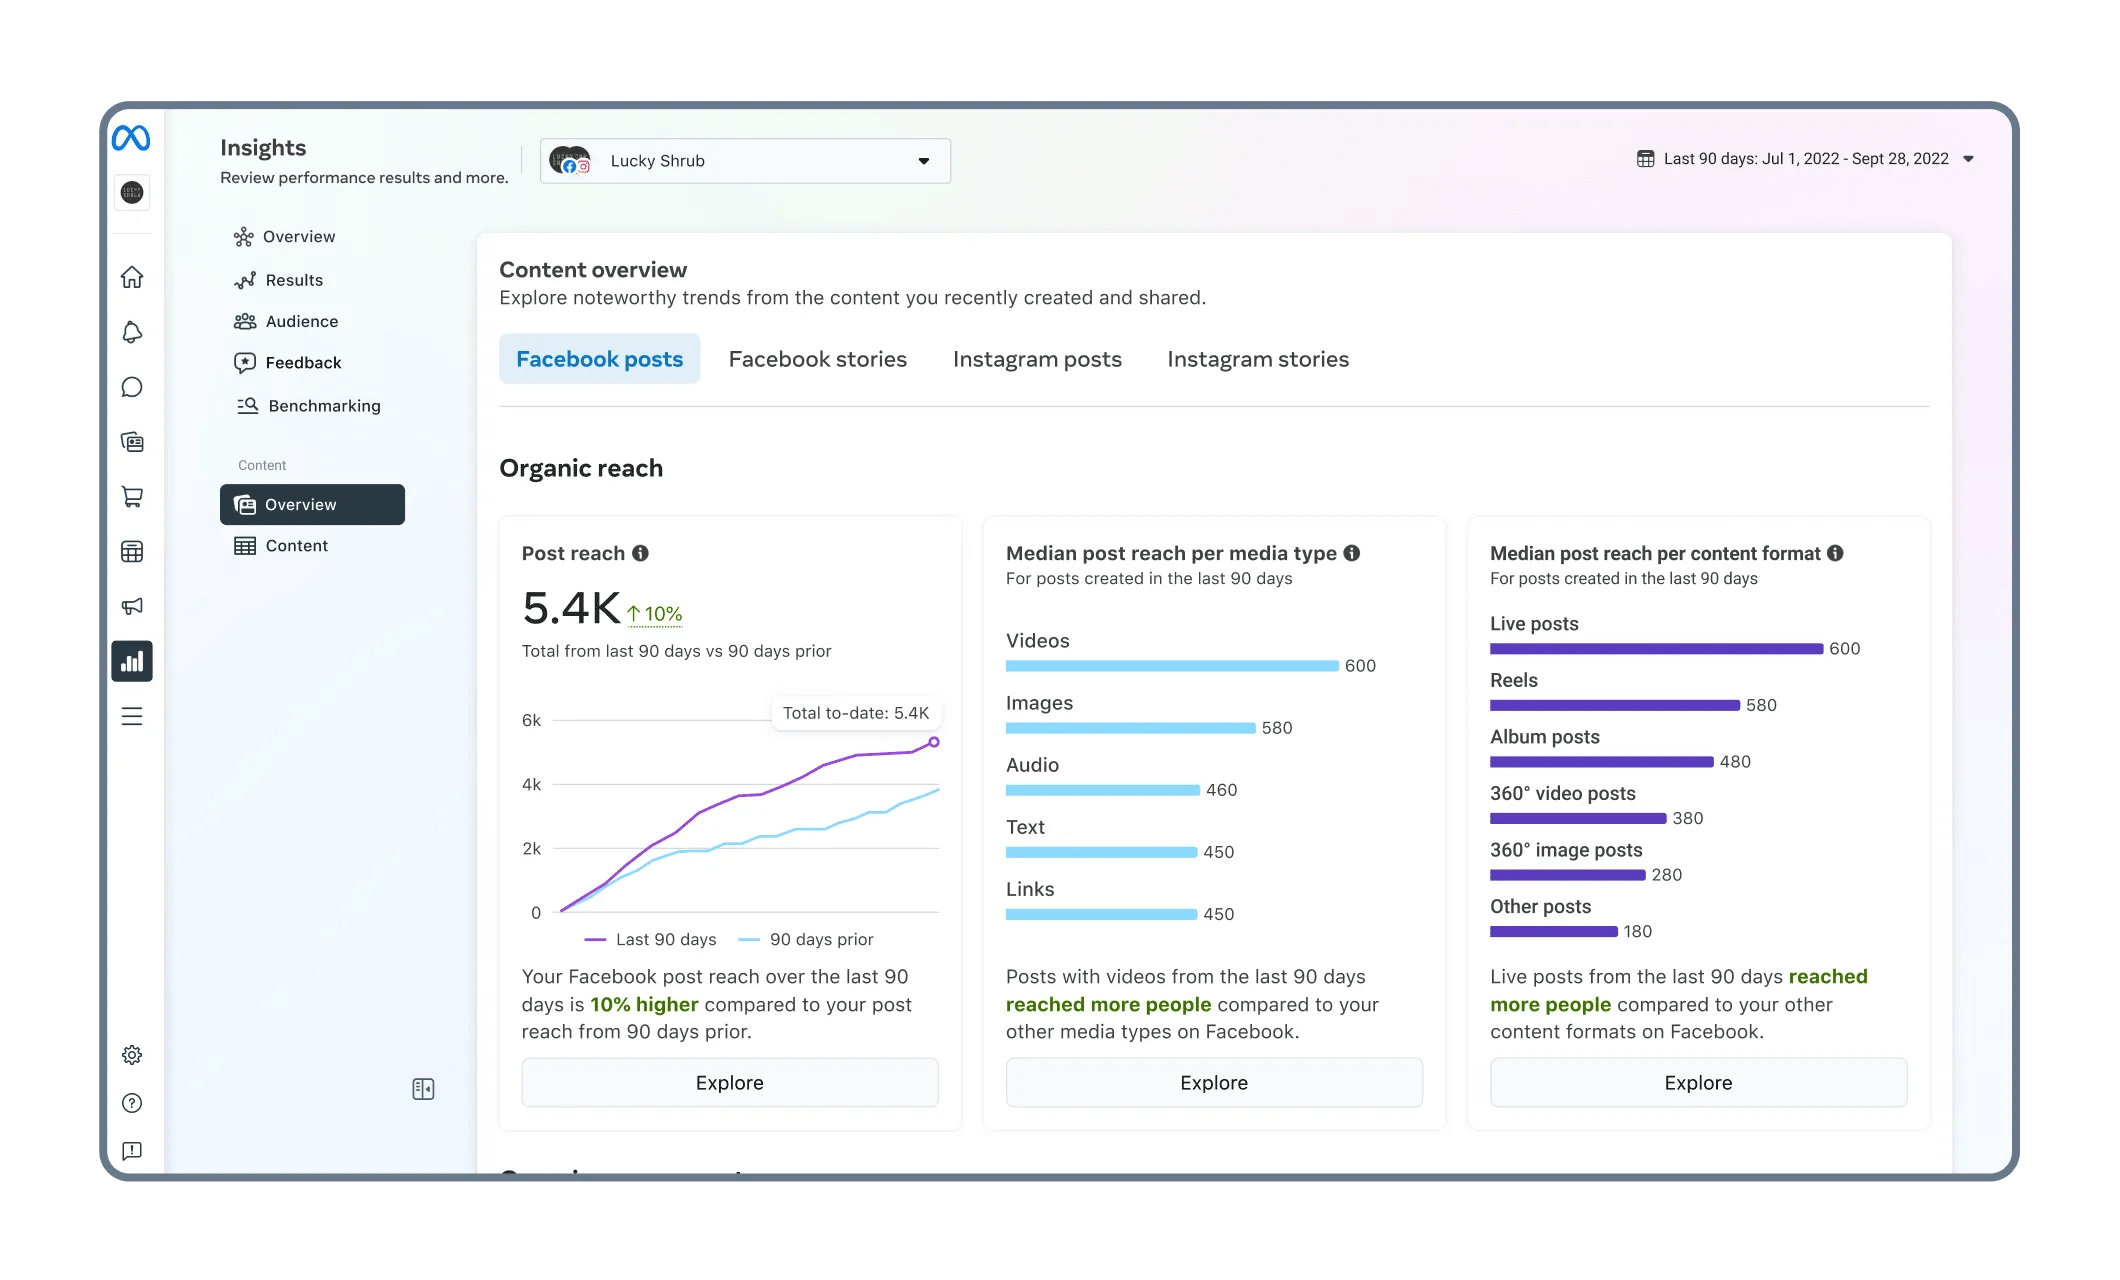
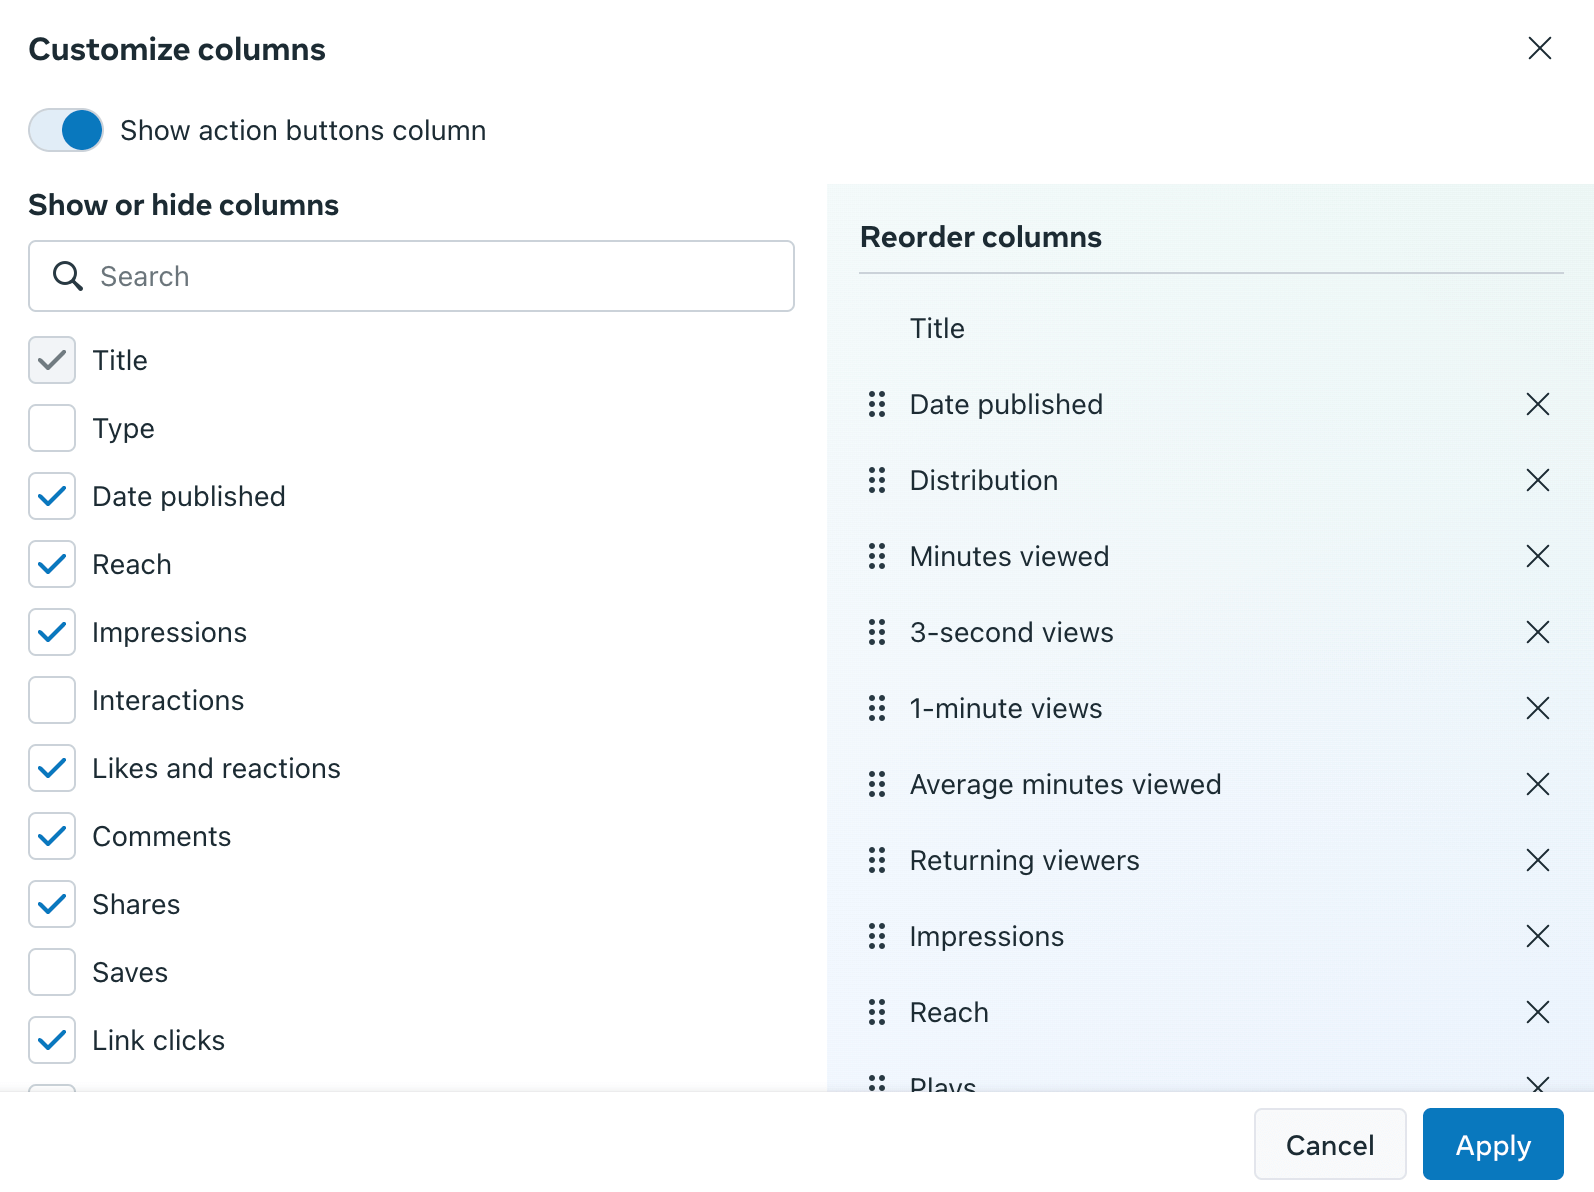
8. Content: Here, you can build customized performance charts by filtering for posts or Stories or both, media types, and marketing channels (organic or paid) on one side.
(If you’re also running an Instagram marketing strategy, you can add that to the graph to get a cumulative performance chart.)
For the other side, you can choose from a plethora of Facebook analytics like impressions, reach, replies, sticker taps, etc.
Meta business suite is an excellent place for Facebook analytics, but it can be a bit overwhelming in the beginning. Converting these analytics to actionable Facebook insights also requires some work and practice.
3: Meta ads manager
If you’ve created ads on Facebook, you need insight into how they’re performing to calculate and improve your return on investment (ROI). The Meta ads manager helps you do just that.
Note: Facebook ads manager and Meta ads manager are the same thing.
After you’ve run your ad campaigns on Facebook, the Meta ads manager can give you extensive statistics into how they’re received in the wild. There are two tabs in the Facebook ad manager:
1. The overview tab gives you basic metrics of reach, impressions, link clicks, cost per thousand impressions (CPM), click through rates, etc., for all your ad campaigns in a table format right next to your campaign name. You can add filters using the drop-down menu to customize this data and find exactly what you’re looking for.
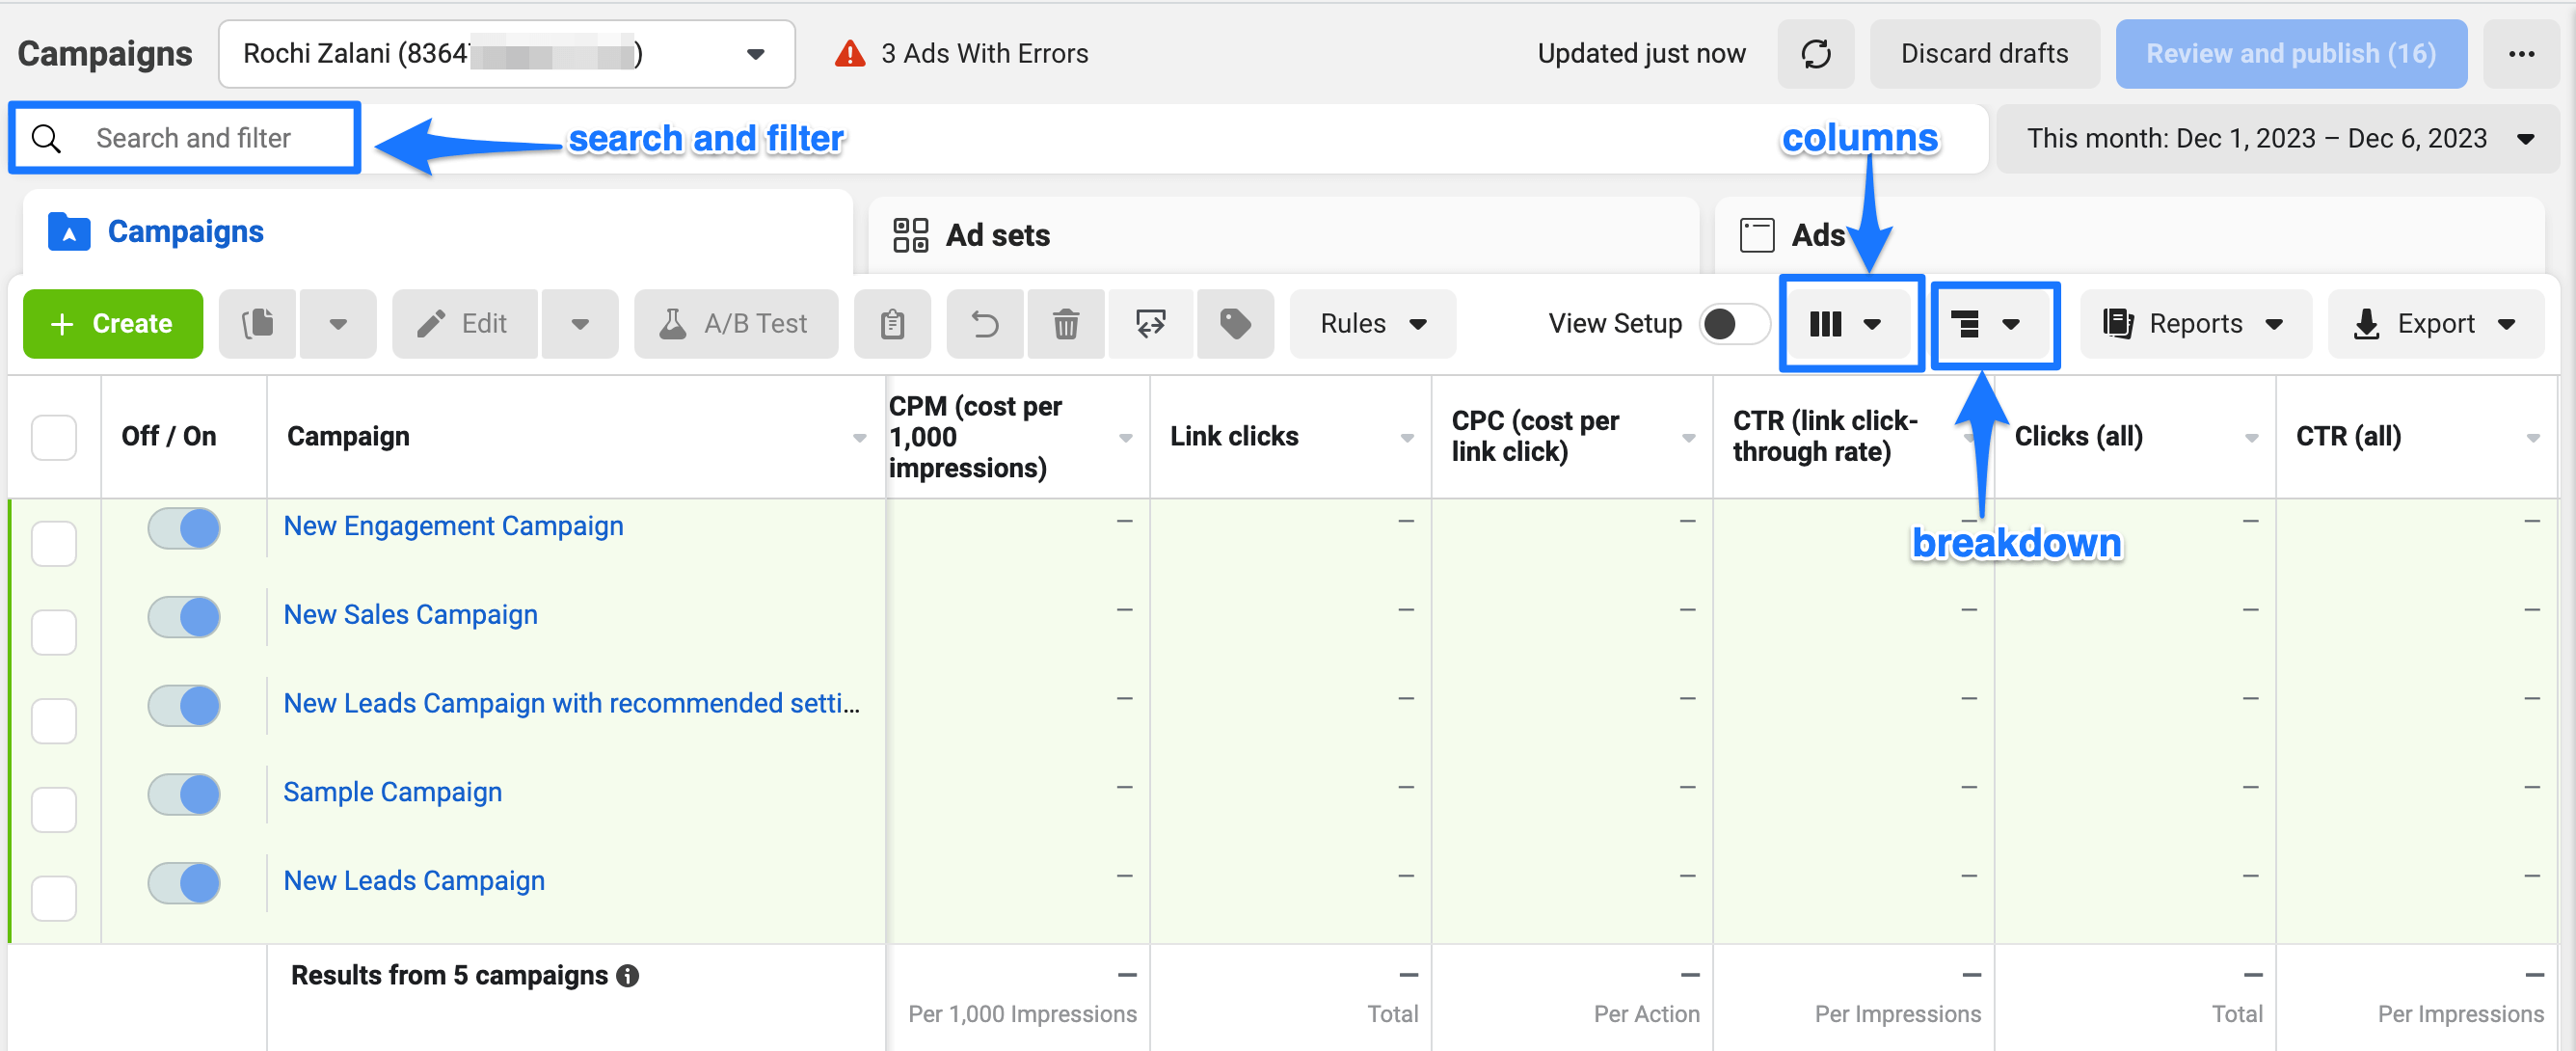
2. The ad reporting dashboard enables you to do the exact same thing. You can apply various filters to customize rows and columns — except here, you can also export them as a CSV file or a shareable link. You can also make this a recurring report by duplicating the analytics and switching the timeline.
4: Facebook groups
If building a community is a part of your social media strategy, Facebook groups are an excellent place to start.
Once you’ve been at it for a while, Facebook gives you valuable group insights. You can learn:
1. Individual post insights
2. Top contributors to explore partnership opportunities or a reward system
3. Engagement trends — at what time and day do your posts get maximum engagement
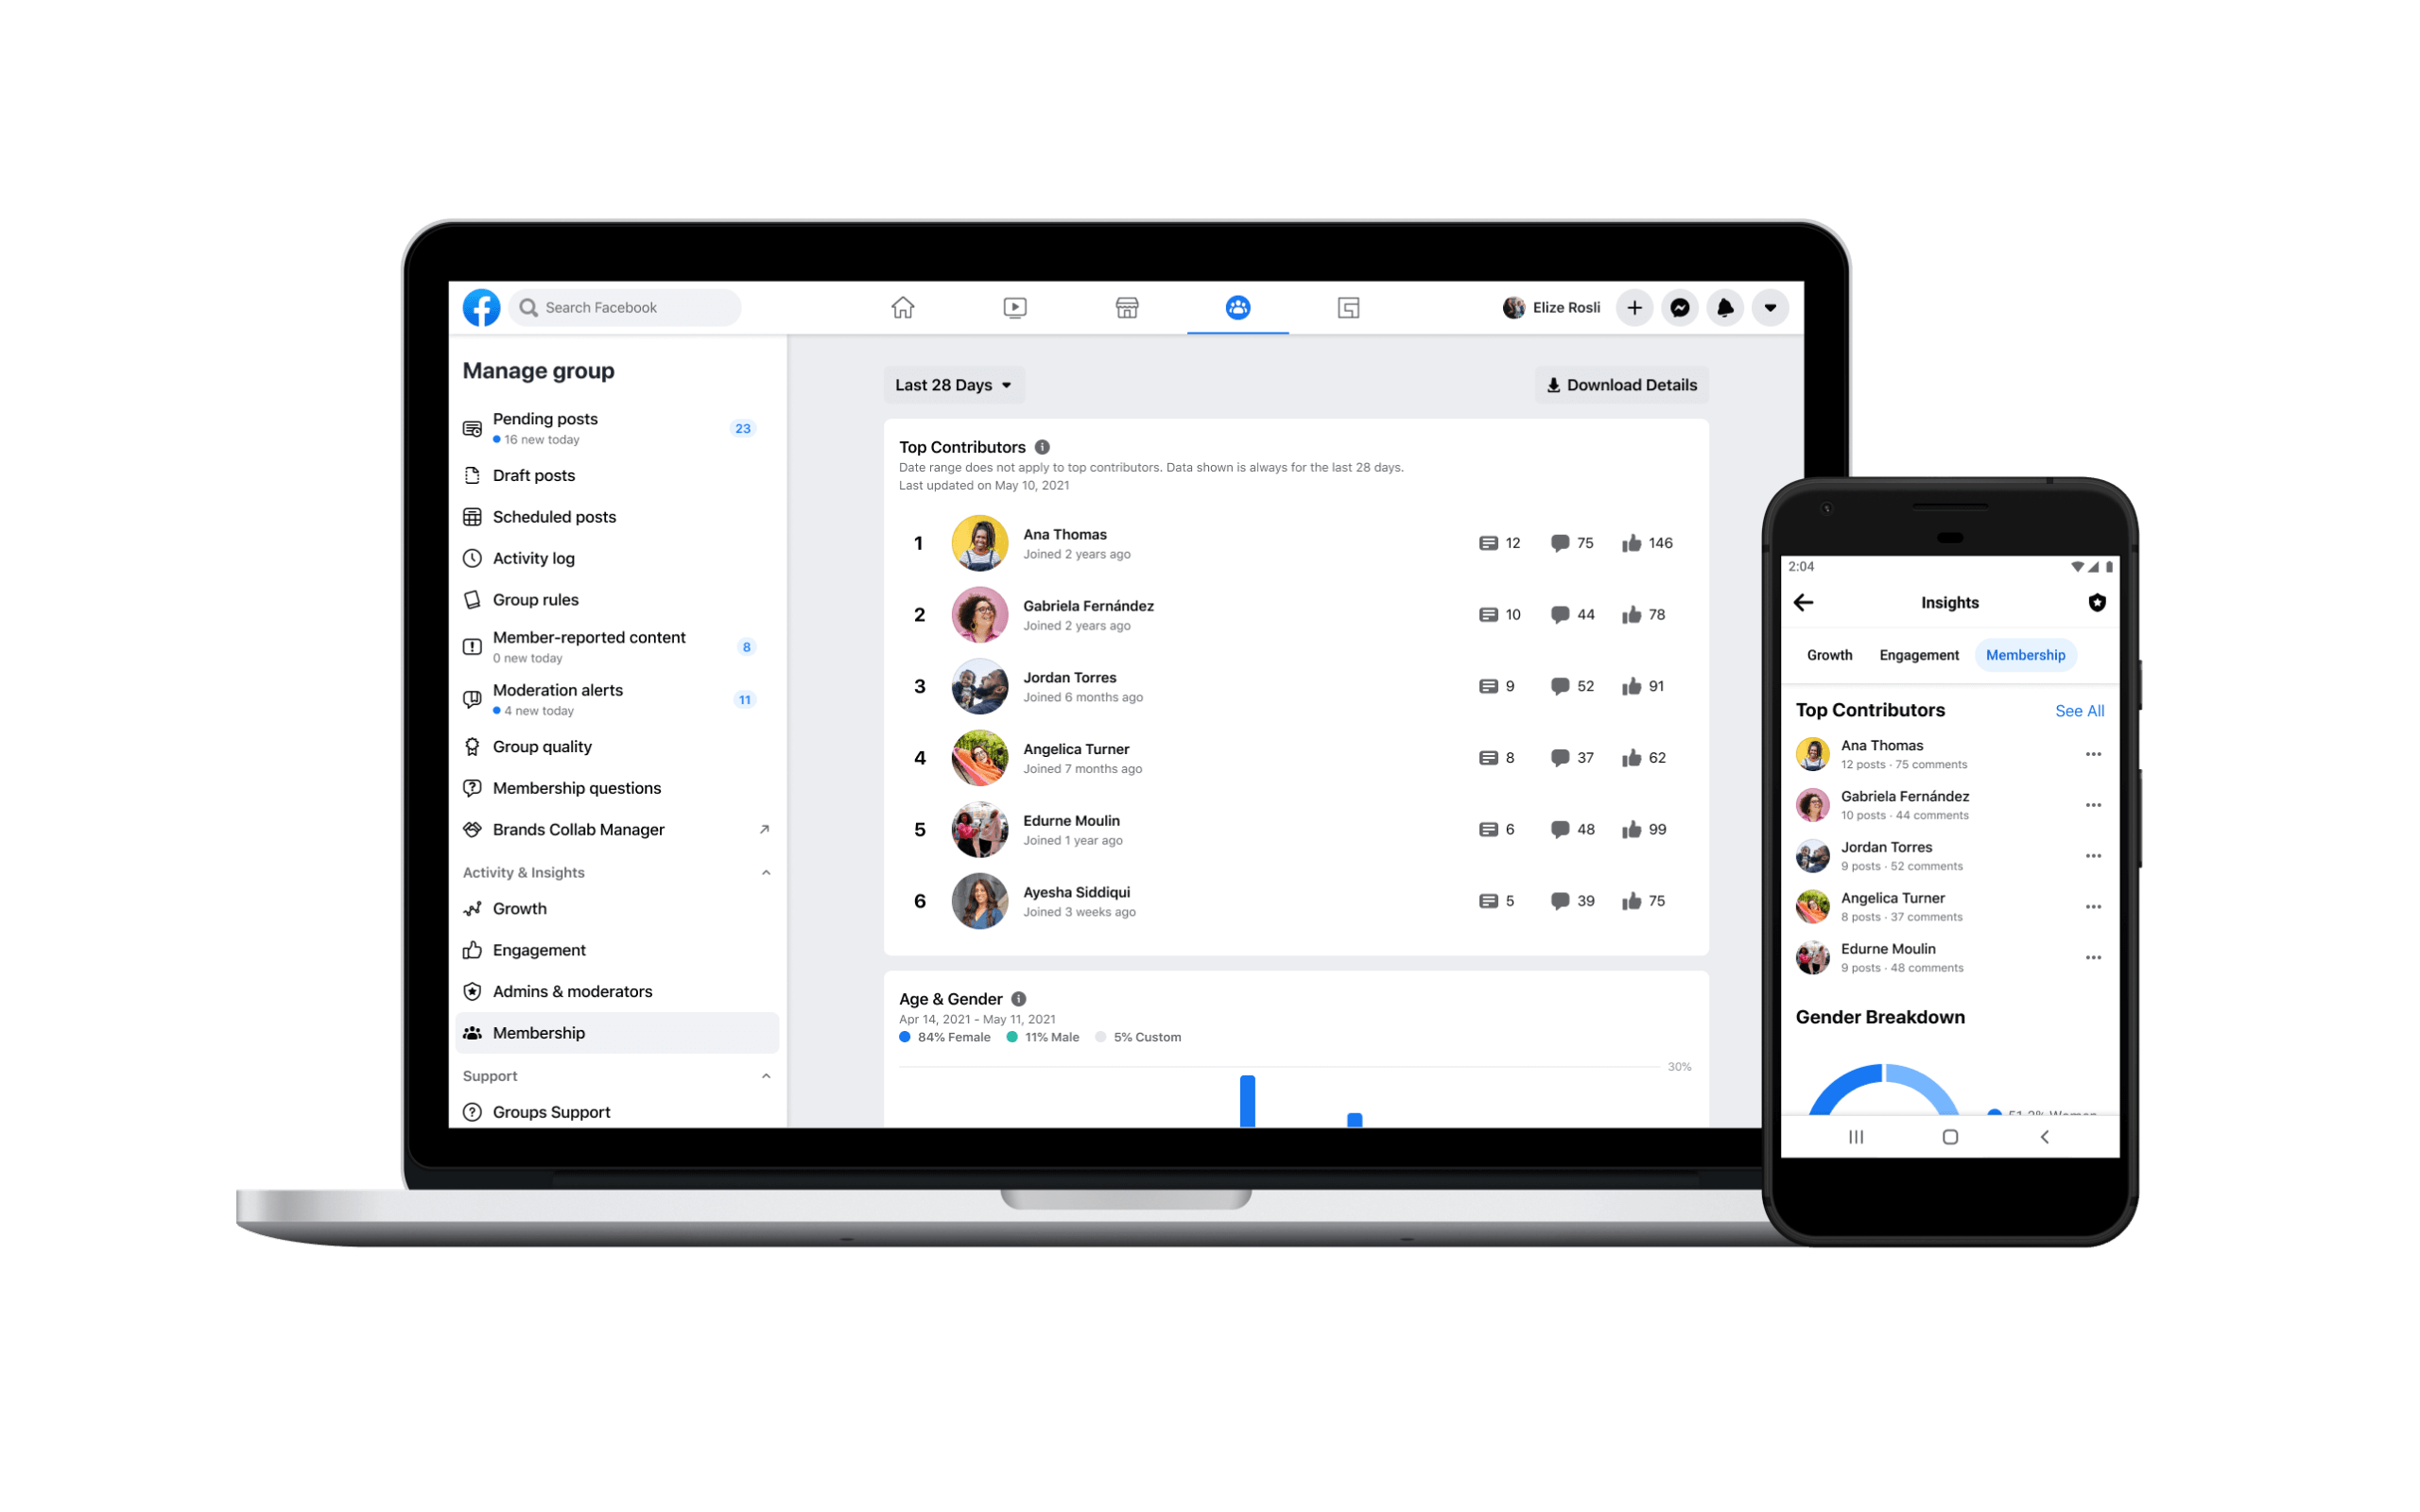
Where are these insights? Enter your Facebook group and click on “Insights” in the menu on the left menu.
⚠️ Note: Facebook group insights are only relevant for your Facebook community. What hits on the group might not necessarily perform well on your Facebook page. Use group insights to dictate what you post on your Facebook group, how you interact with members, and gather feedback.
Read more: 22 Top Social Media Analytics Tools in 2024 — Free and Paid Options and How to Use Facebook to Market Your Business
How to access Facebook analytics using Buffer (and why you should)
Third-party tools — like Buffer — also offer Facebook analytics. But why should you use them if you know the ins and outs of the Meta world?
1. Buffer is a social media marketing tool, so it also helps you do related social media management activities like schedule content, cross-post it across social media sites in a few clicks, and use AI to assist with caption-writing (among a host of other things). All this and more in just one tab.
2. You can gather cumulative insights data across social media platforms in one place and filter them however you like. That’s a lot of flexibility!
3. Buffer is way easier to use than any of the Meta tools. You can convert analytics to insights, fast (without scratching your head to find what you need). There’s minimal to no learning curve to Buffer. Meta tools take a while to master.
4. You can build campaigns in Buffer and analyze their performance separately from your out-of-campaign posts.
In Buffer, you get all the basics like impressions, follower growth, reach, link clicks, and more. But you can also directly find the answers to questions like:
- Which type of posts get me the highest engagement on Facebook?
- How are my organic posts faring compared to my paid ads?
- What is the best time to post on Facebook for my Page?
- What is the best frequency for me on Facebook?
- What are my audience demographics?
The cherry on top? You can use Buffer to get insights into your Facebook Page and your Facebook Group (plus all your other social media profiles too).
Which are the Facebook analytics that truly matter?
Once you dip your toe into Facebook analytics, you realize the numbers in this universe are endless. You can examine every single post, run campaigns and measure how they did, create ads & groups, and see their performance…it’s a lot of data.
How do you make sense of the noise?
1. Start simple. First, focus on finding your ideal posting frequency, the best time to post, and the best days to post. Make these your key metrics. This will take a while because you’ll need consistency to get accurate data.
2. Then, go deeper and find which types of posts perform the best for you. Spot a pattern. Are all the posts that get the most engagement videos? Or are they text-based posts? Do customer reviews get more link clicks than product tutorials? All these insights data will help you learn where to double down your efforts.
Keep going by reviewing your analytics every so often. Create reports to see the insights in the analytics (Buffer's weekly takeaways can help with this too). If you keep showing up, you’ll see patterns emerge and understand the numbers that truly make a difference.
Try Buffer for free
200,000+ creators, small businesses, and marketers use Buffer to grow their audiences every month.


