
Instagram Stories are always the first thing I tap on when I open the app. I love seeing the more personal, in-the-moment updates — the kind of content that’s less polished and more like a window into someone’s day, like a short clip of a creator’s workspace, a sneak peek at a product photoshoot, or a casual poll asking what color to restock.
Stories appear right at the top of the app, which means your audience sees them before they even start scrolling. They offer a low-pressure way to show up consistently when your followers open Instagram.
Key takeaways
- Visibility: Stories appear at the top of the app, ensuring your content is seen before users start scrolling.
- Engagement: Use interactive stickers like polls, quizzes, and 'Add Yours' to turn passive viewers into active participants.
- Strategy: Aim to post one to seven stories daily to stay top of mind, and make sure followers tap through them all.
- Conversion: The link sticker is available to all accounts, making it a great way to drive traffic to external sites.
- Longevity: Use highlights to save important stories permanently on your profile for new followers to discover.
Jump to a section:
- What is an Instagram Story?
- Why post Instagram Stories?
- How to post an Instagram Story
- Different types of Instagram Stories
- How to use Instagram Story stickers to boost engagement
- What are Instagram Story highlights?
- Instagram Story analytics
- Building an Instagram Story strategy that works
- Take your Instagram Stories to the next level with Buffer
- FAQ about Instagram Stories
- More Instagram resources
What is an Instagram Story?
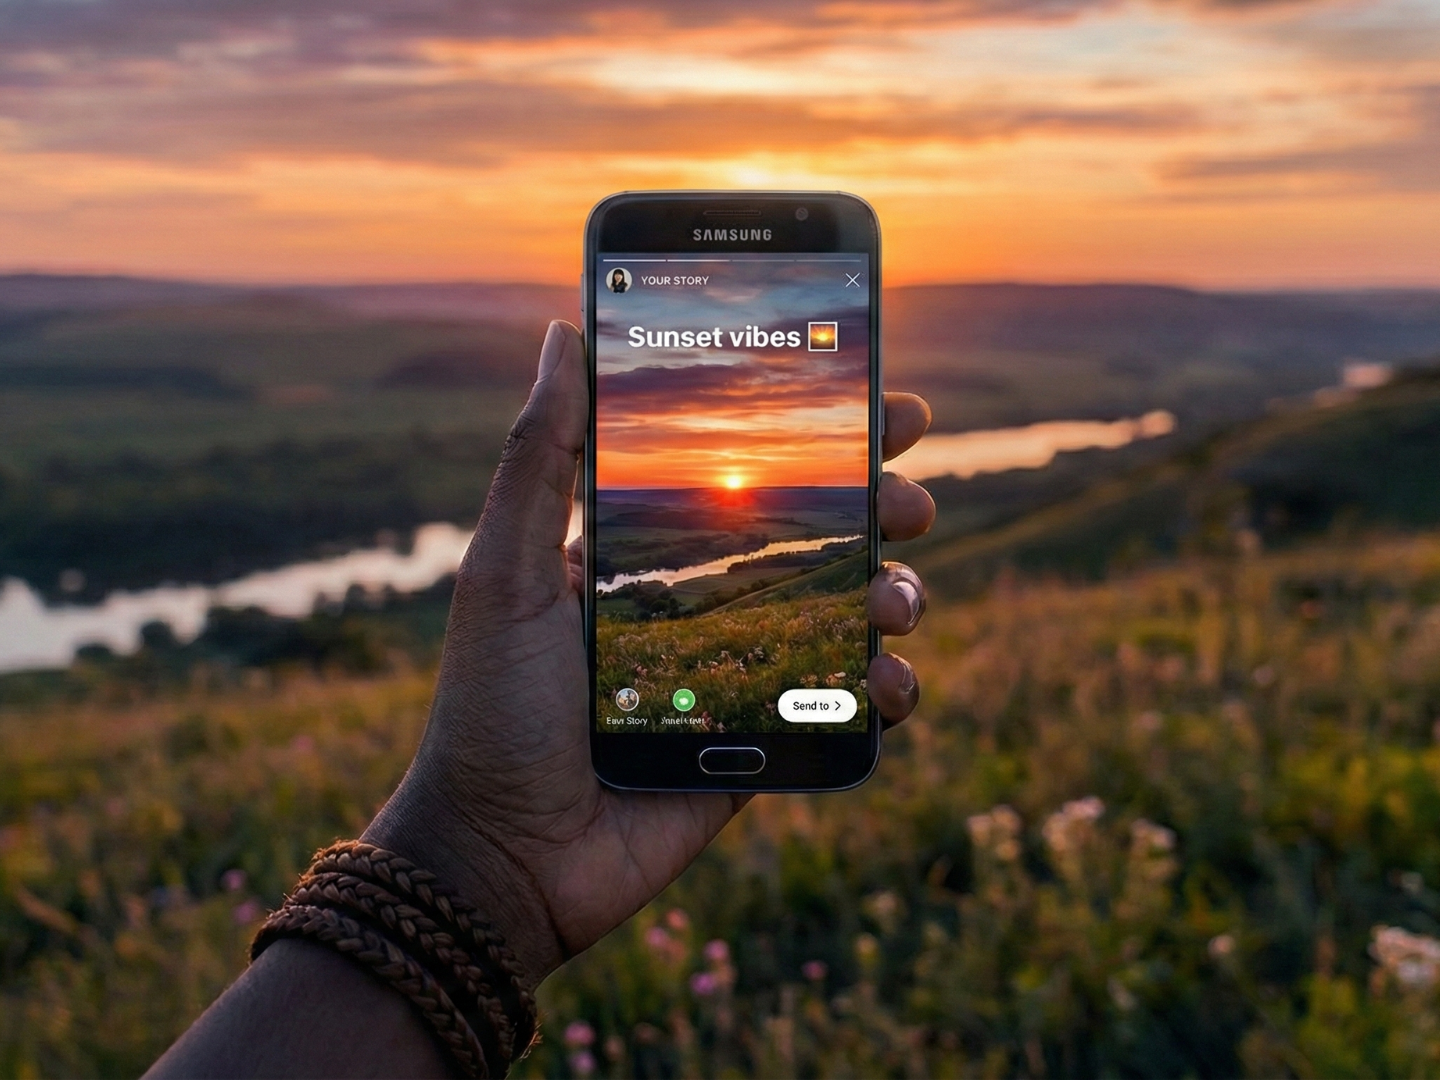
An Instagram Story is a feature that allows users to post photos or videos that automatically disappear within 24 hours. They appear in a vertical format and are fast, memorable, and fun by design.
When you post a story, a colorful ring appears around your Instagram profile picture, telling your followers they can tap on your profile photo to see what you've just posted.
Followers can also reply to your stories through DMs or interact with them using stickers like polls and questions, making stories feel more like a two-way conversation than a one-way broadcast.
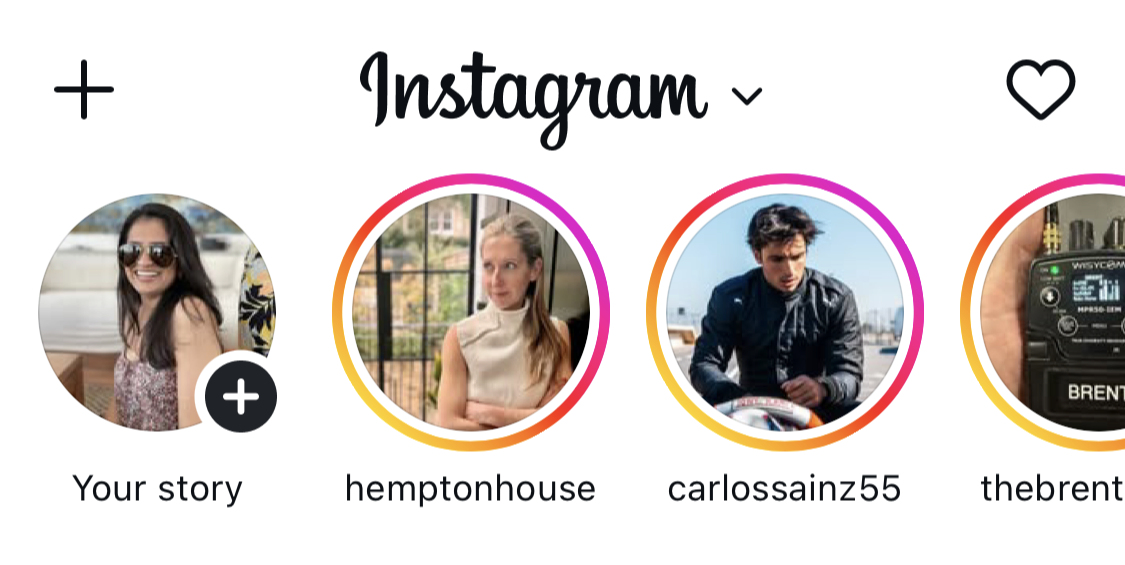
Your profile picture with the colorful ring around it also gets added to the top row of your followers’ home screens — known as the stories tray— making it the first thing they see when they open the Instagram app.
Instagram Stories are an ideal way for creators and brands to experiment with different kinds of content because, unlike your permanent curated feed, stories disappear in 24 hours.
You can also limit who sees a story by sharing it only with your Close Friends list — handy for behind-the-scenes peeks, client-only updates, or anything you’d rather keep to a smaller circle.
Small business owners use their stories to post everything from unedited videos at work to photos of their new products and short clips of them answering FAQs.
If you're a creator, stories are a great place to be a little more relaxed — taking followers along for a day, sharing behind-the-scenes moments, or talking with your audience about something you're both going through.
Why post Instagram Stories?
Stories aren’t designed to bring in new followers. They help you stay close to the ones you already have.
Adam Mosseri, Head of Instagram, described them as “a way to reach your most passionate audience.”
Instagram adds built-in interactive tools that make stories so effective. You can run polls, add questions, or link directly to a product if you sell on Instagram.
Instagram launched stories in 2016, and it didn’t take long for the feature to catch on. Within two years, more than 500 million people were creating and watching stories daily.
In short, stories can help you:
- Stay visible and top of mind with followers — stories appear at the top of the app, making them one of the most visible placements.
- Increase engagement and build loyalty over time through interactive features like polls, questions, and quizzes.
- Drive traffic and conversions — half of Instagram users have visited a website to make a purchase after seeing it in stories.
How to post an Instagram Story
Ready to post your first (or next) story? Here's exactly how to do it.
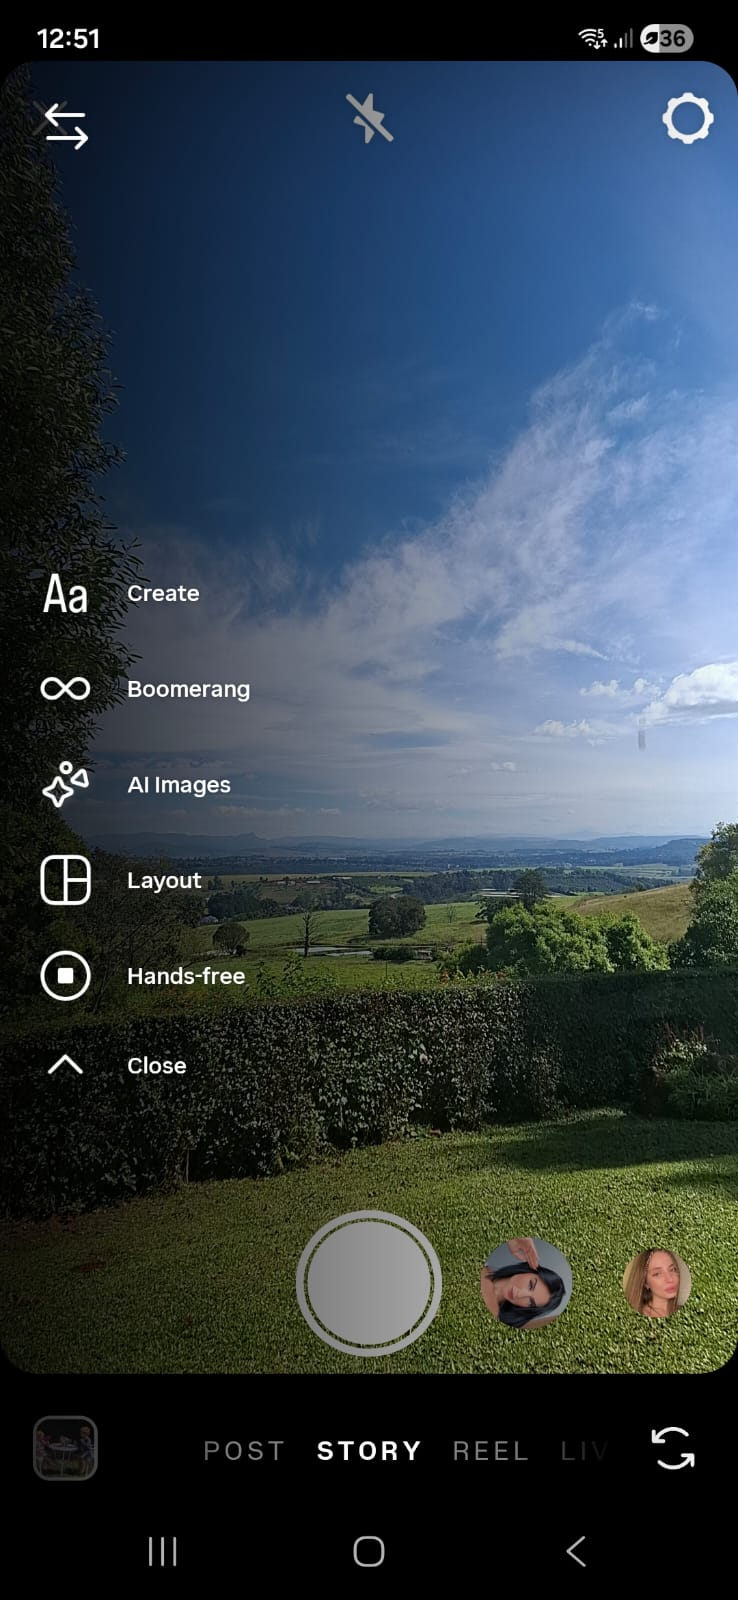
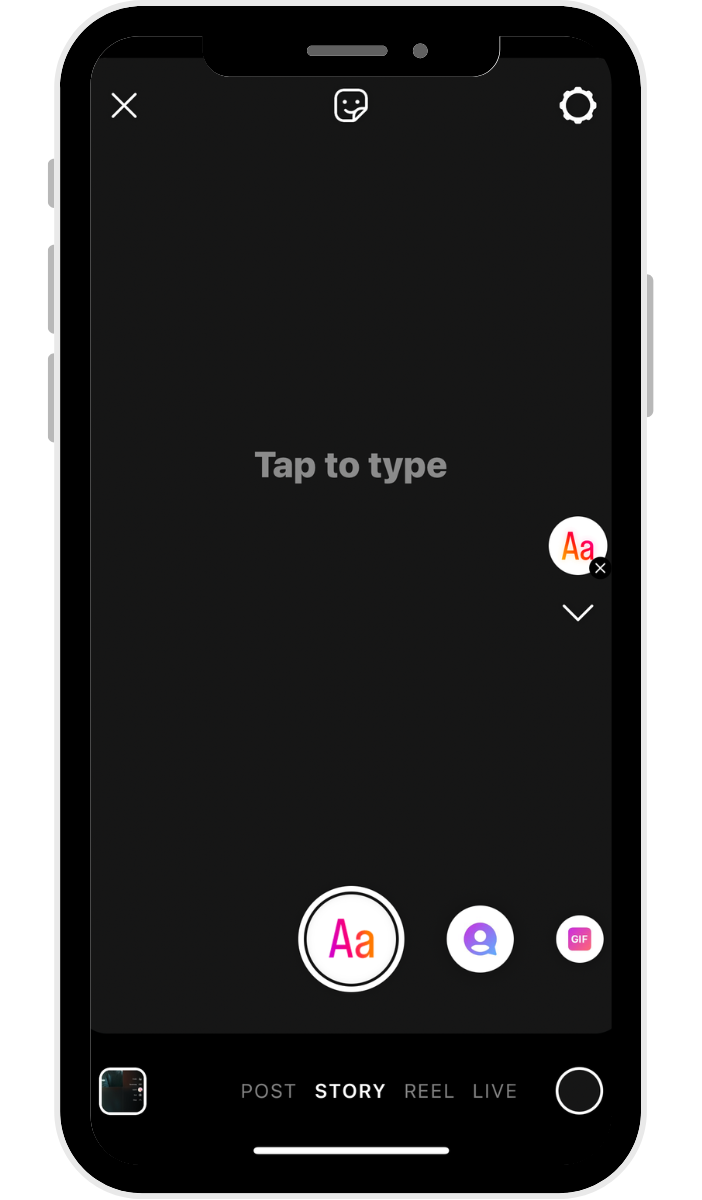
- Open the camera: Tap the + button, and select Story.
- Capture or upload: Tap the white circle to take a photo/video, or tap the album icon to upload media (Dimensions: 1080px x 1920px; Max length: 60s).
- Select story type: Choose from Standard, Create, Boomerang, AI Images, Layout, or Hands-free modes.
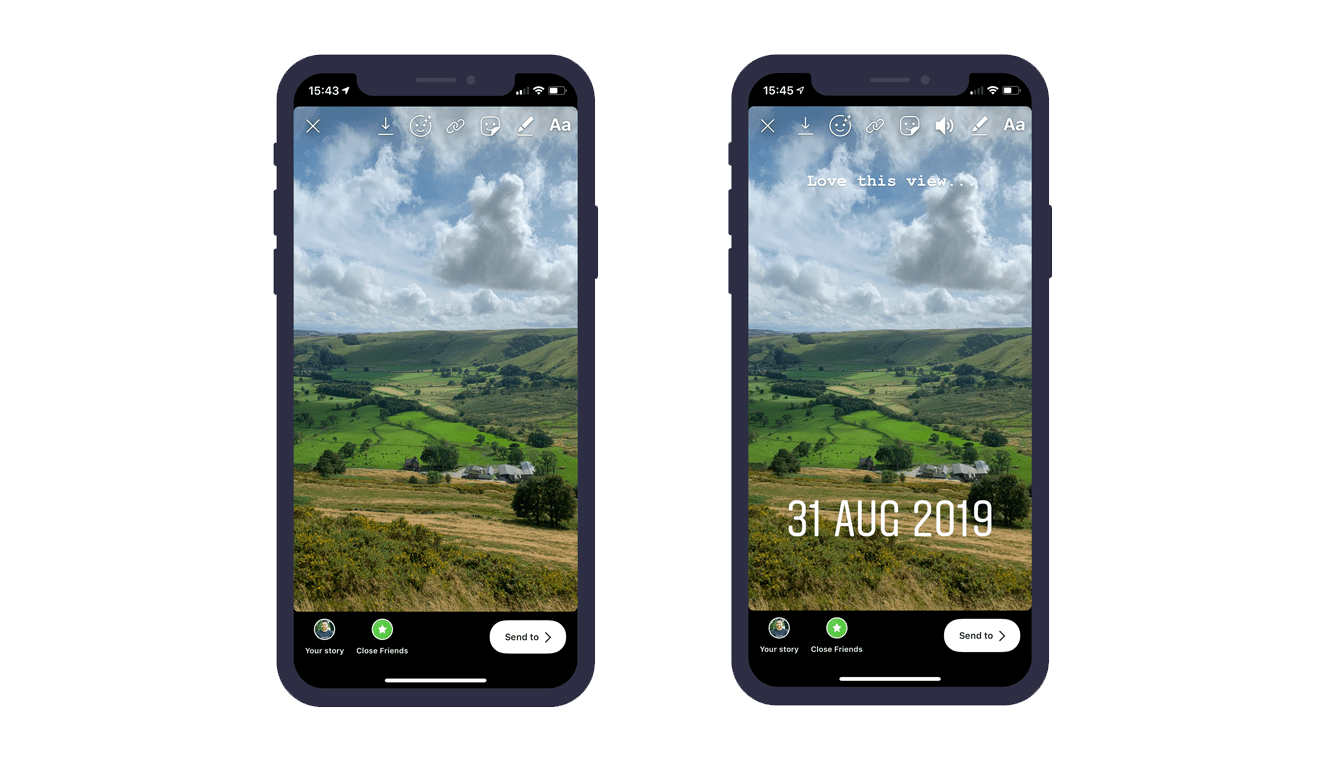
- Add interactive elements: Use the sticker icon to add polls, links, mentions, or music.
- Share: Tap Your story or Close Friends to publish.
⚡ Pro tip: If you want to create stories even faster, you can create your content in bulk and schedule those stories ahead of time with Buffer's planning and scheduling tools. Buffer’s story tools will show you what your story is going to look like when it's live and let you schedule it ahead of time, too.
You’ve also got a few lightweight options for adding other kinds of posts to your stories that work a bit differently:
- As of late 2025, you can add someone else’s story to yours, even if you weren’t tagged in the original post.
- You can also share your own feed posts, reels, and carousels to your stories. Tap the paper airplane icon below the post and then Add to story to create it.
- You can share posts from a few other apps to your stories as well. If a happy customer gives you a shoutout on Threads, or your podcast’s new episode drops on Spotify, tap on Stories or Story in the share menu for that app.
⚡ Pro tip: Prefer to keep your feed posts for your followers only? If your account is public, head to Settings → Sharing and reuse and toggle off Posts and reels to stories. That prevents anyone from adding your content to their own story.
Different types of Instagram Stories
Instagram offers a couple of different Instagram Story types to play with. For more variety, scroll down to our section on stickers.
Standard
What is it? A regular photo or video — the default Instagram Story option. In this mode, you can add filters, which appear at the bottom of the app.
When to use it: This is your go-to for quick, everyday content — a product shot, a short clip from your workspace, or a selfie with a text overlay sharing a thought or update.
Create
What is it? Text or stickers on a solid background. Accounts usually use text stories to pose a question, tell a story, or create mini-blogs within their Instagram Stories.
When to use it: Great for sharing a quick thought, hot take, or announcement when you don't have (or need) a photo or video to go with it.
Boomerang
What is it? A really short video that plays forward and backward on a loop.
When to use it: Perfect for adding a playful, eye-catching moment — like clinking glasses, unwrapping a package, or a confetti toss.

Layout
What is it? A collage of different photos, with a few preset collage options.
When to use it: Ideal for before-and-after shots, showing off multiple product colors, or recapping an event in a single story frame.
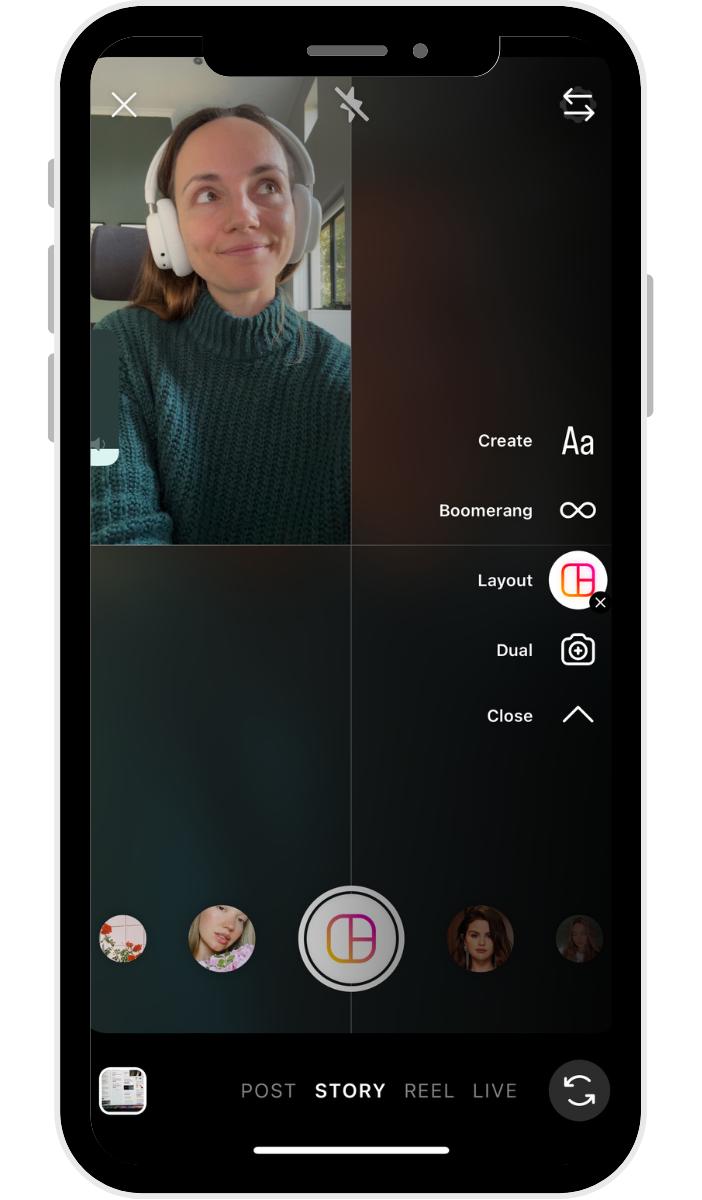
Hands-free
What is it? Video mode where you can record video without tapping and holding the record button.
When to use it: Handy when you need both hands free — like demonstrating a recipe, styling an outfit, or giving a walkthrough of your space.

How to use Instagram Story stickers to boost engagement
Instagram Stories are so powerful because they help you build loyalty and boost engagement by showing the human side of your business. Stickers are one of the best tools Instagram has built into stories to help you connect with your audience — and they're a lot of fun to use.
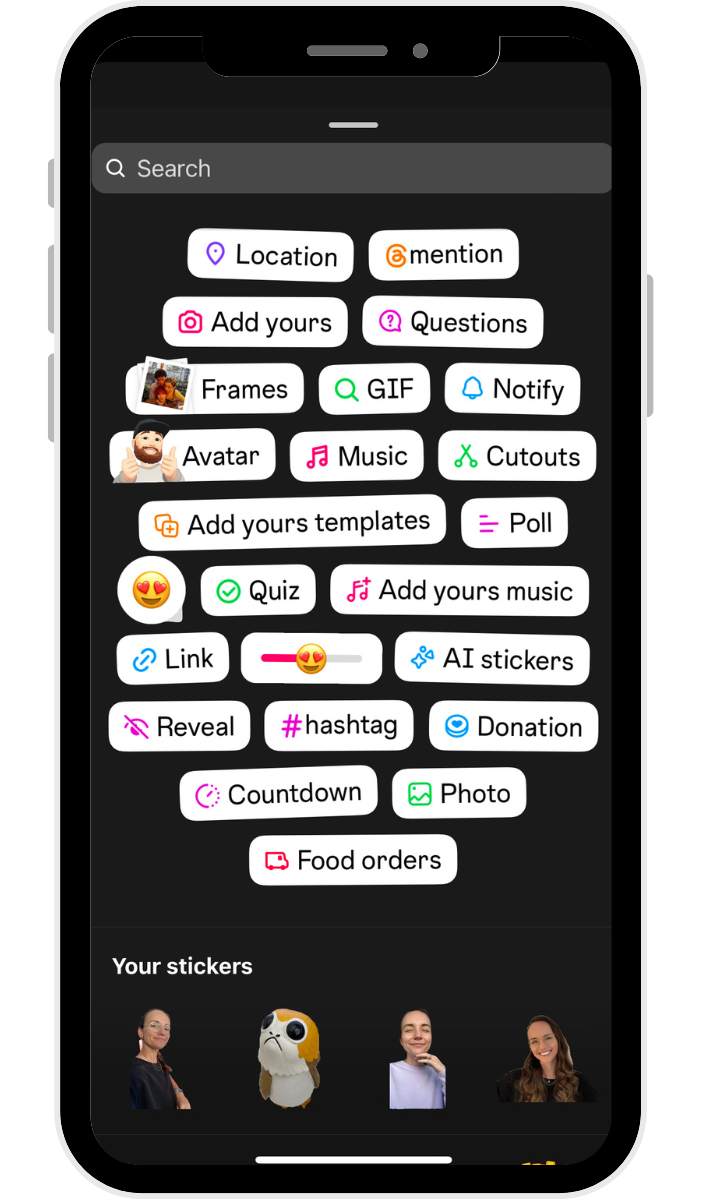
What are Instagram Story stickers?
Instagram Story stickers are creative elements you can place on your stories to make them more engaging and interactive.
You can add more than one sticker to a story. To add stickers, take or upload a photo or video, and then tap the stickers button (a smiley face on the top of the screen) to find customizable stickers for the weather, the current time, location, and more.
You can move stickers by dragging them across your screen and resizing them by pinching or expanding them with two fingers.
Here are some of my favorites.
1. Add Yours sticker
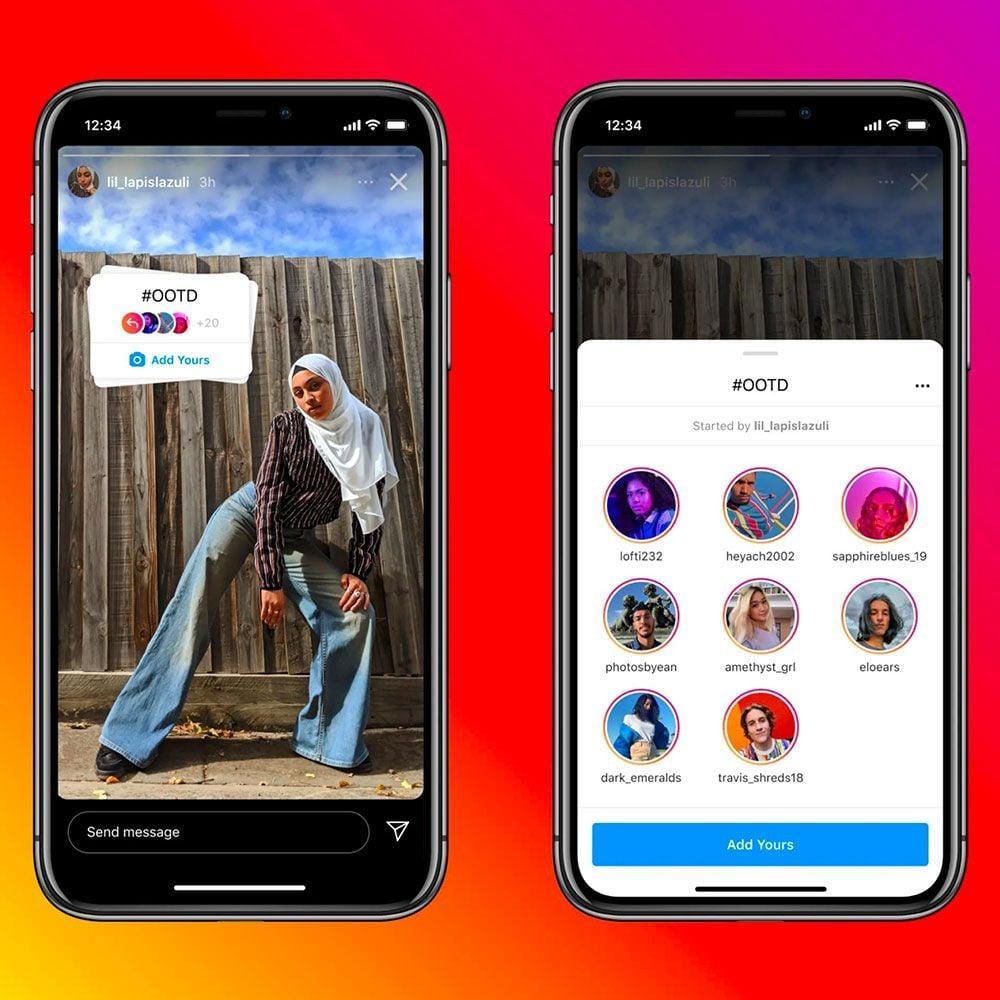
Instagram's Add Yours sticker lets creators start public threads to connect content with a similar theme. When more users add their stories to the sticker, it creates a content chain that brings different users — including those who don’t follow you — into the conversation.
Try it: Create an Add Yours prompt related to your niche — like "Show us your desk setup" or "Your go-to morning drink" — to encourage followers (and their followers) to participate and spread your content organically.
2. Captions sticker
You can add automated subtitles or transcripts to your stories by simply adding this sticker.
Keep in mind that this feature isn't available everywhere yet — it's currently rolling out in select languages and locations.

3. Shopping sticker
If you have Instagram Shopping set up for your business account, you can use the shopping sticker to add clickable product icons to your story.
4. Donation sticker
The donation sticker is an interactive sticker Instagrammers use to encourage donations to a specific cause. People who tap the sticker can donate within Instagram to the linked cause.
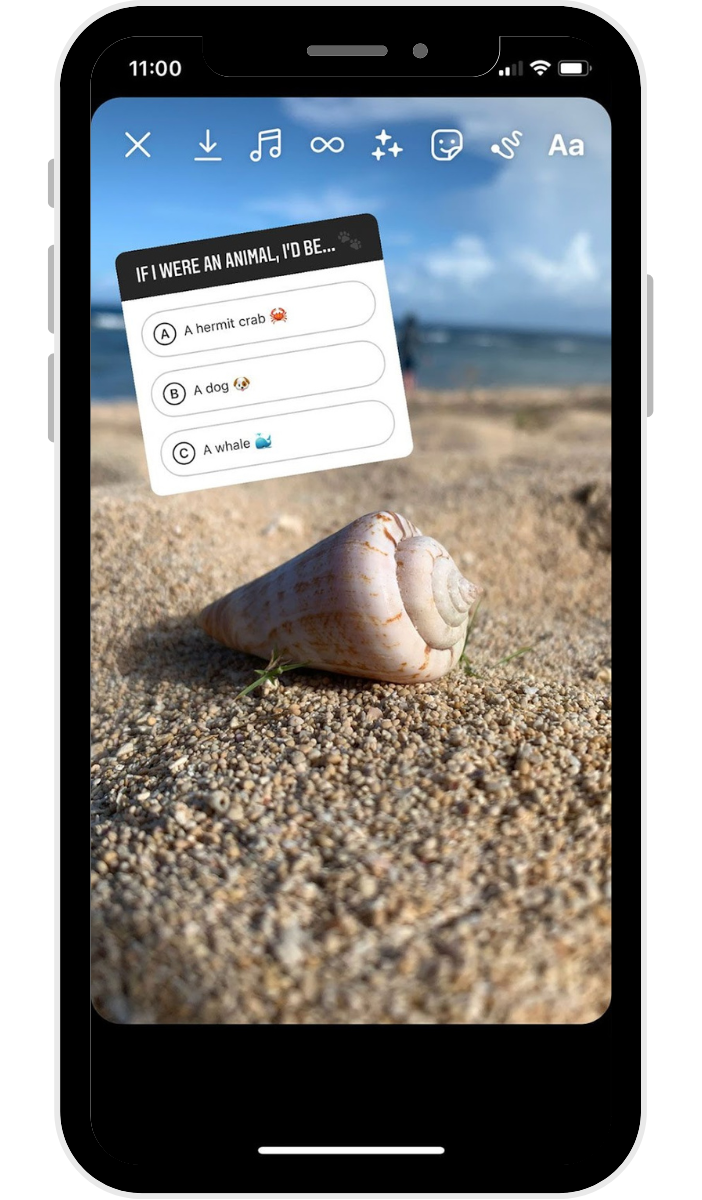
5. Quiz sticker
The quiz sticker lets you add an interactive, multiple-choice-type question to your stories so you can ask your followers fun questions and see which ones get the right answer.
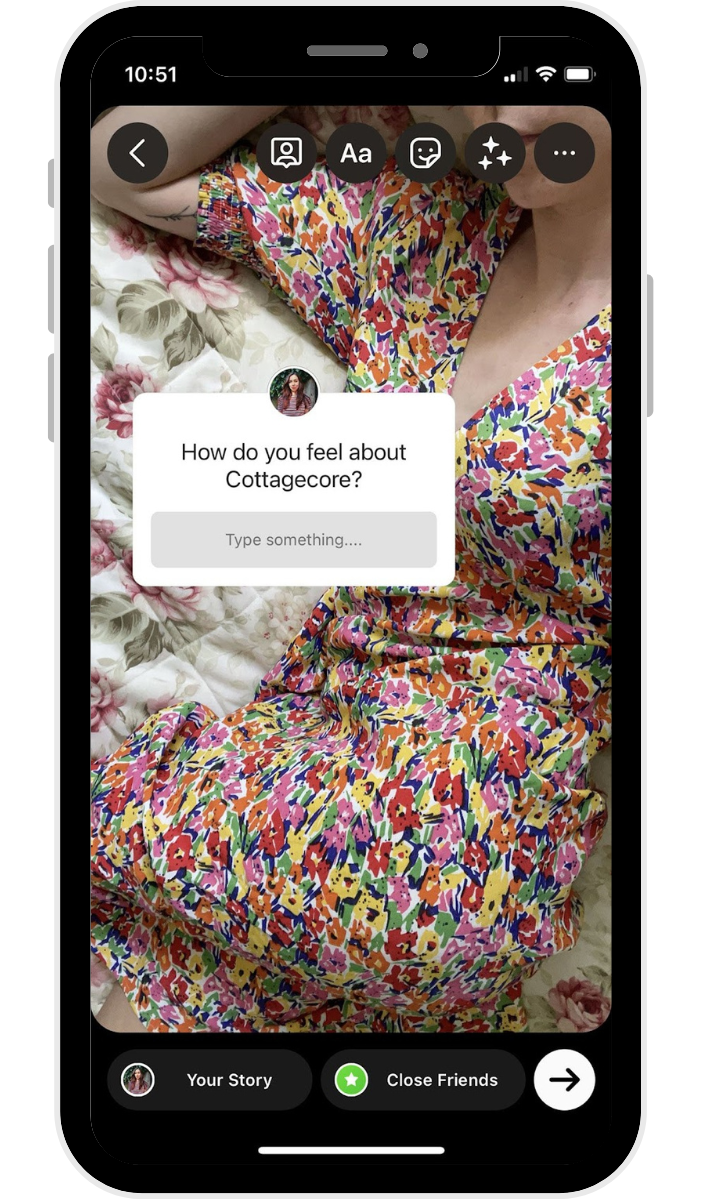
6. Question sticker
You can use the question sticker to ask your followers a question. It can help you gather some insights into what your followers or customers love, what they're interested in, what they'd like to see, and more.
You can also flip it — use the question sticker to let your followers ask you a question, and create new stories where you answer them.
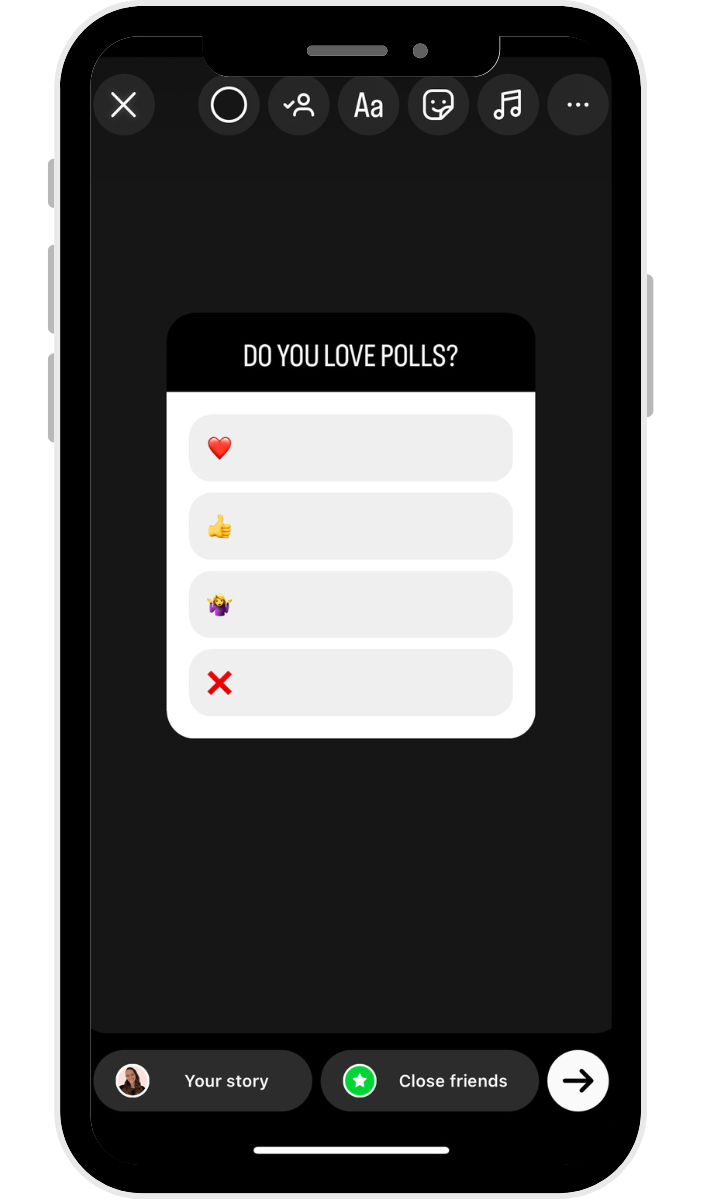
7. Poll sticker
The poll sticker allows you to ask your followers a question, giving them four poll options to choose from. All the sections are fully customizable, and you can easily share the results to your story, too.
Try it: Use polls to involve your audience in real decisions — like "Which packaging do you prefer?" or "What topic should I cover next?" It's a low-effort way to boost interaction and gather useful feedback at the same time.
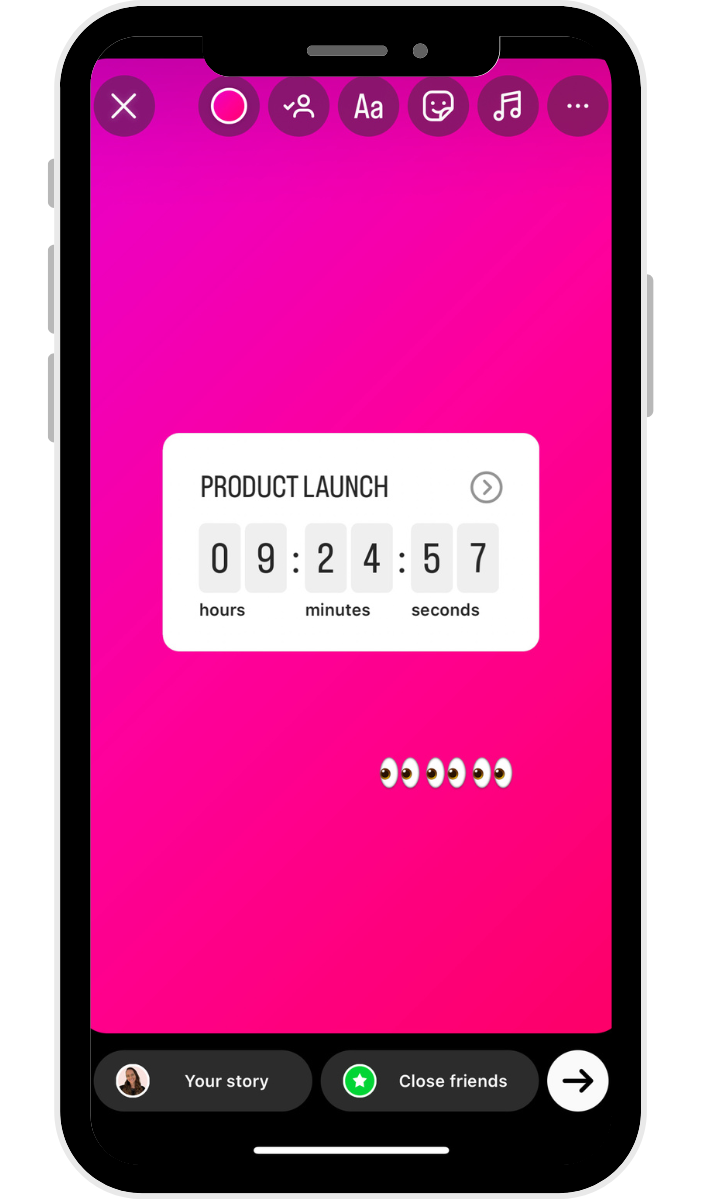
8. Countdown sticker
If you want to build anticipation around a product launch or event, include the countdown sticker so they can quickly tap to get a reminder for the date.
Some other fun stickers you can use are:
- Location sticker: Tag the location of your story
- Music sticker: Add a song as a soundtrack for your story
- Hashtag sticker: Tap into a trending Instagram hashtag or create your own
- Time and/or weather sticker: Personalize your content
- GIF sticker: Adds a fun, interactive element
- Mention sticker: Tag other Instagram accounts
The Instagram Story link sticker
The link sticker technically belongs in the sticker category above, but I’m giving it its own shoutout because of just how useful this one is. The link sticker allows you to place strategic links anywhere on your story.
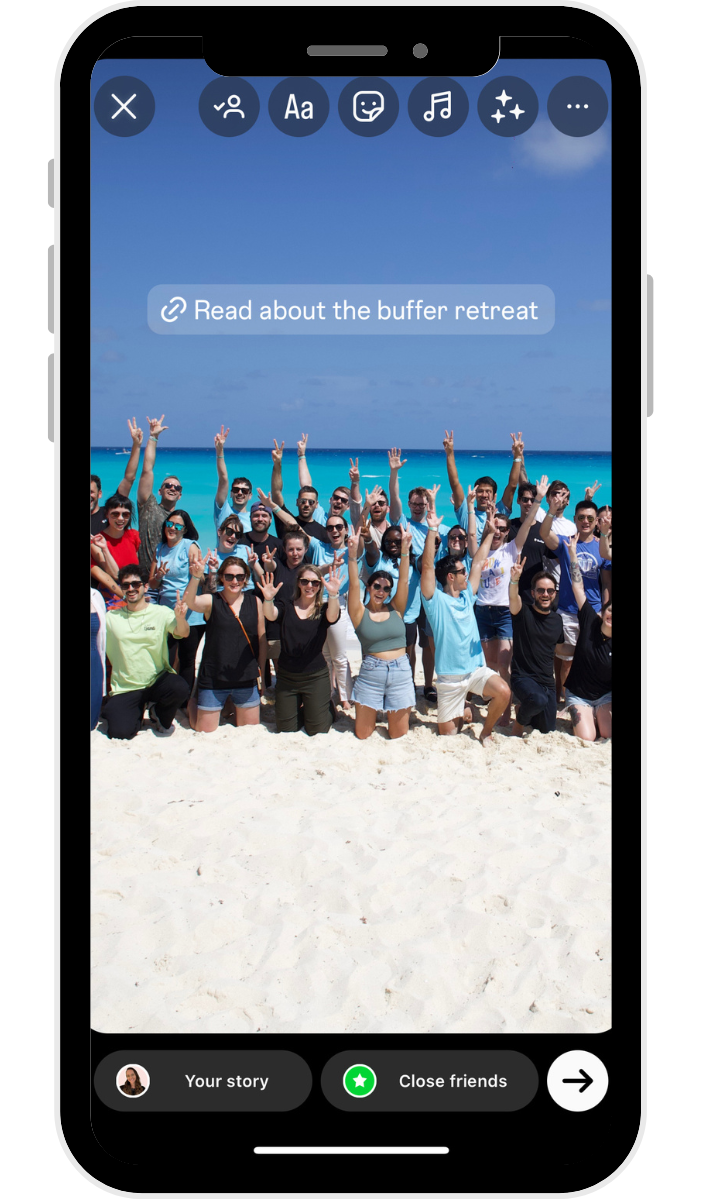
Here are some ways you can use the link sticker:
- Send people to a product page during a launch or restock
- Link to a new blog post or newsletter signup form
- Share your latest YouTube video or lead magnet like a free download
- Direct followers to a booking calendar or inquiry form
- Highlight a press feature or media mention
How to add a link to your Instagram Story
- Go to your Instagram Stories sticker tray and tap the sticker that reads Link.
- Paste your link into the link field.
- If you have a long or unwieldy URL, tap the “Customize sticker text” button to type in any text you'd like and tap Done.
- You can change the color of your sticker by tapping on it, pinch to resize, and drag it to where you'd like it to appear on the story.
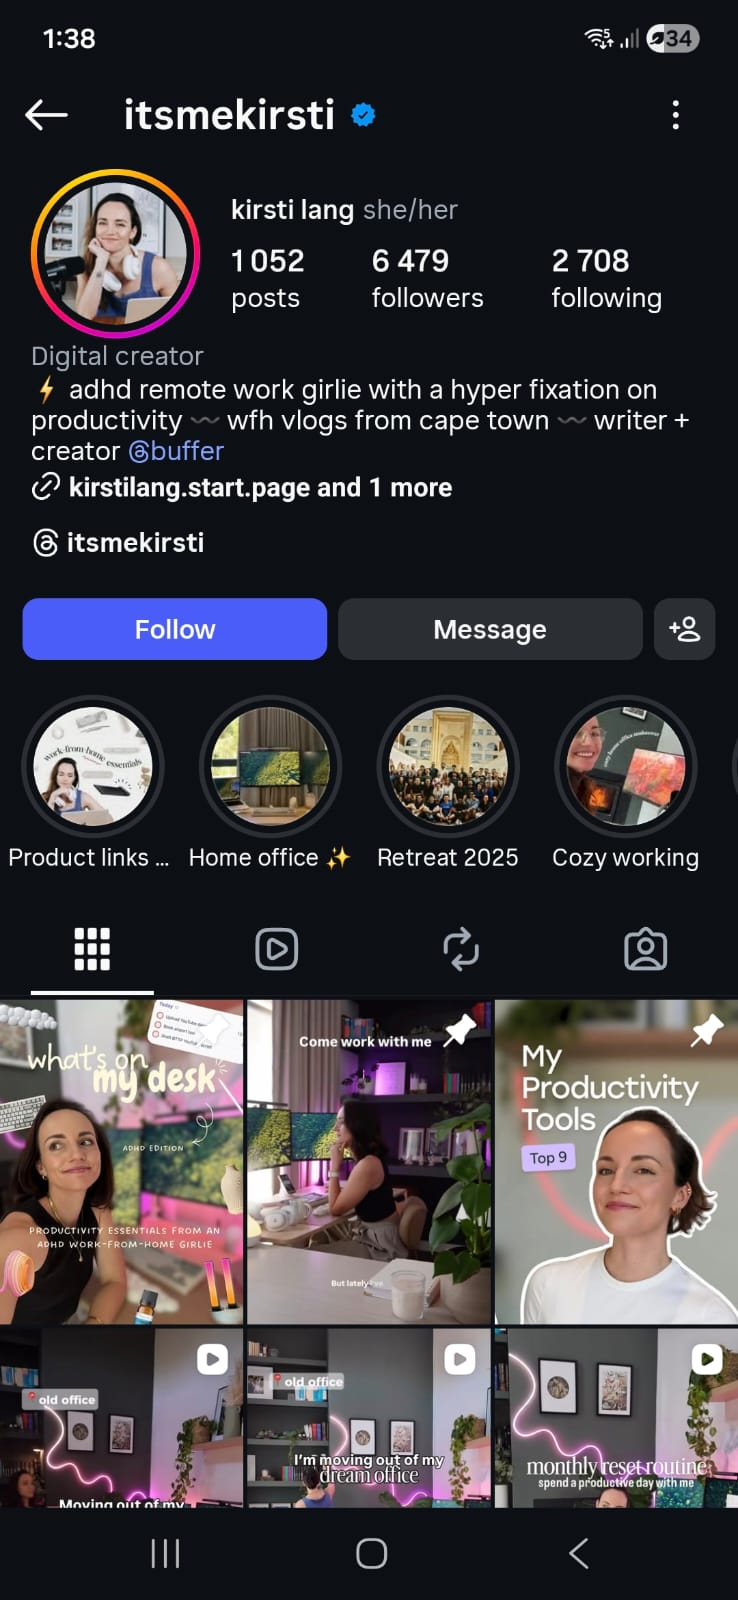
What are Instagram Story highlights?
Instagram Story highlights are collections of Instagram Stories that you curate to stay on your profile even after they expire. They're located at the top of your profile in the form of tappable circles.
Think of highlights as a way to extend the life of your best story content. Instead of disappearing after 24 hours, your most useful or popular stories live on your profile permanently — right above your regular feed.
A few ideas for organizing your highlights:
- FAQs — Answer common questions so new visitors can get up to speed fast
- Reviews or testimonials — Social proof that sticks around
- Product or service categories — Make it easy for potential customers to browse what you offer
- Behind the scenes — Give people a reason to feel connected to your brand
How to create a highlight:
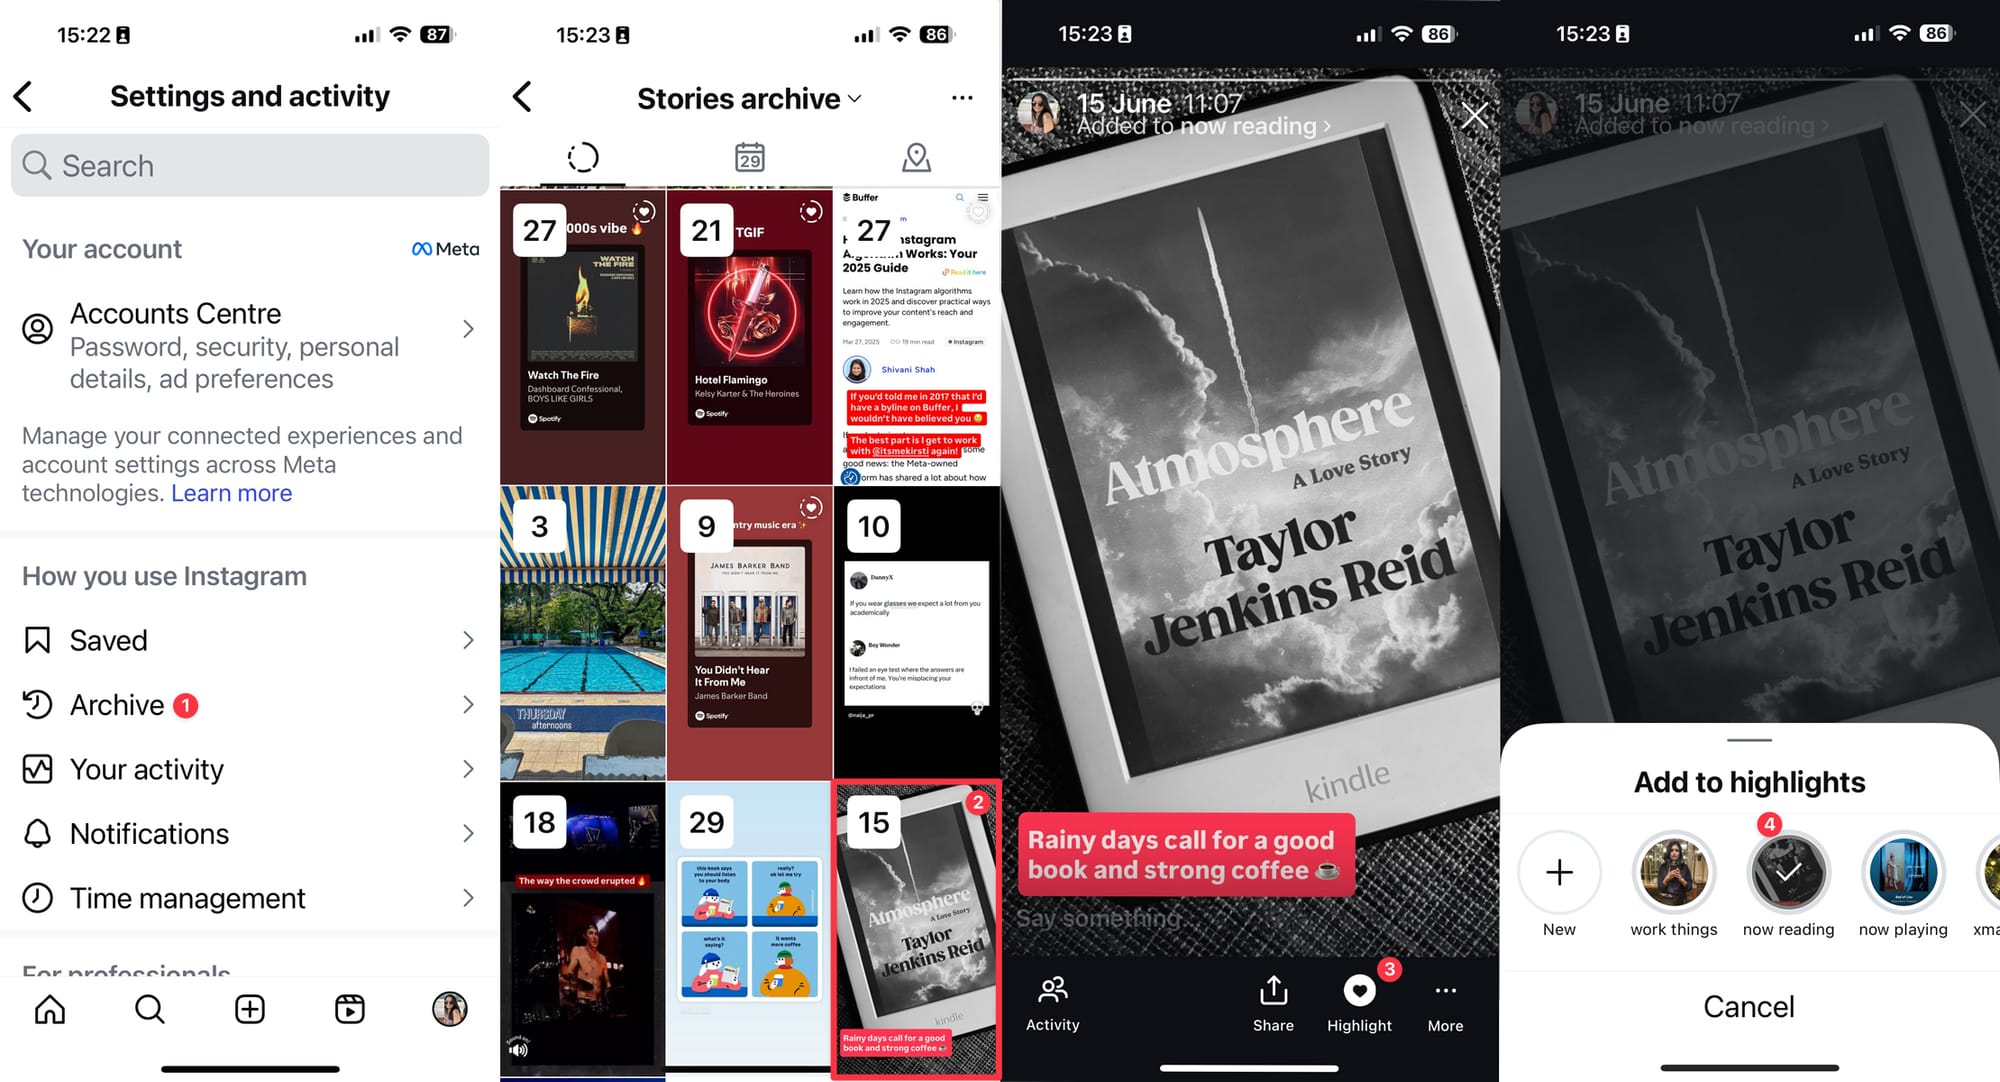
- Open a current story and tap the Highlight icon at the bottom of the screen, or go to your profile and tap the + button under your bio.
- Select the stories you want to include from your archive.
- Name your highlight and choose a cover image.
Once you're done, your Instagram Stories highlight will appear as a bubble on your profile. You can have as many highlights as you like, and they will stay on your profile until you remove them. To edit or remove a highlight, just tap and hold that highlight on your profile.
You can add stories to highlights at any time. Go to Archive in your app settings, open the story, and tap the Highlight button at the bottom of the screen. Choose the highlights you want to add to (you can choose more than one), and you’re done.
Instagram Story analytics
Tracking how your stories perform helps you figure out what resonates and what to do more of. If you have an Instagram creator or business account, you can access analytics in the app.
To check analytics for a specific story, tap the story, then the Activity icon in the lower-left corner of your screen.
⚡ Pro tip: If you want to track story performance over time, a tool like Buffer can help you monitor trends and compare results across your content.
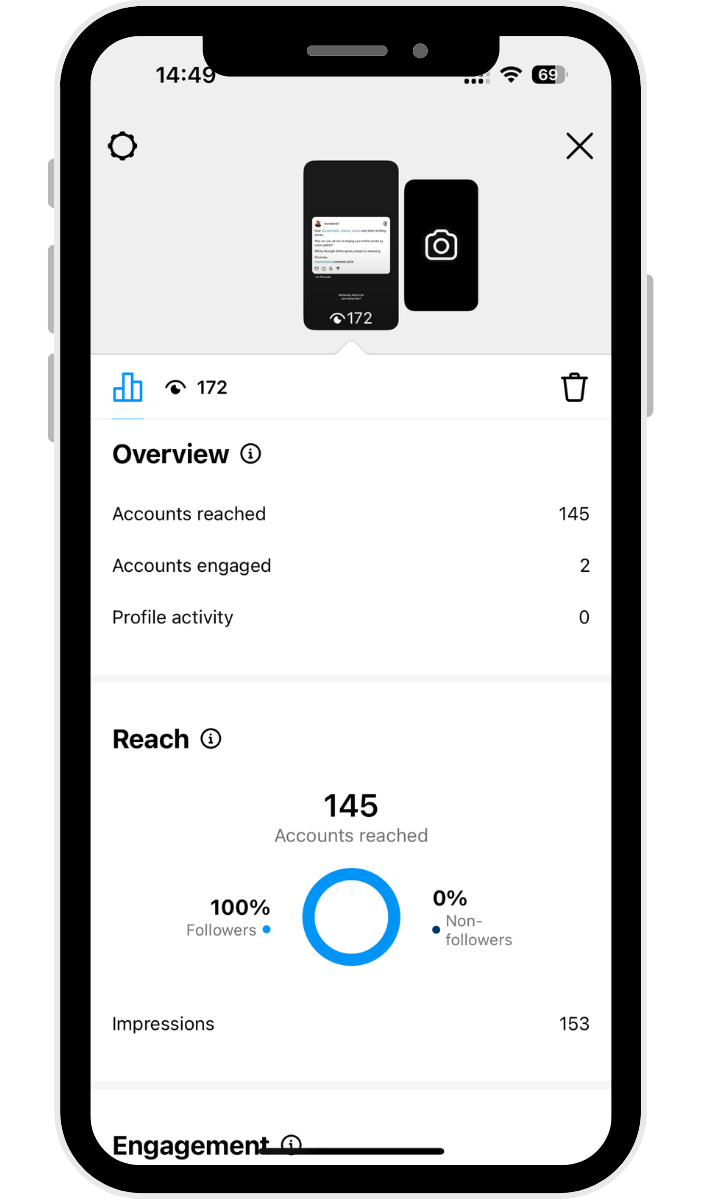
From your analytics, you will see:
- How many followers and non-followers your story has reached
- How people interacted with your story (tap for the next story, finish the story, go back, exit)
- How many Instagram Story views you received
- How many people followed you after viewing that story
Check story analytics from Instagram Insights
You'll be able to access all this data and more via Instagram Insights, where all the metrics for your Instagram posts — stories, carousels, reels, and more. Yes, you'll even find stats for Instagram Stories that have already expired.
To get to your insights:
- Tap the Professional dashboard button beneath your bio.
- For metrics specific to your Instagram Stories, tap on Content you shared.
- Tap the All button on the top left, then tap Stories.
- Your stories will automatically be arranged by reach, from highest to lowest. Tap on a specific story to get more data, such as reach, likes, replies, shares, and more.
Building an Instagram Story strategy that works
The Instagram Stories algorithm decides where you appear in each follower's stories tray — and it's based on a few key signals. How often someone views or interacts with your stories, whether they DM you, and how recently you posted all play a role.
Stories appear at the top of the feed, giving you prime visibility. And the more consistently you show up with content people engage with, the higher you'll rank in their tray.
Here are five ways to make that work in your favor.
1. Post Instagram Stories daily
Our Instagram Stories research suggests that posting between one and seven Instagram Stories per day will yield the best results. Over 70% of accounts that posted within this range had a high stories completion rate.
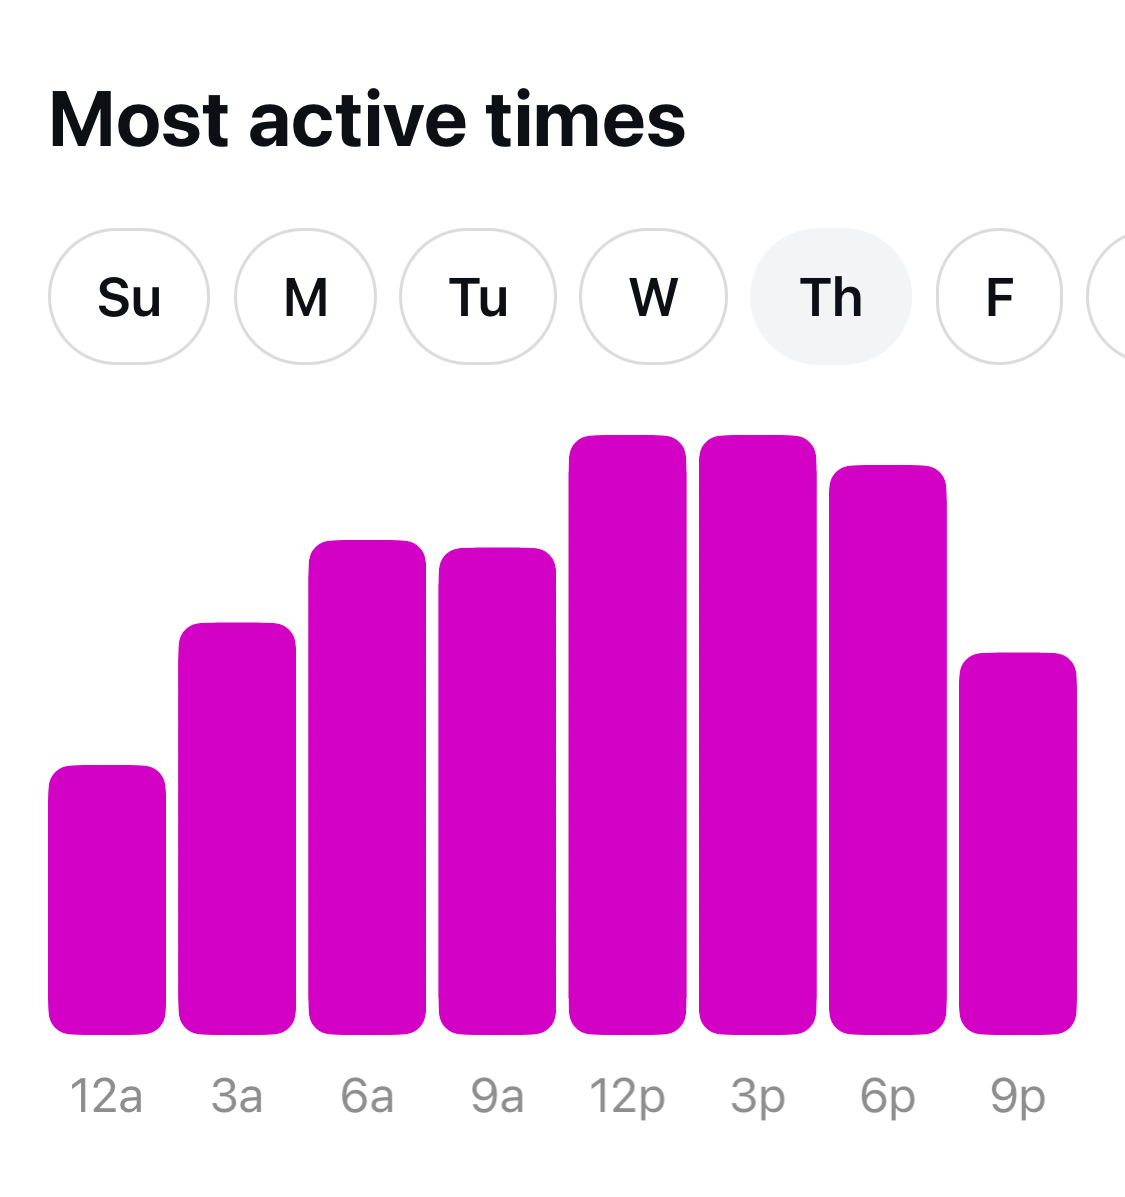
2. Post stories consistently and at optimal times
Showing up regularly is what keeps you visible and at the top of your followers' trays. Given that stories only last for 24 hours, you want to maximize their reach by posting when your followers are most active.
You can check when your audience is online through Instagram's native insights (under New Followers > Most Active Times).
If you're managing multiple accounts or want to plan your story schedule alongside your other content, a scheduling tool like Buffer lets you queue up stories in advance so you never miss your window.
3. Take advantage of creative features and tools
As you'll have seen above, Instagram has plenty of fun features to help you get creative with. You can create your stories right on the Instagram app or use other tools to create and prep them ahead of time.
Worth knowing: Instagram's algorithm can limit the reach of stories that have visible watermarks from other apps (like TikTok). Posting natively or using a clean version of your video is an easy fix that keeps your reach intact.
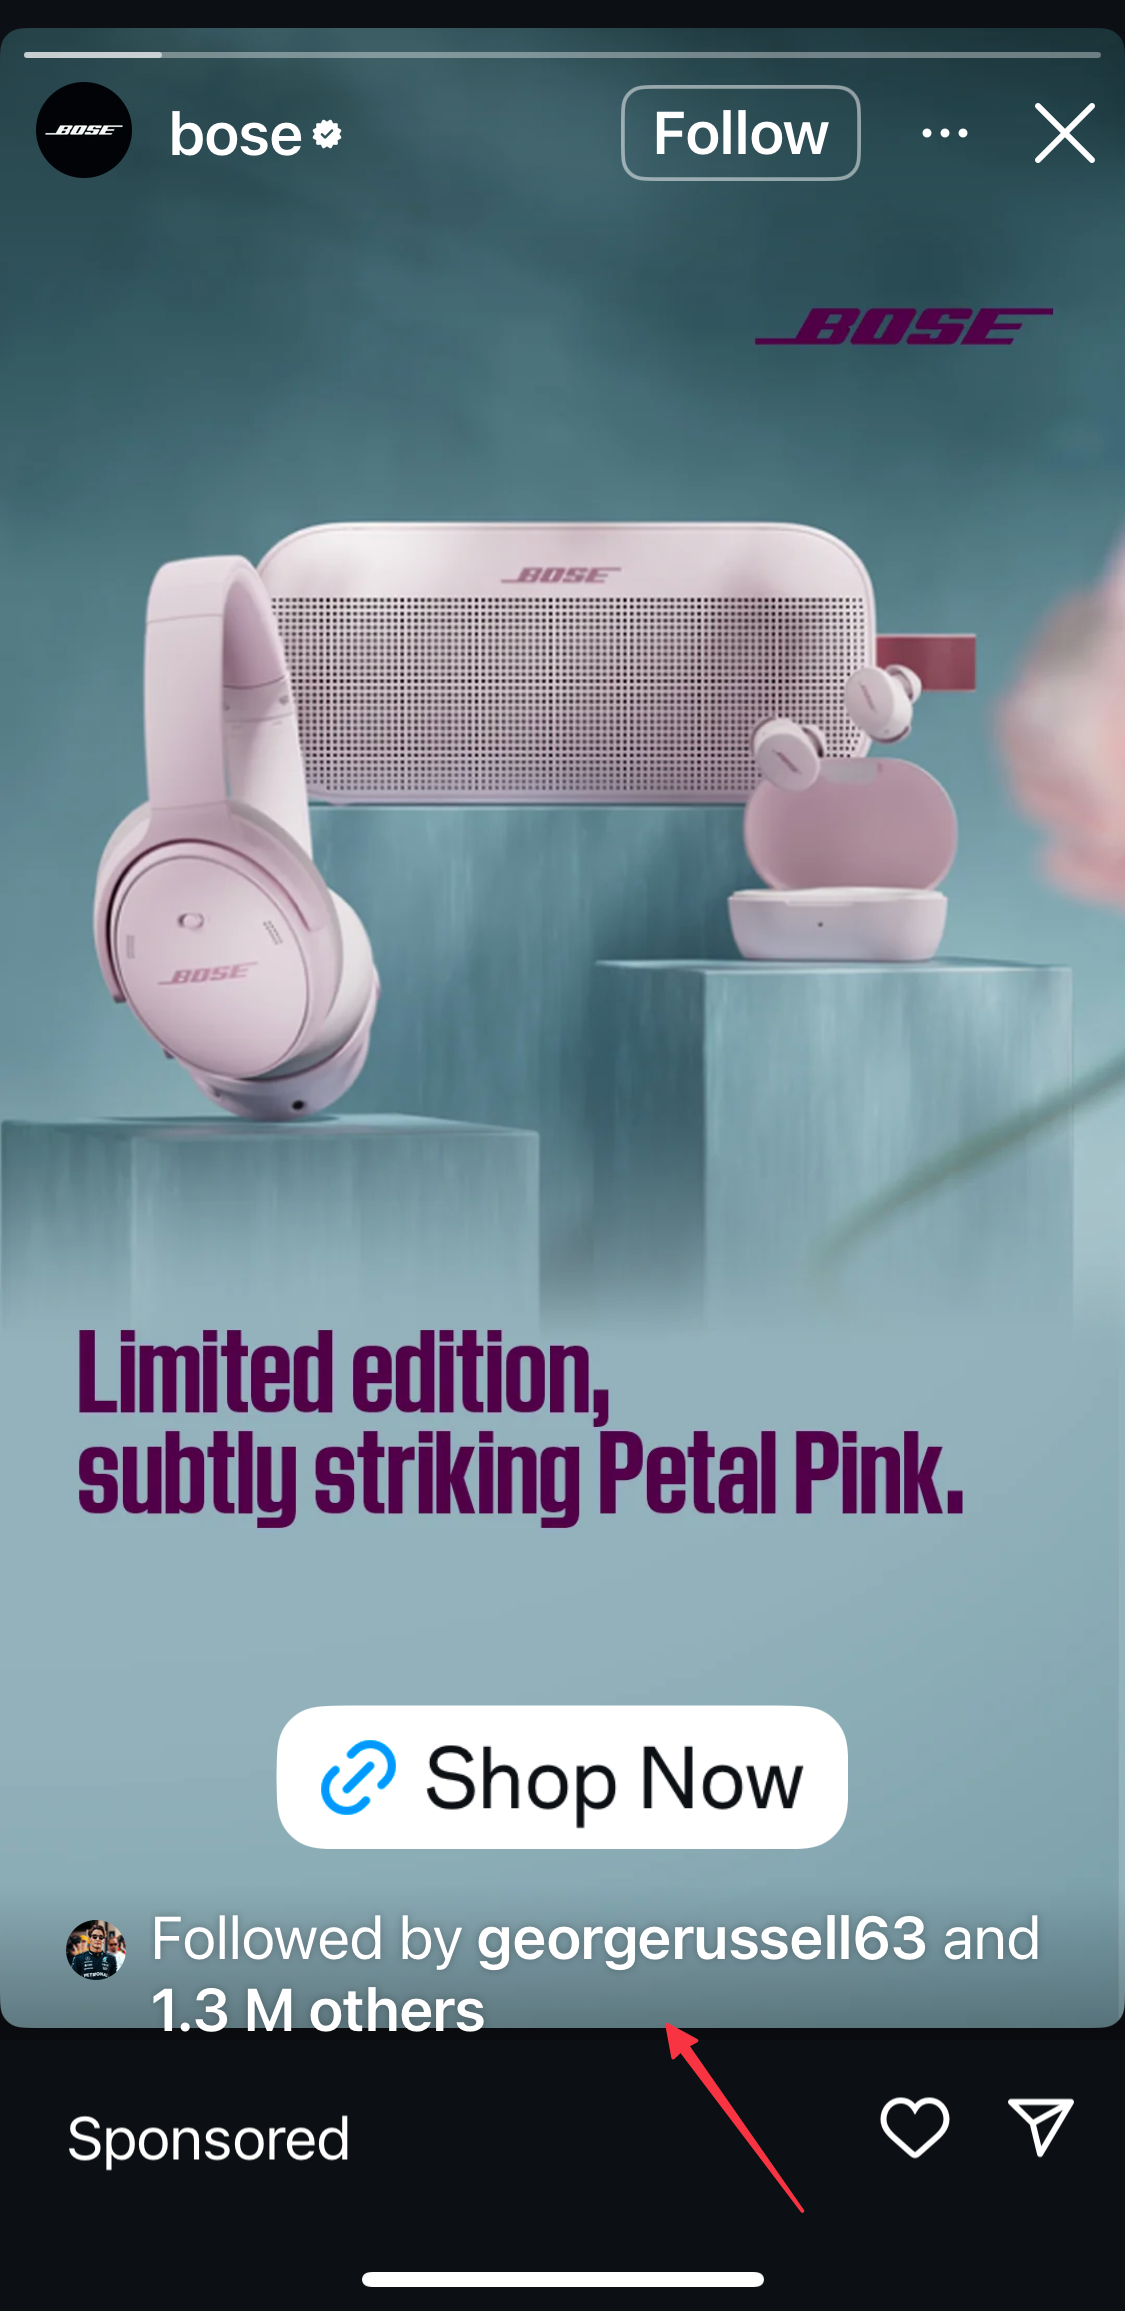
4. Use Instagram Story ads to boost reach, engagement, and conversions
Stories created for ad placements help small business owners reach a targeted audience. Because they take up the whole screen, your audience won’t see content from other brands — just your ad.
To save you time on content creation, make use of existing stories saved in your highlights. If you have an Instagram shop, you can use product links so users can purchase your products directly through the ad.
5. Use Instagram Story templates to make your story pop
There are perks to tapping into templates to create visually appealing Instagram Stories. For one thing, you can batch create them (making it oh-so-much easier to schedule your stories in advance).
It's also a great way to maintain brand consistency that you can even carry across your Instagram Reels and carousel posts.
Take your Instagram Stories to the next level with Buffer
Stories have become an incredibly important part of brand awareness and should absolutely be included in your Instagram marketing strategy.
With Buffer, you can plan, preview, and schedule your Instagram Stories ahead of time, so you have everything ready to post with a single push notification. Get started for free now →
FAQ about Instagram Stories
What’s the difference between an Instagram Story and a regular post?
The big difference is lifespan and intent. Stories disappear after 24 hours, sit at the top of the app, and are great for quick, interactive moments with your existing followers. Feed posts stick around permanently, can appear in Explore, and are better for reaching new audiences over time. Think of stories as the conversation, and your feed as the portfolio.
How long do Instagram Stories last?
Each story stays visible for 24 hours after posting. After that, it moves to your story archive (if you have archiving enabled), where you can revisit it or add it to a highlight at any time.
How many Instagram Stories can you post in a day?
There's no official daily limit. You can post as many stories as you'd like, though our research suggests that one to seven stories per day tends to hit the sweet spot for completion rates. After that, viewers are more likely to tap through or drop off.
How do I find someone's Instagram story?
Stories appear at the top of your home screen in the stories tray. Look for a profile picture with a colorful ring around it — that means they have an active story. Tap the ring to watch it.
If you don't see them in the tray, go to their profile directly and tap their profile photo. If the ring is there, their story is still live.
How do I see who viewed my Instagram Story?
Tap your story to open it, then tap the Activity icon in the lower-left corner. You'll see a list of everyone who watched. Instagram keeps viewer data available for 48 hours after the story expires.
Can people see if I view their Instagram Story?
Yes. When you watch a story, Instagram adds your username to the viewer list that only the story owner can see. They won’t know how many times you viewed it — just that you did.
However, Instagram is reportedly testing a feature that would let premium users view stories without showing up on the viewer list.
Can someone see if I screenshot their Instagram Story?
No. Instagram does not notify users when someone takes a screenshot of their story. The one exception is vanish-mode DMs — but for regular stories, screenshots are completely private.
More Instagram resources
- How to Reset Your Instagram Algorithm When Your Feed Needs a Fresh Start
- 13 Trending Sounds on Instagram (+ How to Use Them)
- 13 Ways to Get More Followers on Instagram (Tried & Tested)
- How the Instagram Algorithm Works
- Instagram Image Size Guide: Post, Story, and Reels Dimensions
- 26 Free Instagram Tools to Help Grow Your Account
Try Buffer for free
200,000+ creators, small businesses, and marketers use Buffer to grow their audiences every month.