We are grateful for people who share what worked (and what didn’t) for them on social media. And we’ve learned a lot from their experiences.
With 2017 coming to an end, I thought it might be helpful to do a review of our social media performance and share the findings with you.
In this post, you’ll find our top five posts of the year of each of our social media profiles and what we’ve learned from them. Plus, you’ll also learn about our top 100 most shared blog posts of 2017. I hope you’ll find this information helpful!
Our top social media posts of the year
We think social media is becoming more for engagement and brand building than referral traffic and revenue. So a top social media post to us is one that generates the most reach and engagement.
These social media posts are ordered according to their reach rather than engagement as it’s easier to get that data. Having said that, we found that the higher the reach, the more engagement a post likely gets.
Let’s jump right in!
Top 5 Facebook posts
Our Facebook Page Likes grew from 79,152 to 105,835 so far this year. Here are our top five Facebook posts:
- 803,196 people reached
- 9,100 reactions
- 2,294 shares
- 756 comments
- 732,863 people reached
- 4,300 reactions
- 1,928 shares
- 355 comments
- 364,000 video views
- 492,821 people reached
- 2,900 reactions
- 778 shares
- 479 comments
- 190,000 video views
- 468,920 people reached
- 7,400 reactions
- 2,339 shares
- 1,000 comments
- 334,516 people reached
- 644 reactions
- 128 shares
- 183 comments
- 34,372 link clicks
Our learnings:
One key lesson, which will come up a few times in this blog post, is the power of social media for engagement rather than traffic or revenue. Four of the five top posts were meant for purely driving reach and engagement. And they performed incredibly well.
That isn’t to say social media cannot be used for driving traffic and revenue. One of the top posts drove a decent amount of traffic to our blog (with the help of Facebook advertising). But Facebook is becoming less effective as a referral source.
Parse.ly tracks the referral traffic to more than 2,500 online media sites and found that referral traffic from Facebook has been declining this year.
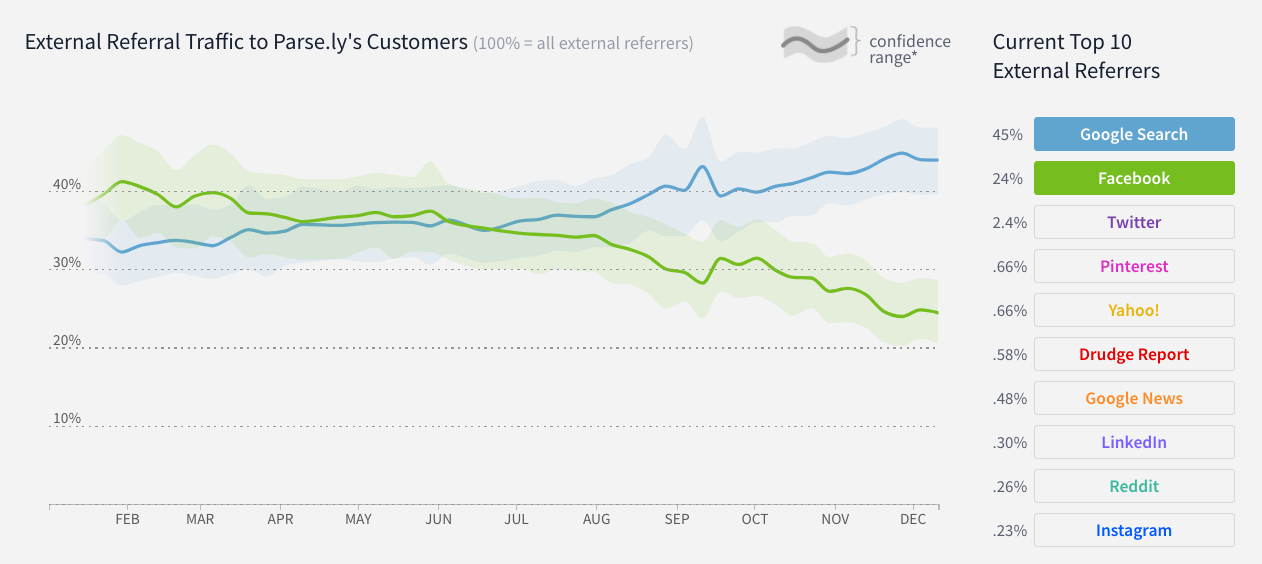
For us, Facebook brings in only about one percent of our blog traffic.
The second lesson is the effectiveness of curating popular, relevant posts. Our top four Facebook posts are all curated content. They are content that has proven to be popular on social media, and they also resonated with our target audience. They helped us reach many people who haven’t heard of us before and converted them into our Facebook Page fans.
The final lesson is that boosting Facebook posts that have performed well organically worked great for us. When those posts perform well organically, we know that our Facebook Page fans loved them. By putting a little advertising money behind them, we were able to show them to people who are similar to our existing fans and who will very likely engage with those posts.
Our top 5 tweets
We grew our Twitter following from 732,467 to 920,480 so far this year. Here are our top five tweets:
Exciting news to share! ? Introducing Tailored Posts by Buffer – Create perfect posts for every platform in one go! https://t.co/CWy5PmC8sn pic.twitter.com/CwraBrbU30
— Buffer (@buffer) May 18, 2017
- 175,752 impressions
- 357 likes
- 156 retweets
- 868 link clicks
—
Procaffeinating (n): the tendency to not start anything until you’ve had a coffee ☕️ #MondayMotivation at @WeWork pic.twitter.com/L5FVJx5MPd
— Buffer (@buffer) January 9, 2017
- 126,390 impressions
- 688 likes
- 495 retweets
—
It’s never too late to make it happen! 9 people who redefined themselves after 21 ✨ #MondayMotivation pic.twitter.com/ynBjFlM0IL
— Buffer (@buffer) July 31, 2017
- 123,904 impressions
- 552 likes
- 320 retweets
—
What the #SolarEclipse2017 would look like from space ? ? pic.twitter.com/lNgyRapLL3
— Buffer (@buffer) August 21, 2017
- 102,123 impressions
- 491 likes
- 244 retweets
—
Years to reach 50 million users:
✈️ 68
? 62
☎️ 50
? 46
? 22
? 14
? 12
? 12@YouTube 4@Facebook 3@Twitter 2
via @ValaAfshar pic.twitter.com/AreZKosBrK
— Buffer (@buffer) June 25, 2017
- 101,695 impressions
- 352 likes
- 296 retweets
Our learnings:
The power of engagement over traffic comes up again. Even though the best tweet was seen more than 175,000 times, it led to only 868 link clicks. That’s about 0.5 percent clickthrough rate. Hence, we have been experimenting with more on-site content, such as videos like this. This way, without having to leave Twitter, our followers are still able to get valuable information from us and engage with us.
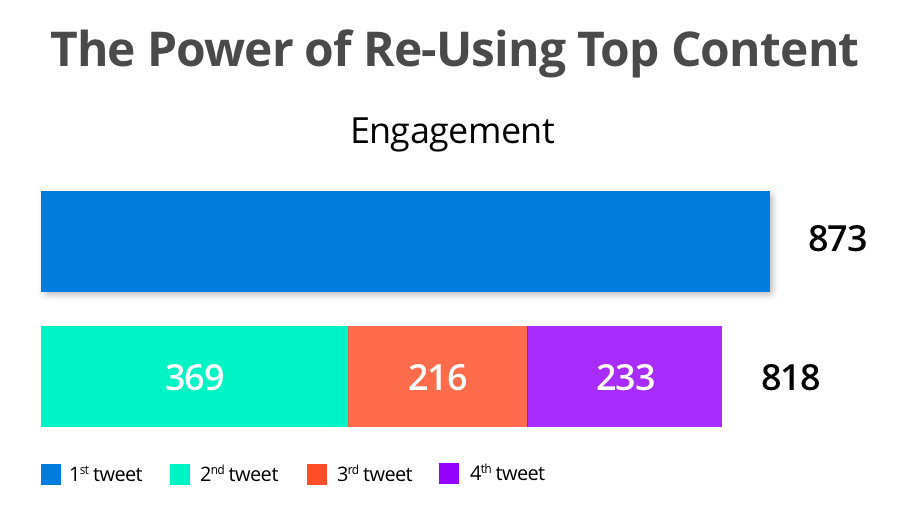
The second lesson is the power of re-using top content (occasionally). For example, we tweeted a video four times over four months. Here are the second, third, and fourth tweets. While the subsequent tweets had less engagement, we almost doubled the amount of engagement.
One last thing I noticed is the percentage of organic reach. With around 900,000 Twitter followers, our best posts only reached about 10 percent of our followers. With Twitter’s recent introduction of new ad formats, will it become a pay-to-play channel, like Facebook? Will you pay to play?
Top 5 Instagram posts
Our Instagram following grew from 19,600 to 33,200 so far this year. Here are our top five Instagram posts (sorted by engagement level):
- 1,697 engagement
- 1,630 likes
- 19 comments
- 47 saved
- 7,848 reach
- 1,605 engagement
- 1,532 likes
- 48 comments
- 25 saved
- 9,790 reach
- 1,202 engagement
- 1,097 likes
- 75 comments
- 30 saved
- 7,608 reach
- 1,189 engagement
- 1,132 likes
- 22 comments
- 35 saved
- 8,640 reach
- 1,173 engagement
- 1,149 likes
- 16 comments
- 8 saved
- 5,327 reach
Our learnings:
Being a fully-distributed company that sells a software, we don’t have a product or an office to take photos of. We had to be creative with our Instagram marketing strategy. So we adopted a user-generated content strategy, and it worked brilliantly. When we started this strategy in mid-2016, we only had about 4,000 followers. Now, we have over 30,000 engaged followers who would like or comment on our posts and watch our Instagram Stories.
The second lesson is the (very) high organic reach percentage on Instagram. Our best post has an organic reach of about 26 percent – unmatched by other social media platforms. That said, in terms of absolute value, the organic reach is much lower than other platforms for us as we started growing our Instagram following much later than our Twitter and Facebook following.
The final lesson is the importance of photo quality on Instagram. Instagram is a highly curated platform. Facebook found that Instagram users prefer beautiful visual content and often post such high-quality content themselves
5. To engage our audience on Instagram, we post similarly high-quality content.
Top 5 LinkedIn posts
Our LinkedIn Company Page following grew from 12,771 to 16,343 so far this year. Here are our top five LinkedIn posts:
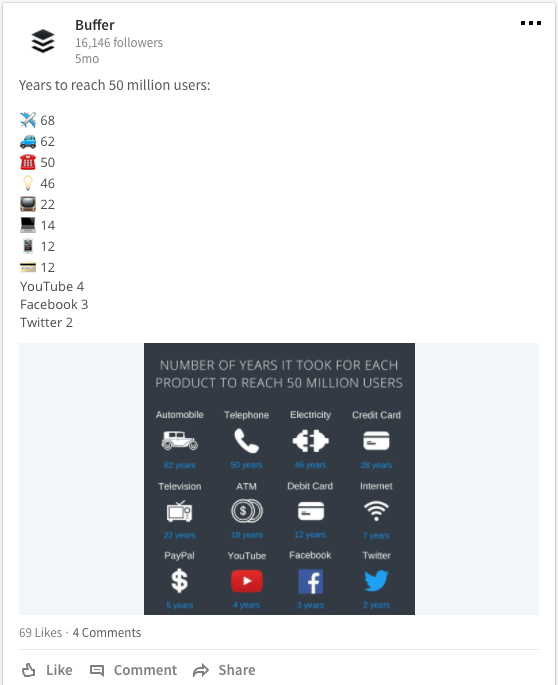
- 56,869 impressions
- 130 social actions (likes, comments, and shares)
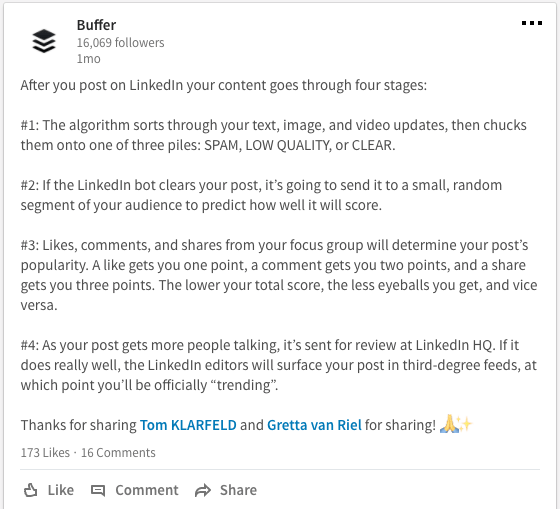
- 54,961 impressions
- 219 social actions

- 20,520 impressions
- 41 social actions
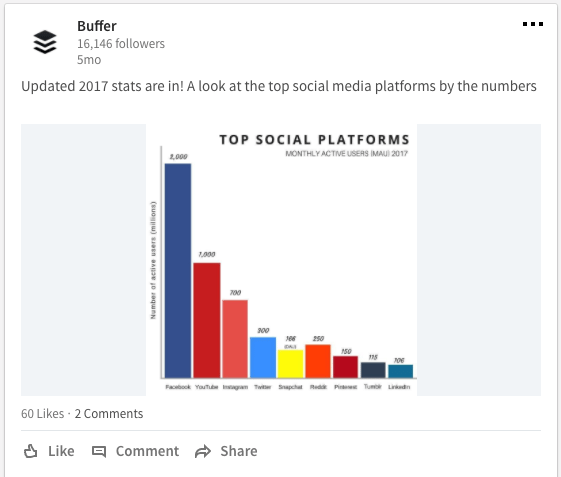
- 16,784 impressions
- 88 social actions
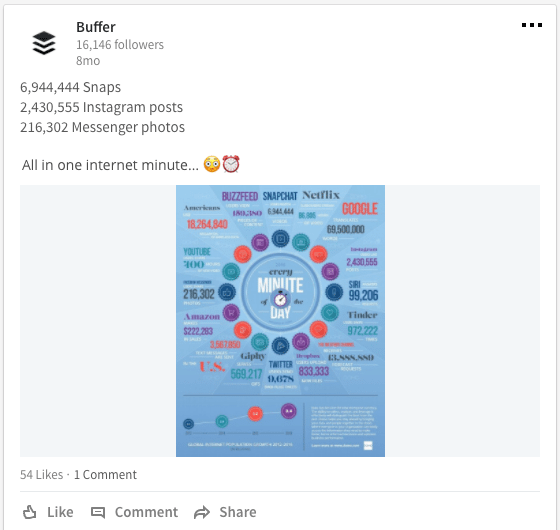
- 15,196 impressions
- 77 social actions
Our learnings:
One thing that stood out to me is that our LinkedIn followers love data and statistics. And I think that makes sense. LinkedIn is a more professional social network than Facebook, Twitter, and Instagram, and people are there for informative, educational content.
That might also be why our post on LinkedIn algorithm resonated with our followers.
Something else I noticed while going through our analytics is the high impression rate. For our 10 most recent LinkedIn posts, the average number of impressions (around 6,500) is about 40 percent of our total followers (around 16,000), without any advertising money. Since someone can see a post more than once, the number of unique followers reached is likely less than 40 percent but perhaps not too far off.
This is great news if you want to boost your brand awareness through LinkedIn.
Finally, we also noticed that LinkedIn has quietly grown their member base to 500 million, and we feel that LinkedIn will become an even more promising marketing channel going forward.

100 most shared blog posts
Apart from top social media posts, let’s also take a look at our most shared blog posts — blog posts that performed best on social media. Using Buzzsumo, I was able to easily find our most shared blog posts in the past year.
Here are the top five (with the remaining in a spreadsheet):
1. Why I Think Social Media Is For Branding and Engagement, Not Traffic or Revenue
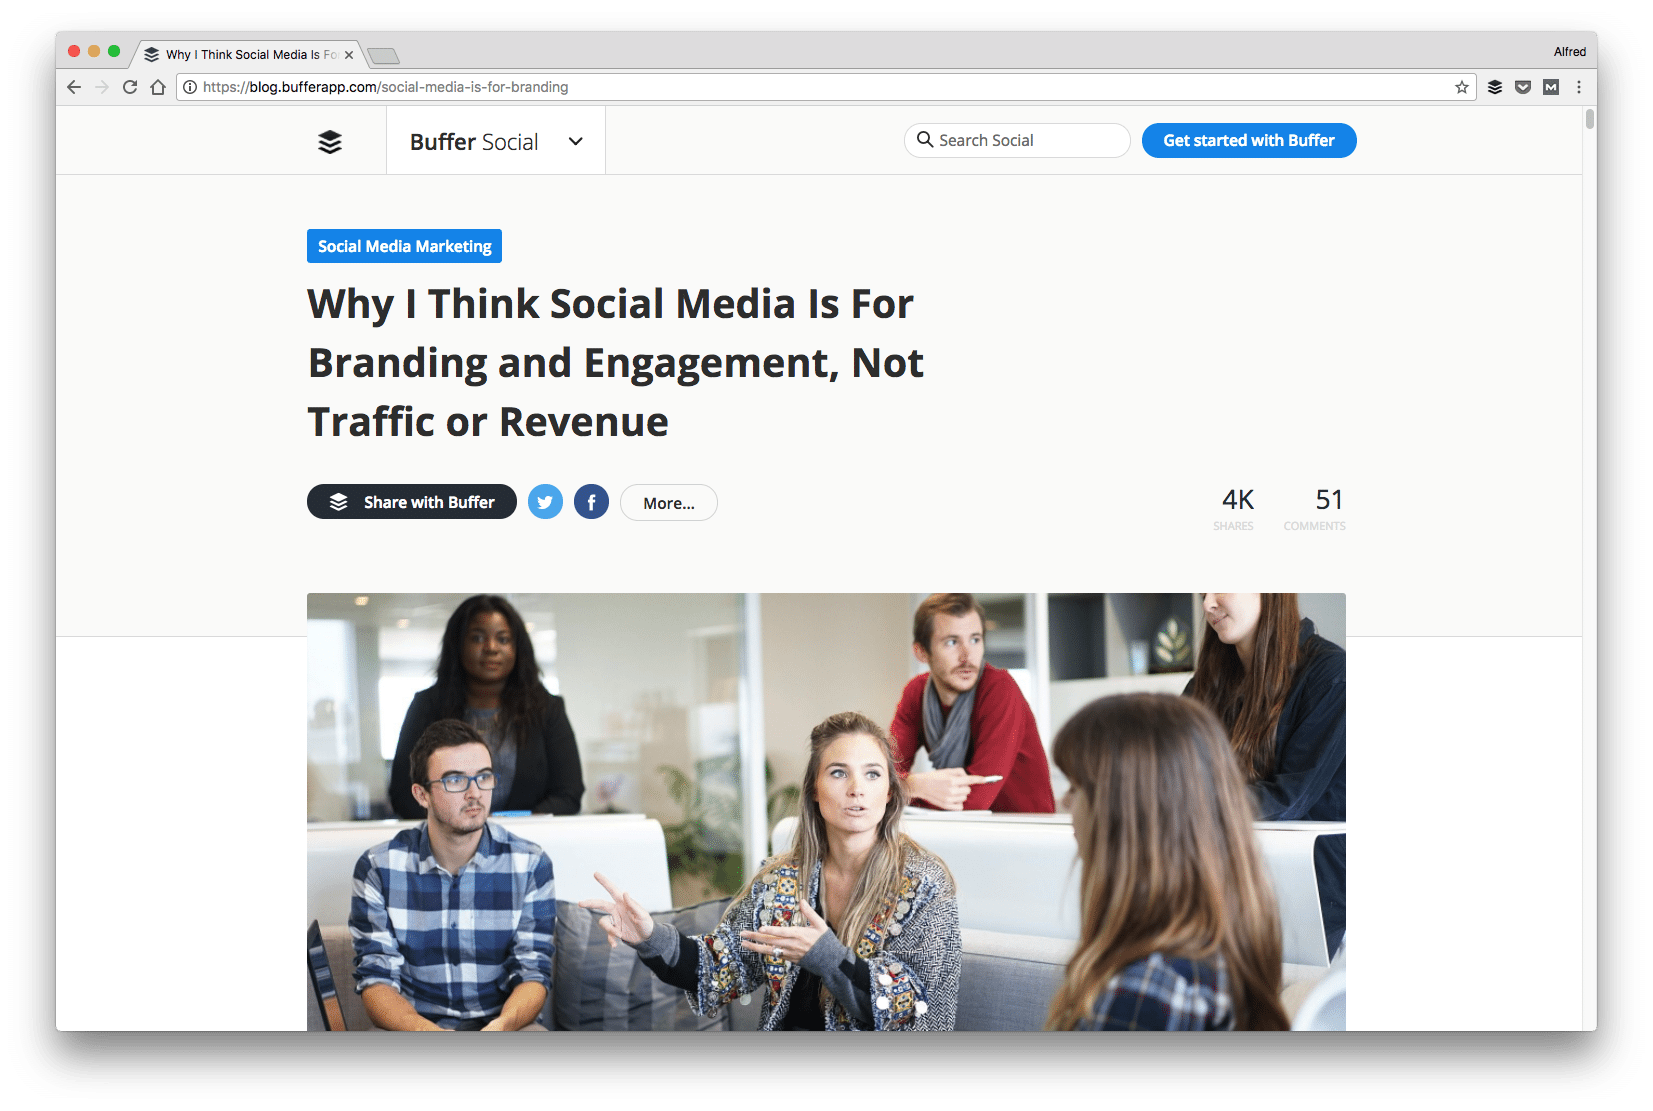
- 6,291 shares
- 1,884 Facebook engagements*
- 2,022 LinkedIn shares
- 2,286 Twitter shares
- 99 Pinterest shares
*Instead of shares alone, Buzzsumo also includes Likes and comments for Facebook.
2. 20 Creative Ways to Use Social Media for Storytelling
- 5,386 shares
- 1,802 Facebook engagements
- 1,113 LinkedIn shares
- 2,369 Twitter shares
- 102 Pinterest shares
3. The Simple Facebook Posting Strategy That Helped us 3x Our Reach and Engagement
- 5,072 shares
- 2,055 Facebook engagements
- 1,225 LinkedIn shares
- 1,729 Twitter shares
- 63 Pinterest shares
4. 11 Storytelling Formulas to Supercharge Your Social Media Marketing
- 5, 052 shares
- 1,346 Facebook engagements
- 1,560 LinkedIn shares
- 2,049 Twitter shares
- 97 Pinterest shares
5. Why There’s No Perfect Time to Post on Facebook
- 4,763 shares
- 2,733 Facebook engagements
- 999 LinkedIn shares
- 983 Twitter shares
- 48 Pinterest shares
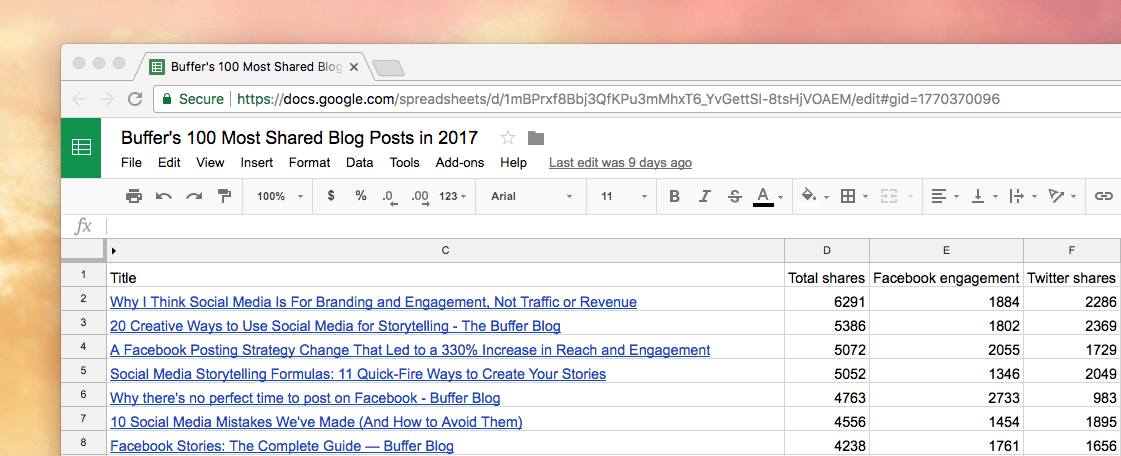
If you’re interested in checking out our 100 most shared blog posts and the number of shares each of them has received, you can find them here:
Buffer’s 100 Most Shared Blog Posts in 2017
Our learnings:
Based on our most shared blog posts, it seems that two types of content are widely shared on social media by our audience. The first is opinionated, thought leadership content such as the first and the fifth most shared blog posts. The second type of content is blog posts that focus on actionable tactics.
To understand why they are so highly shared, I turn to Wharton professor and author of Contagious, Jonah Berger. According to Jonah Berger, there are six key ingredients to make something viral
2:
- Social currency
- Triggers
- Emotion
- Public
- Practical value
- Stories
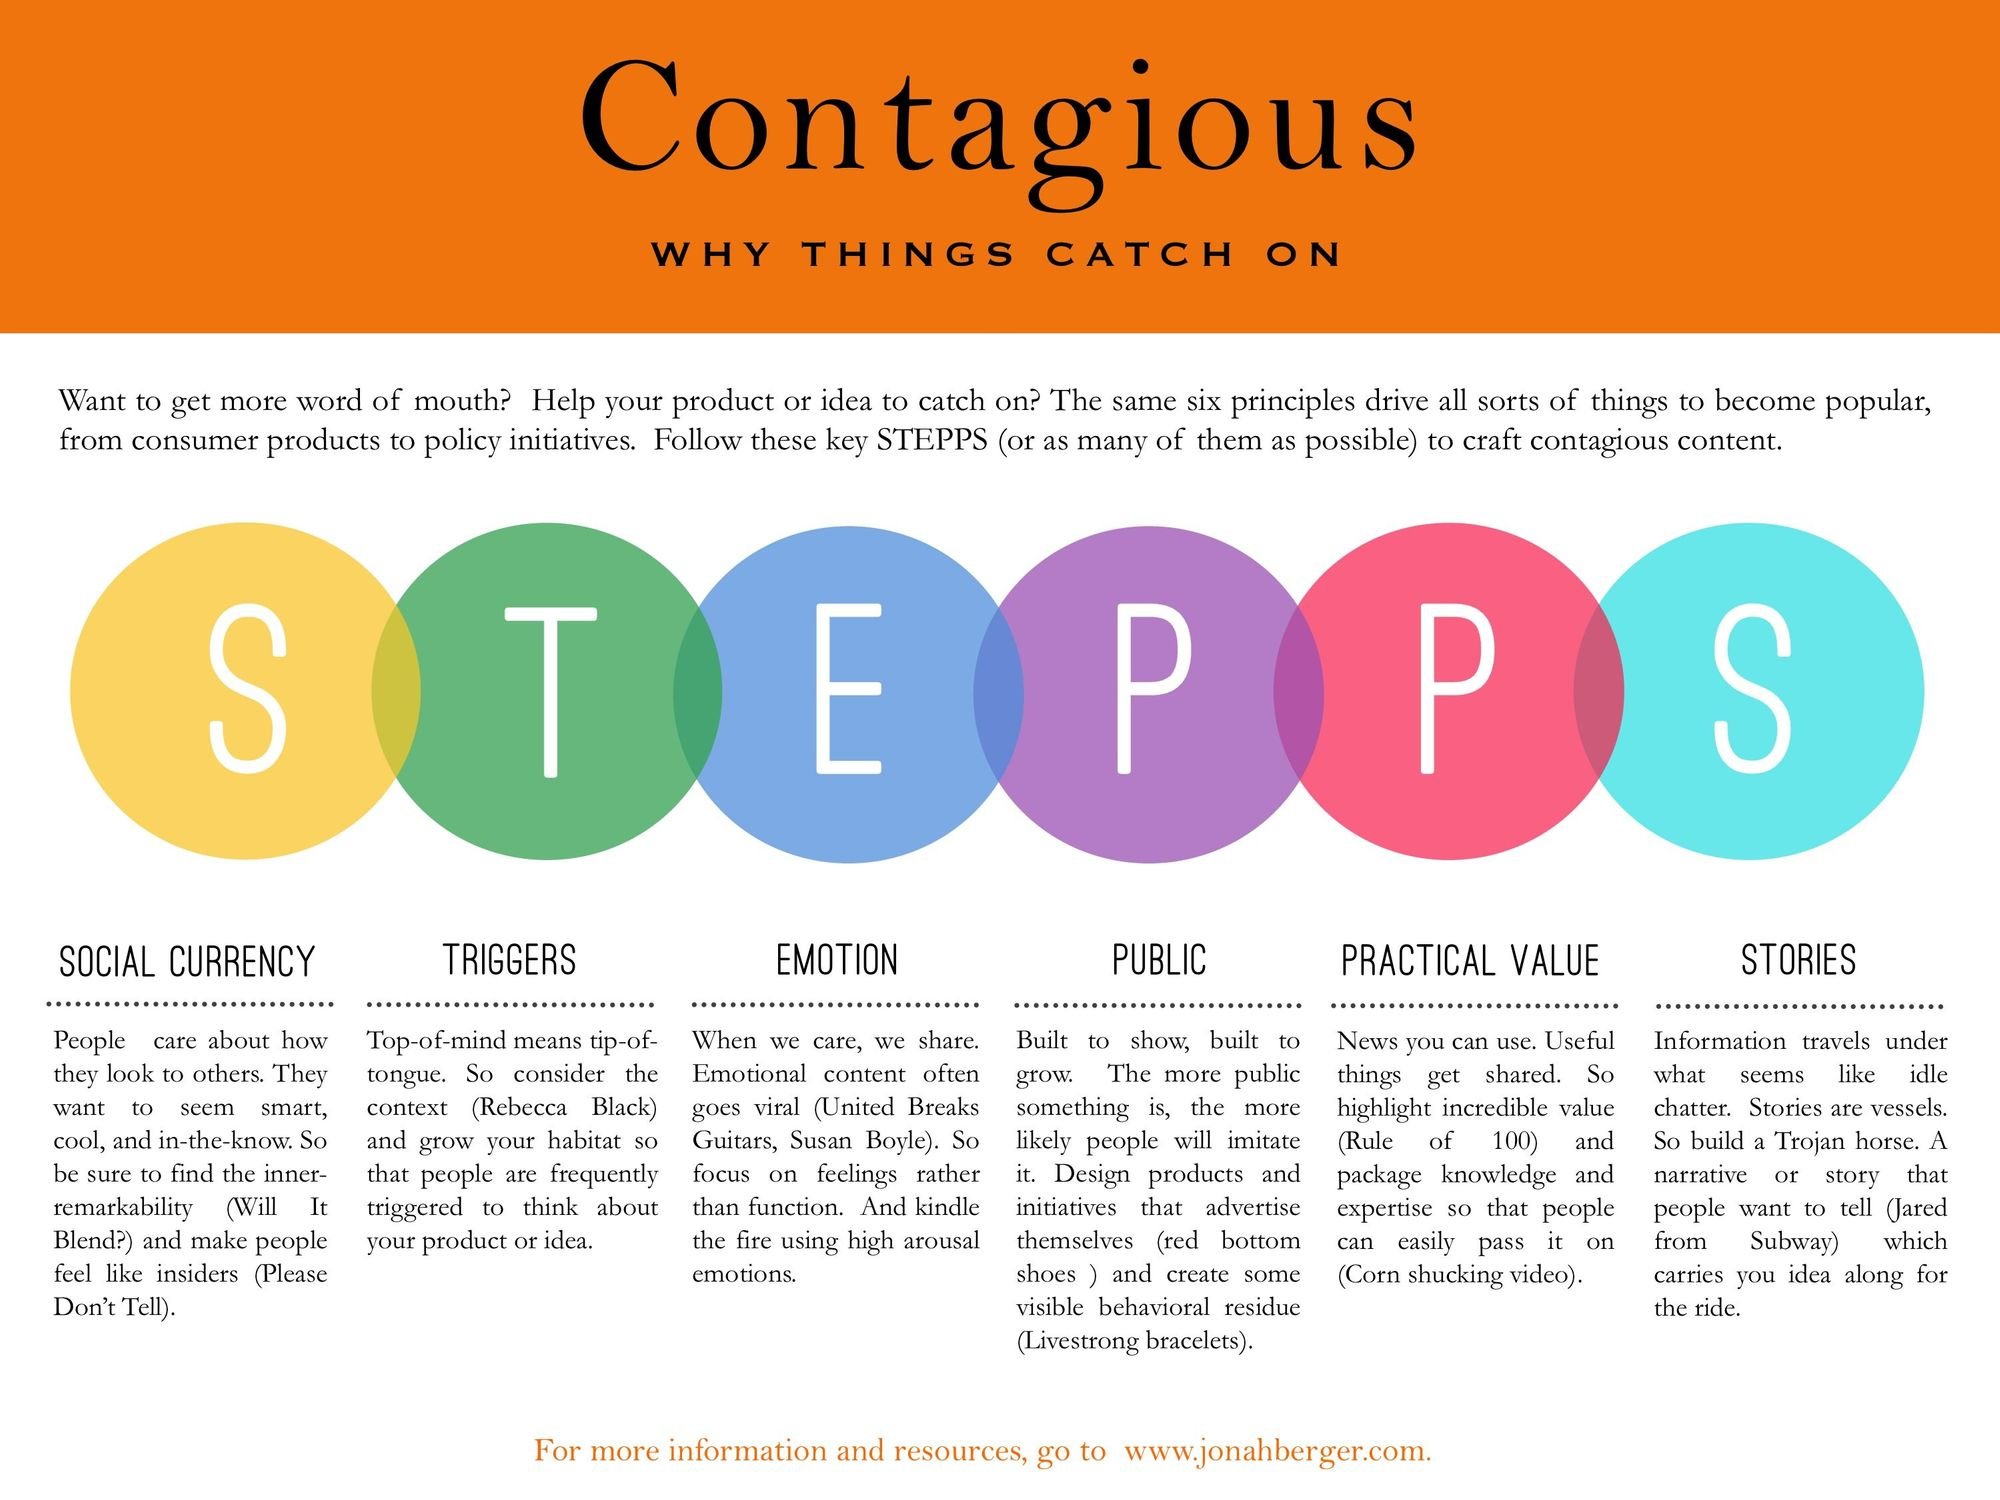
While our most shared blog posts don’t have all six ingredients, they do give our audience social currency and practical value, which likely helped make the blog posts highly shared.

If you also want to get your best of 2017…
Reviewing your social media performance is great for learning what has worked (and what has not) and how to improve going forward. If you would like to find your top social media posts for 2017, I want to quickly share a way to do that with your Buffer dashboard:
First, select the social media account you want to review. Then, go to the analytics in your Buffer dashboard, and click on the “Posts” tab. Here, you’ll see your recent posts.
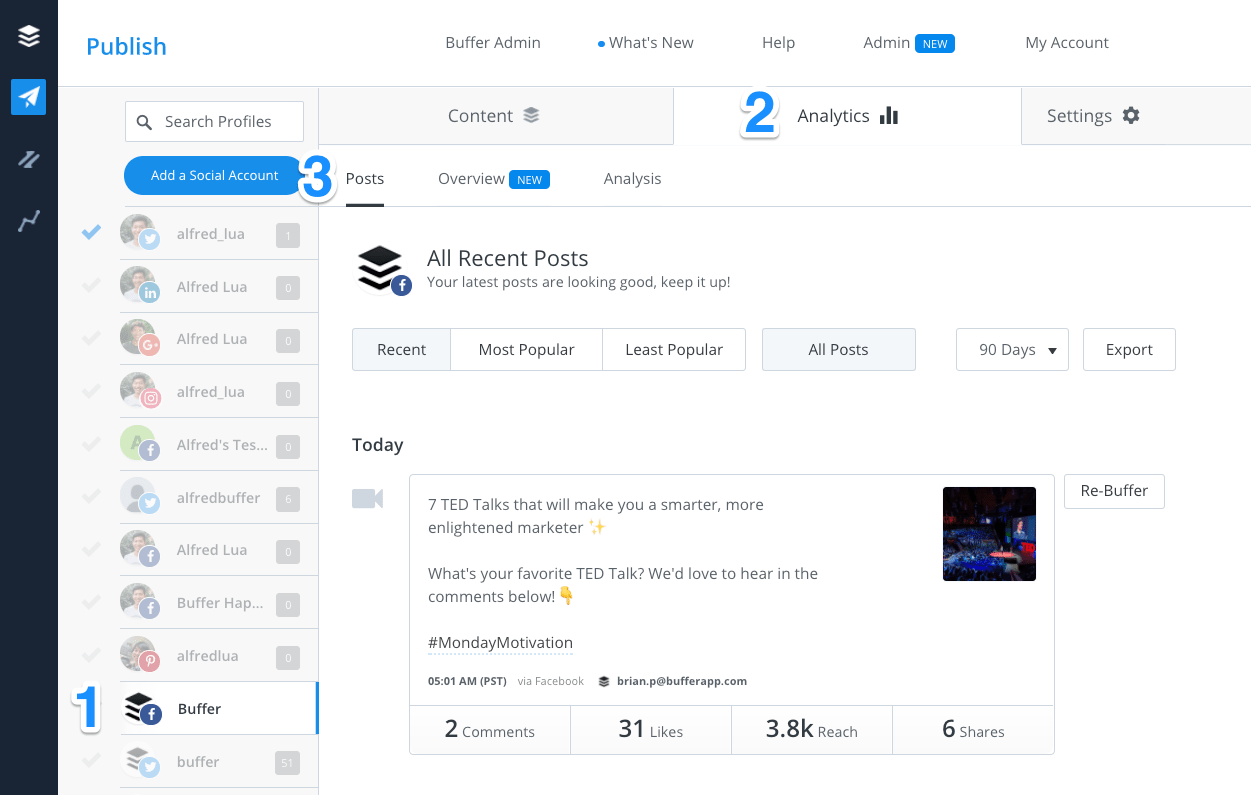
Next, sort your posts according to your preference, such as most popular, most clicks, or most shares. If you wish to, you can also filter by post types, such as image posts, video posts, or link posts.
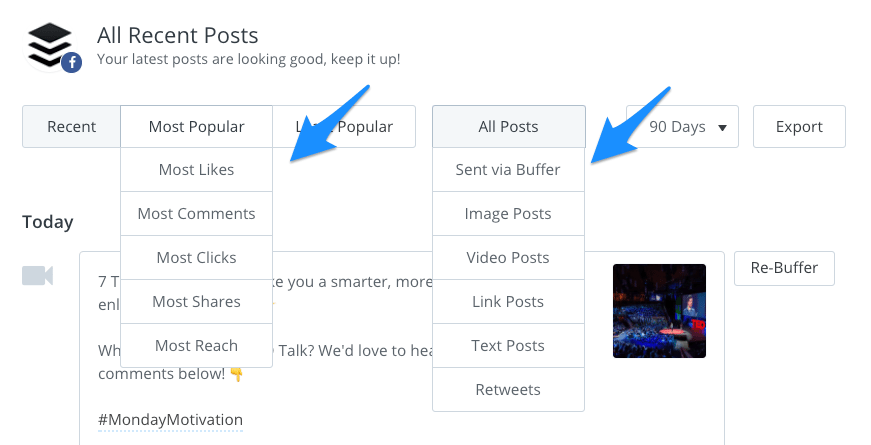
Finally, set a custom timeframe — from Jan 1, 2017, to today’s date.
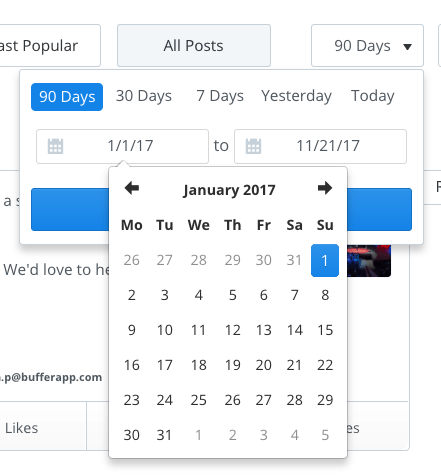
Voilà! Here are your top posts for 2017. What can you learn from your top posts? Do you notice any trends in your top posts? Does any post stand out to you?
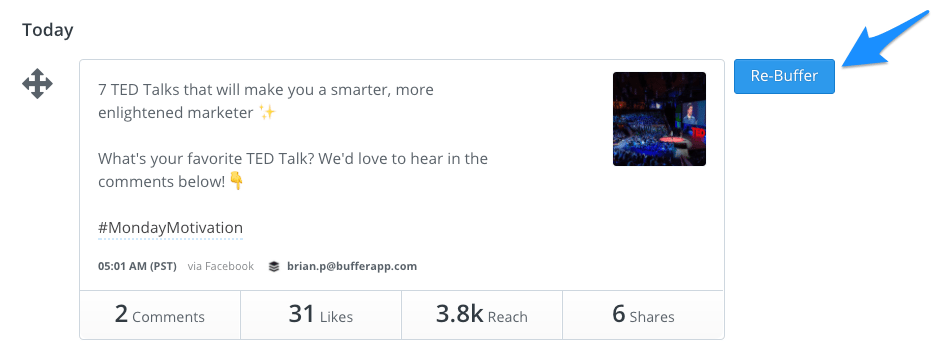
Tip: You can quickly reshare a top post by clicking on the “Re-Buffer” button on the right of a post. You’ll be able to edit the post before adding it to your queue or scheduling it for a particular date and time.
If you are not yet using Buffer for Business, we would love for you to give it a go and experience it!

What do you want to see from us in 2018?
It has been fun looking through our top social media posts for 2017. I hope you find our learnings beneficial for your social media strategy.
Looking ahead into 2018, we would love to continue sharing content that you love on our social media accounts. What do you want to see from us? Is there any particular type of content you want us to share? Let us know!
—
Image credit: Unsplash, Jonah Berger
Try Buffer for free
190,000+ creators, small businesses, and marketers use Buffer to grow their audiences every month.


