
How active is your brand on Pinterest?
With 150 million monthly active users spending an average of 98 minutes per month using the platform, Pinterest can be an underused network for some, while a primary source of website traffic for others.
Earlier in 2016, we did a study on brand marketing (studying over 16 million social media posts from 100,000 brands) and learned that Pinterest, in particular, holds a lot of potential for brands. This inspired us to dive even deeper into what’s happening on Pinterest.
We looked at over 1.5 million pins, all sent in 2016, to see what patterns we could find: when pins were sent, when people were pinning, and what words they were using.
I’m excited to share these findings with you and hope they can help you start, or enhance, an amazing Pinterest marketing strategy.
Let’s jump right in!
The top 4 Pinterest insights we discovered: When pins are posted, common words, and best times for engagement
About the data
Before we jump into our findings, I’d love to share some details about the data we used for this study:
- We analyzed 1,577,234 pins sent from 20,319 Pinterest profiles
- 99% of the pins we studied contained an image, 0,3% a video and around 10% included links
- The data was taken from January 1st, 2016 until August 23rd, 2016
When are pins being posted?
Personally, I had estimated that people might be pinning the most on weekends, but I was completely off on this one!
We looked at patterns for days of the week that pins were being posted. The most pins are posted on Mondays and Tuesdays.
In fact, pins are twice as likely to be posted on a Monday or Tuesday than on a Saturday or Sunday.
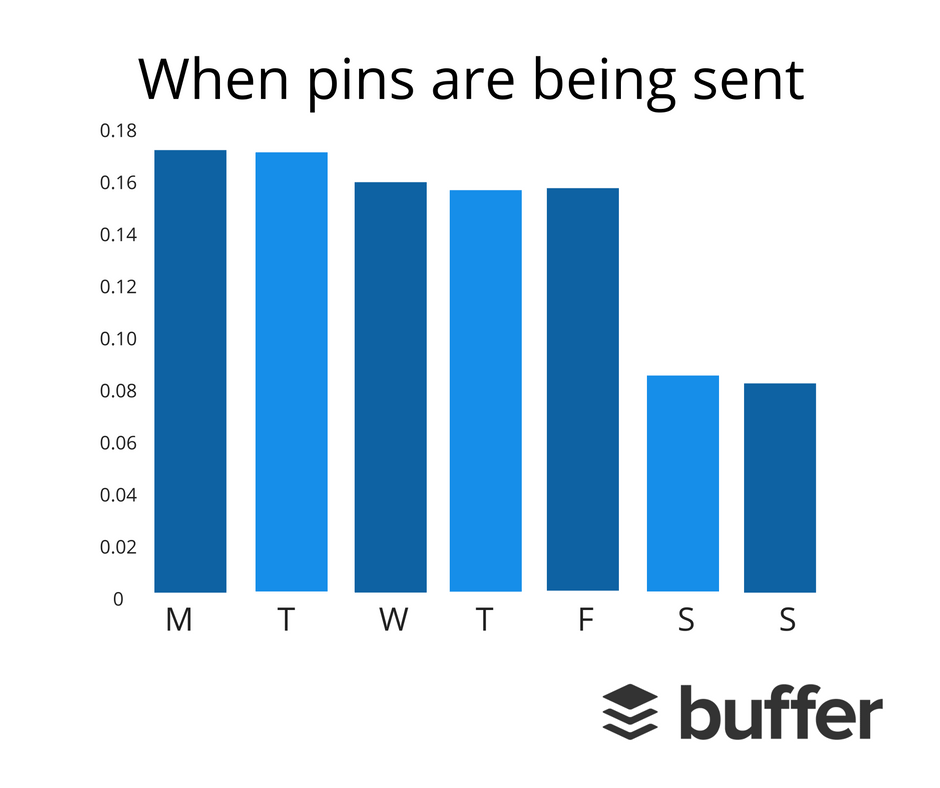
According to our data, 32% of pins get posted on Monday or Tuesday (~ 16% each day). The least popular days for pinning are Saturday and Sunday where around 7% of pins are posted respectively.
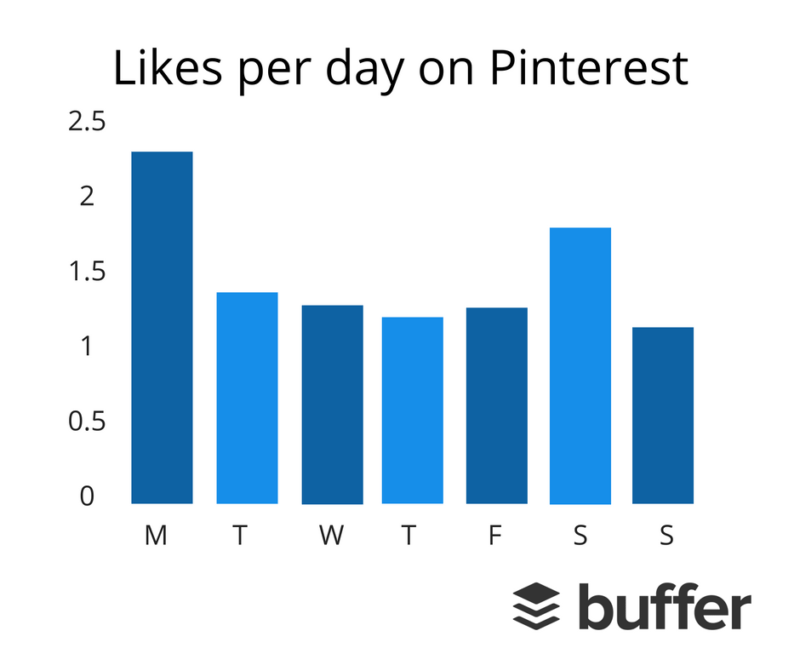
When are people engaging on Pinterest?
Alongside the most popular days to share content, it also felt important that we take a look at when people are engaging with content on Pinterest. Here’s what we found…
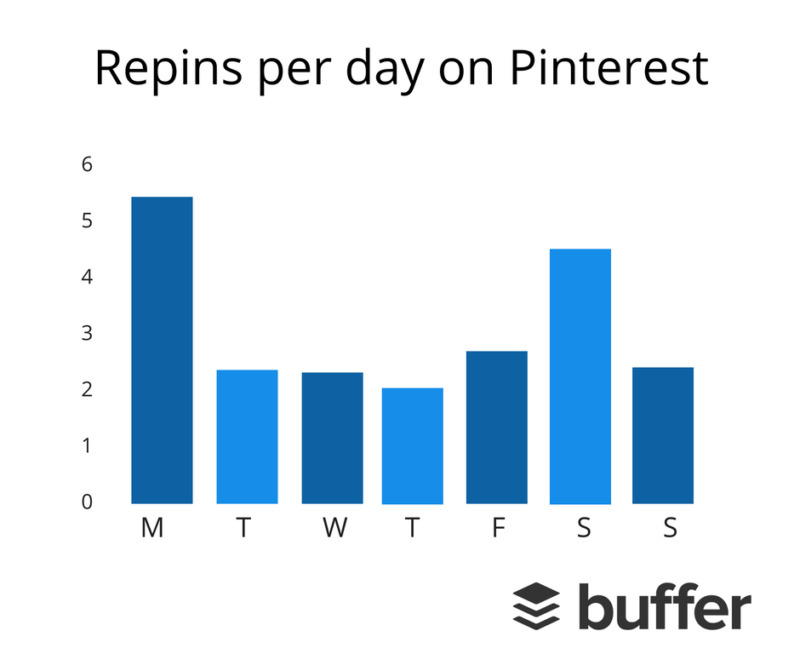
Turns out, the most popular days that people are liking and repinning on Pinterest are very similar to the days when pins are being posted. For engagement, Monday and Saturday are the most popular with Monday taking a slight lead.
Here’s the breakdown, by day, of average likes per pin on Pinterest:
And here’s the daily breakdown for average repins per pin, where Monday and Saturday are both in the lead:
What words are people using most on Pinterest?
We were super curious about the words that people are using on Pinterest as it speaks to both the images they are sharing and what they think about them.
Here are the top nine words, ranked by volume:
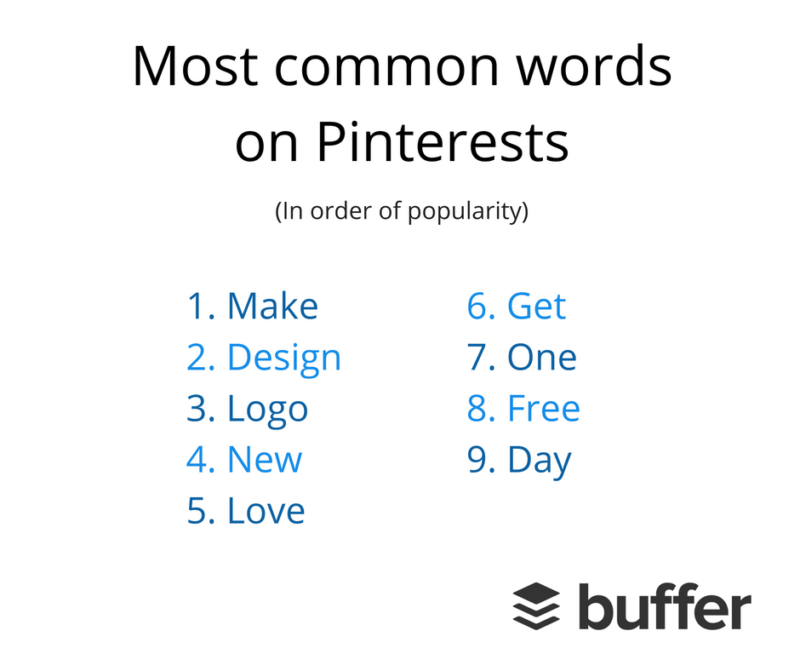
Looking at the top nine words used most frequently in Pinterest captions, it’s neat to see the top three are Make, Design and Logo. This hints that the most engaging content might be rather creative and related to design (maybe even digital design with the word logo making an appearance).
After those three, the other top words are: new, love, get, one, free, day.
Make, the most pinned word we found in this study, appeared in 63,293 pins – that’s around 4% of the 1.5m pins we analyzed.
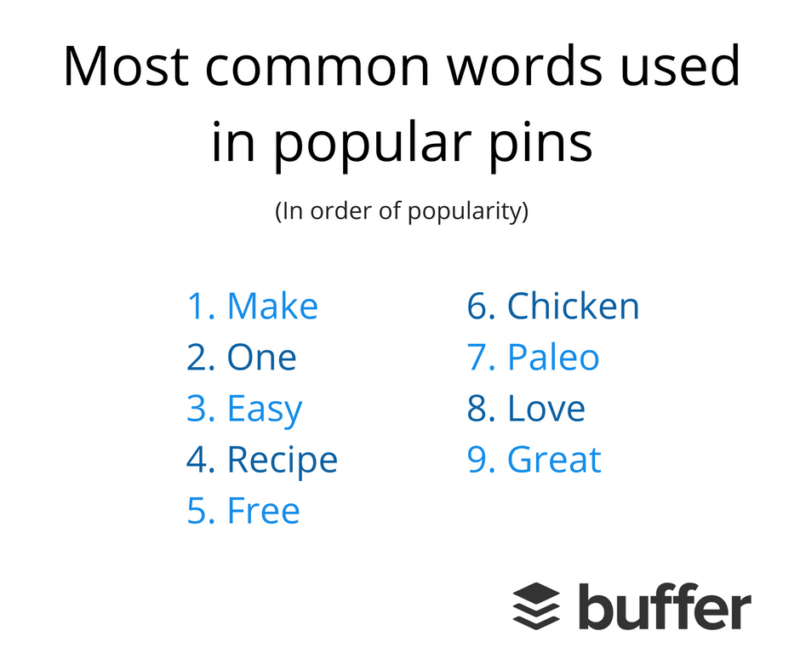
What are the most common words for the most popular pins?
After looking at the most common words in general on Pinterest, we wanted to tie these words into engagement, e.g. which words are being used in only the most popular pins.
The difference is interesting here. Make is still the lead, followed by One, Easy, Recipe, Free, Chicken, Paleo, Great and Love.
How to use this data: 4 Pinterest experiments you can try today
We’re grateful for the large amount of Pinterest marketing tips out there online. And I’d love to share with you four brand new experiments we came up with based on data from our study. You’re welcome to grab any of them if you’re keen to put this data to use (we’d love to hear how it goes for you, too).
1. Experiment with using fewer words
We found that the average character length for pins was 98 characters. With Pinterest being a visually driven platform, very few characters are shown when scrolling through the feed. In our experience, our pin captions are truncated around 50-60 characters, with the rest of the caption viewable once someone clicks or taps into a pin.
This gives us the sense that it’s incredibly important to choose those characters wisely.
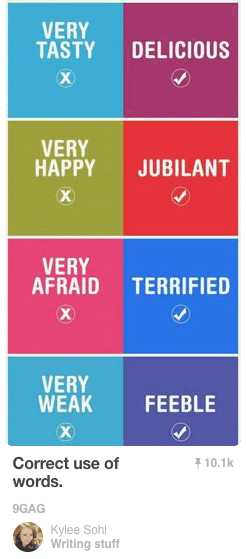
In this example, Kylee only uses 4 words (18 characters).
Experiment to try: Using fewer words in pins and making them short, sweet, and catchy.
On Pinterest, your image is essentially the headline, and it’s most likely a user will stop scrolling when a visual catches their eye rather than the supporting text. What’s important, though, is that your text gives added context to your posts and helps to illustrate what the image is showing. I really love the example we shared above and its caption. In just four words — “Correct use of words” — Kylee manages to explain exactly what the image is telling us.
When it comes to writing your caption, think about what you need to say and try not to be too elaborate. Our hunch is that “simple = better” when it comes to copywriting on Pinterest.
2. Experiment with the days you post to Pinterest
Posting at the right time is a key part of any social media strategy, and it’s no different on Pinterest.
Our study found that most pins are sent on Mondays and Tuesdays and most engagement (likes and repins) comes on Mondays and Saturdays. There are a couple of ways you could look to interpret this data:
- You could look to post your pins on Mondays and Saturdays when you know engagement could potentially be higher.
- Or, you could look to post on days when fewer pins are shared in the hope there’s more chance to stand out. For example, Sundays tend to see fewer pins shared than any other day.
There’s no hard and fast rule here and our best recommendation is to set up a few experiments and see what works best for your brand. Luckily, it’s super simple to get an experiment like this up and running…
How to experiment with your posting schedule
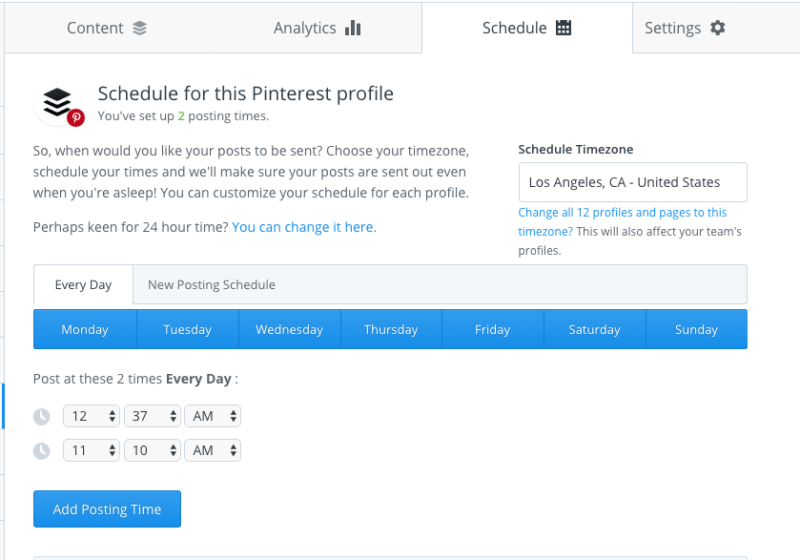
It’s super easy to set up a schedule for your pins within Buffer and then track how they’re each doing using our Analytics tool.
From the Schedule tab within Buffer, you can toggle different days of the week on and off to experiment with posting on various days and you can also select various times on each day. Here’s a quick peek at how the scheduling tab looks; you can see we’re currently set up to share pins every day at 12:37 a.m. and 11:10 a.m.:
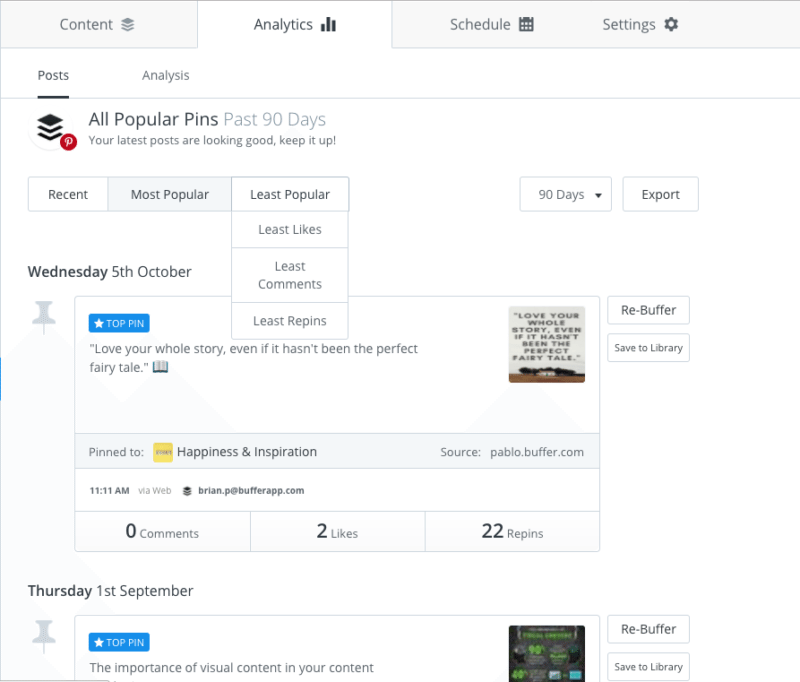
Once you’ve tried this for awhile and are ready to analyze and learn from your results, head on over to the Buffer Analytics tab and try sorting by “Most Popular” to see patterns as to which days of the week are getting the most traction.
Experiment to try: Change up your schedule and test various days to see which ones your audience is most active on and where you get the most engagement.
3. Try sharing creative Pins
Pinterest has become a go-to place for finding and sharing creative ideas. And our data appears to back this up.
Diving into the most used words on Pinterest, and especially the most used words on popular pins, words like make, one, easy, design, and new seem to suggest that creative content does well on Pinterest.
If you’re a regular Pinterest user, pins like the below example will probably look quite familiar:
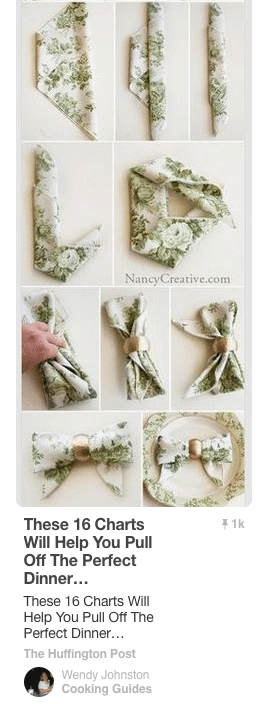
A number of successful pins tend to show users how to create something step-by-step, and this could be no matter what your industry. This opens up some exciting content opportunities and ways for your brand to stand out. These types of pins are also good examples of how to drive traffic back to your website from Pinterest. In the above example, you can see the steps taken to create the table decoration.
These types of pins are also good showcases of how to drive traffic back to your website from Pinterest. In the above example, you can see the steps taken to create the table decoration, but by clicking on the post and visiting the accompanying Huffington Post article, you’ll get the full story and even more ideas for creative ways to make your dinner party memorable.
Experiment to try: Test out getting creative with pins, doing a how-to photo or using imagery that inspires creating and designing.
4. Offer a free resource to Pinterest followers
One word that appeared in both the most commonly used list of words and the words commonly found in the most popular pins is “free.” And who doesn’t love high-quality, free content?
Pinterest is a great place to share resources and guides with your followers, and if you’d like to get some more attention and drive some added engagement to your pins, letting Pinterest users know in the text (or even the pinned image) that the resources are free could be a great way to do so.
In this example, a free crochet pattern is being shared. It’s also a great example of using Pinterest to drive traffic back to your website where the content is hosted.
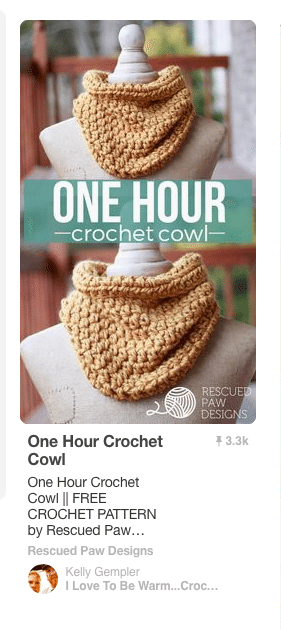
Experiment to try: Use Pinterest to give away content, resources, ideas, and anything else you can think of giving away, and ensure you let your followers know it’s free.
Over to you
Thanks so much for reading! I hope you found the study interesting and I’d love to hear how our findings feel to you…
- How do you use Pinterest?
- How many times do you post per week? And which days drive the most engagement?
- What type of content gets the most engagement for you on Pinterest?
I’d love to hear what’s working for you and any thoughts you may have in the comments below. Excited to keep the conversation going.
Try Buffer for free
190,000+ creators, small businesses, and marketers use Buffer to grow their audiences every month.