
At Buffer, we love to see new stats and research about how to best share to social media and drive engagement. And as a brand on social media ourselves, we know just how challenging it can be to post engaging content across multiple channels.
To learn more about how brands are tackling social media in 2016, and importantly, to discover what’s working, we decided to study what types of posts brands were sharing the most of on social media.
We examined over 100,000 accounts, which consisted of over 14 million tweets and two million Facebook updates to figure out how brands have been sharing to social media over the past 12 months.
Here’s how it broke down…
How have brands been sharing to social media
Which social networks are brands posting to?
Facebook and Twitter are still leading the charge
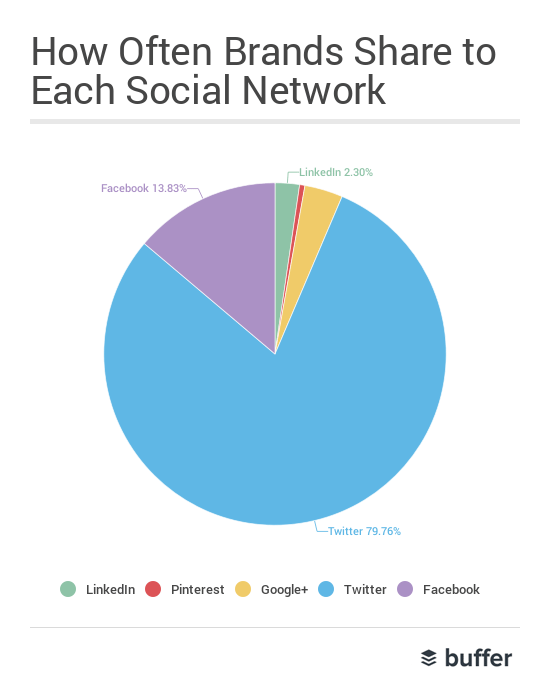
After looking at over 16 million updates over 12 months, covering Pinterest, LinkedIn, Google +, Facebook and Twitter, we found that brands posted primarily to Facebook and Twitter. It makes sense seeing as both social networks have the largest active audiences of the group according to this study.
Here’s the breakdown of percentages:
- 79.6% of updates were sent to Twitter
- 13.8% of updates were sent to Facebook
- 3.6% of updates were sent to Google +
- 2.3% of updates were sent to LinkedIn
- .5% of updates were sent to Pinterest
How many times are brands sharing per week
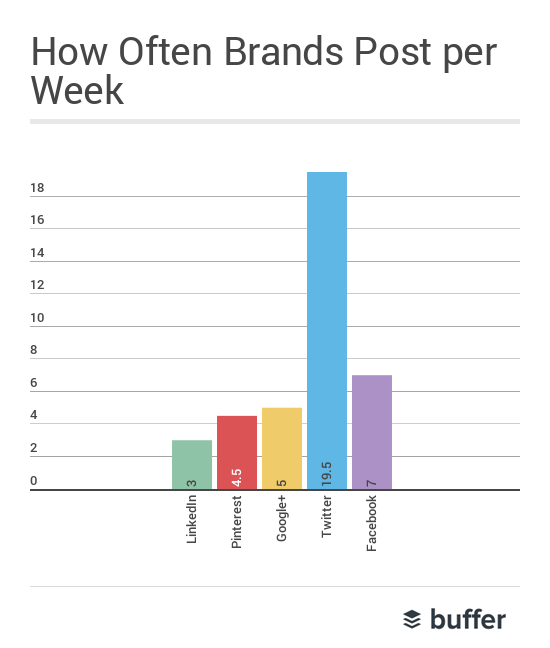
This data was super-interesting for us as we love to experiment with posting schedules frequencies. We found that brands posted to Twitter more than any other network – which feels about right considering the more real-time feel of Twitter.
I was a little surprised to see that Facebook is the only other network where brands post an average of once per day.
Which types of post are getting the most engagement
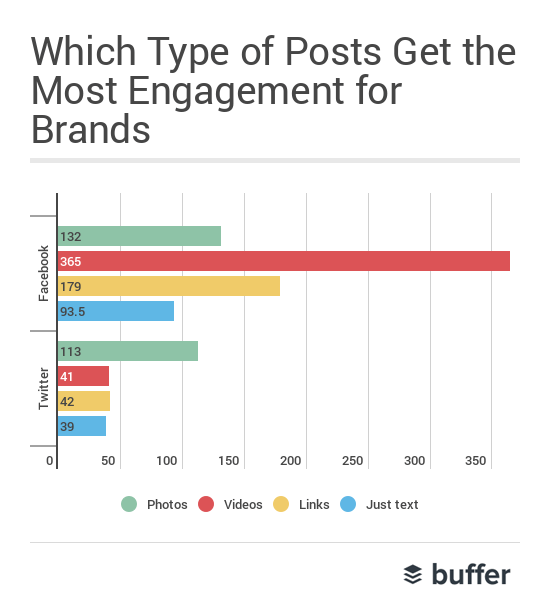
For this part of the study, we looked at how many engagements (clicks, likes, shares) each post a brand shares gets on average across Facebook and Twitter. We found that Facebook video appears to be leading the way here (by a considerable margin, too) and photos are still leading the way on Twitter.
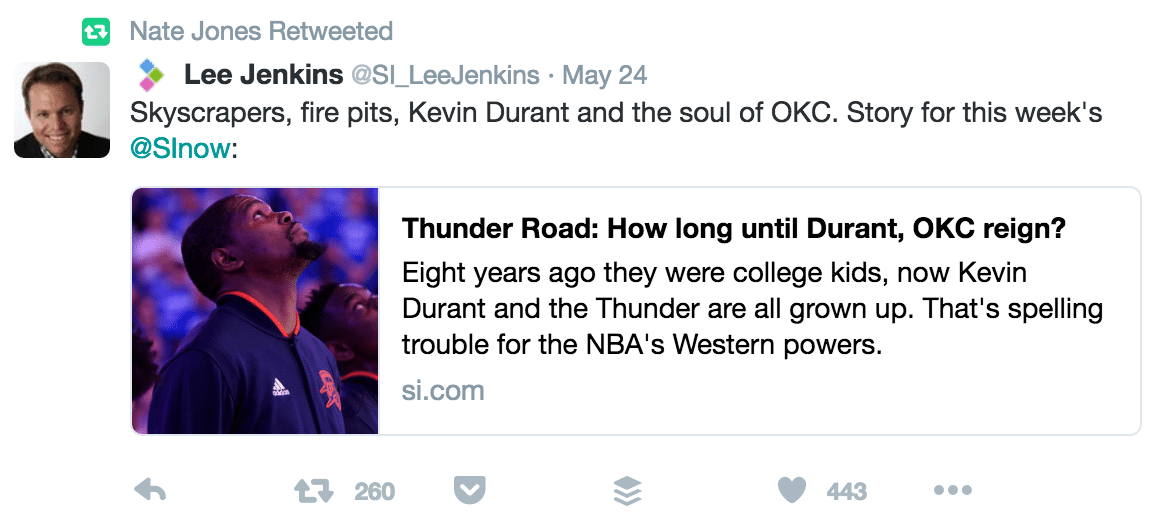
It’s interesting to see that links appear to be driving more engagement than photos on Facebook at the moment. It feels like this could be due to their visual nature, now when you post a link, a large image is displayed, as is meta data from the post, giving brands plenty of opportunities to grab user’s attention as they scroll through their news feeds.
Here’s an example:
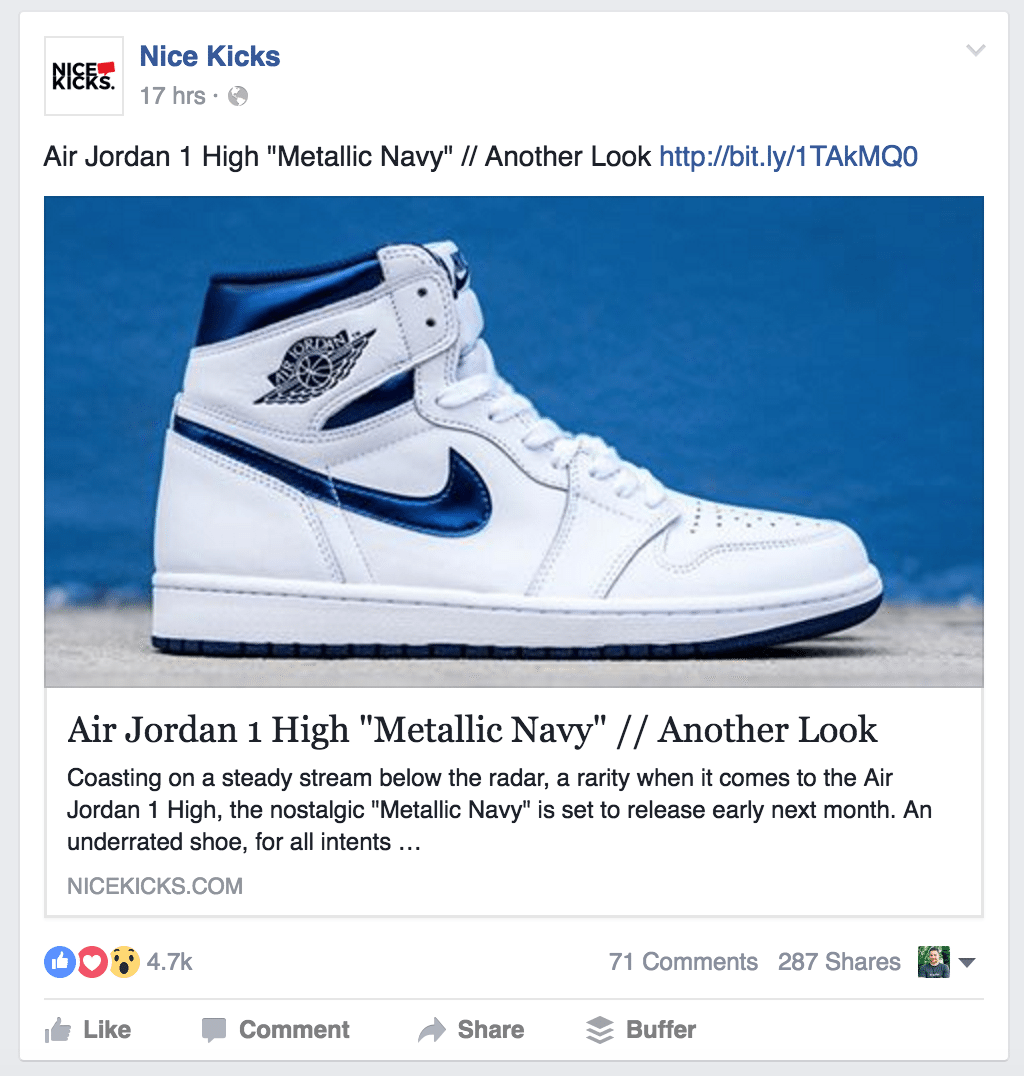
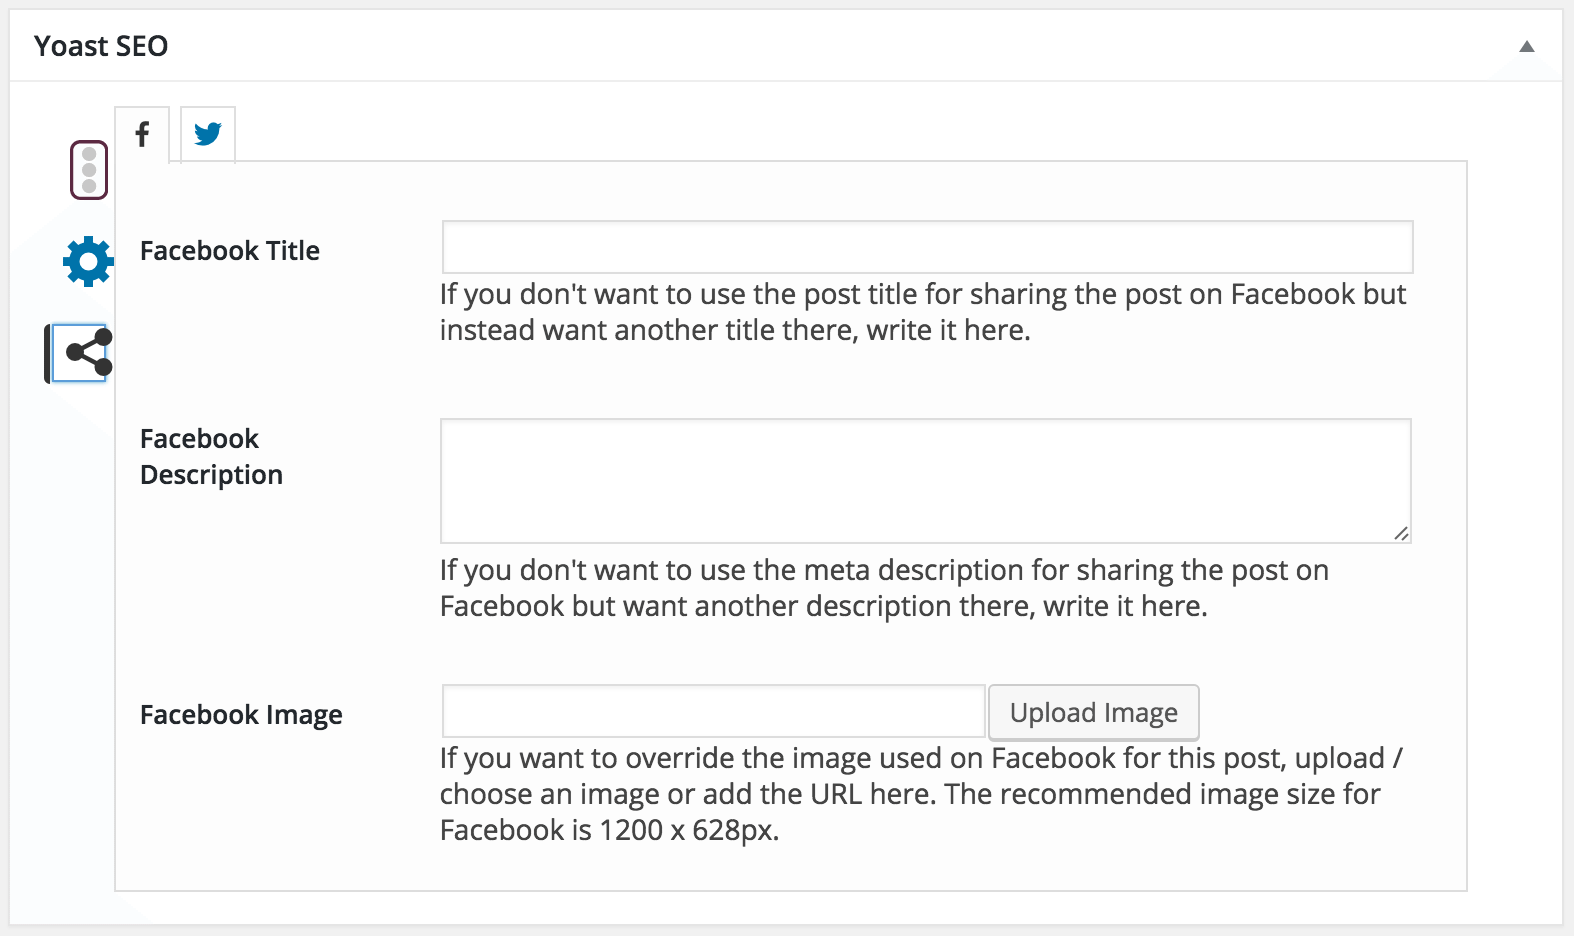
A cool way to potentially further increase the success of links on Facebook could be to create specific headlines and descriptions for your post. Here at Buffer, we use a neat tool called Yoast to choose the image, title, and description that’ll accompany a link when posted to Facebook:
Does Twitter have a noise problem?
Twitter have recently made similar adjustments with links pulling meta data into the timeline. Could this lead to a boost in Twitter link engagement? Maybe. But for now, it feels a little like Twitter has a noise problem, with images being one of the few ways to stand out in the timeline.
How are brands posting to each network
Three ? social media lessons we’ve learned from this study
1. Video is largely underutilised
Despite all the excitement surrounding social video, the data shows that video is still underutilised by many brands.
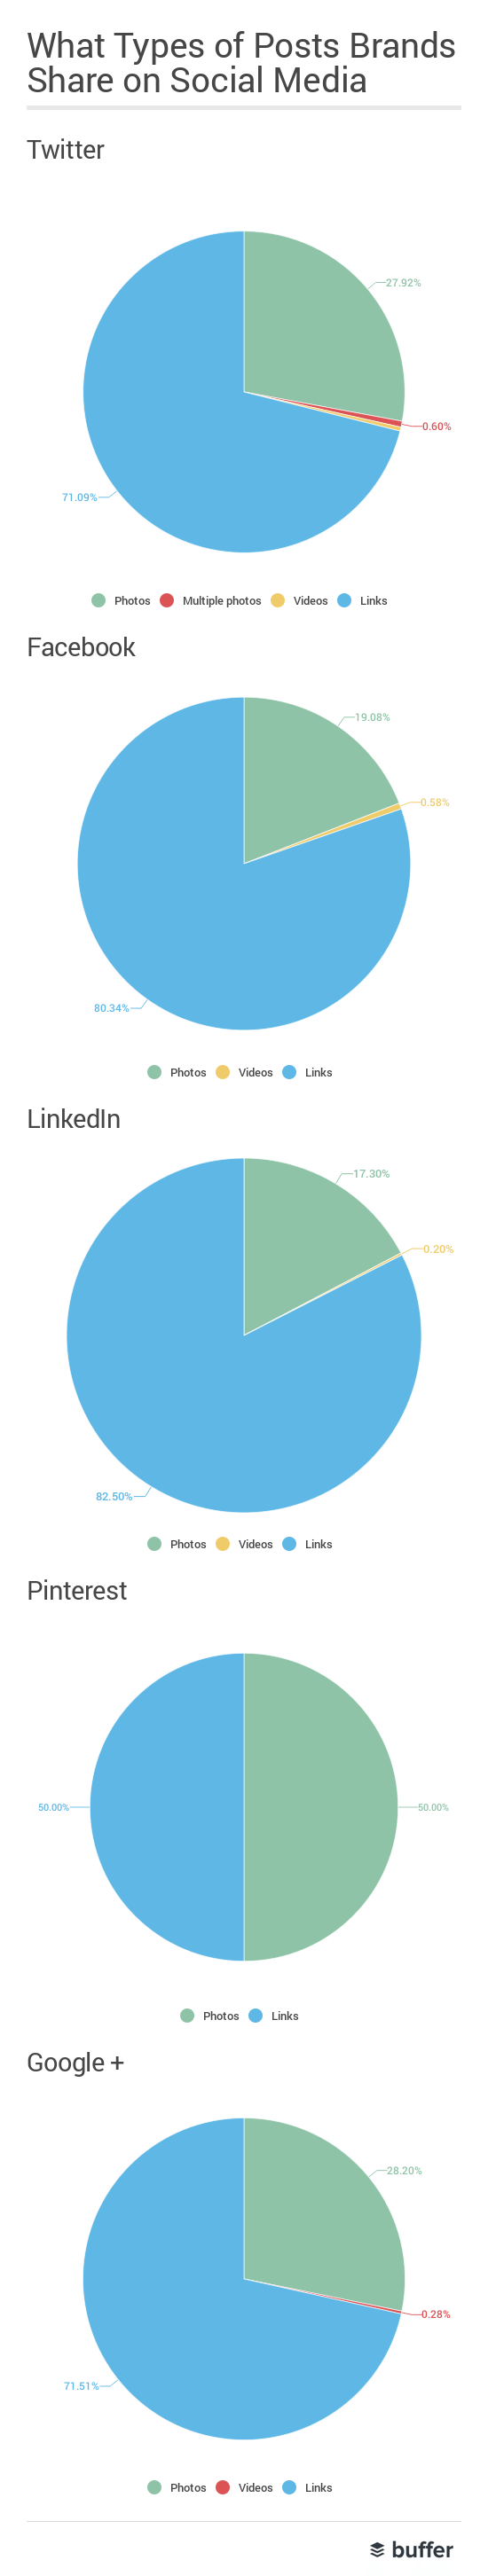
On Facebook, video gets three times as much engagement as any other kind of content, but in the 7 posts that brands share on Facebook per week, far less than 1% are videos. Of the remaining 99%, 80% are links and 19% are photos.
The lesson here could be to experiment with sharing more video on Facebook, especially with Facebook’s new live feature, to see how it affects brand engagement.
2. Links are engaging (but are we sharing too many?)
While brands share links often, on every social network at least 50% of the content is links. For Facebook and LinkedIn over 80% of the content is links, and on Twitter it’s just over 70%.
However, looking at the data around engagement, links are second to Video on Facebook and second to Photos on Twitter for most engaging types of content.
For many of us, driving traffic back to a website via links is a key part of our social media strategy. I’d be curious to see whether mixing up more non-link based content could actually increase the engagement for links when they’re posted. For example, on Facebook, posting more videos could increase engagement and reach meaning more users may see links when we publish them.
3. Brands are missing out on LinkedIn and Pinterest
According to this 2016 study, 59% of LinkedIn users don’t visit twitter, 83% don’t use Pinterest and 13% don’t use Facebook. Which means that unless you’re capturing them on Facebook, LinkedIn users could be a completely untapped market for you.
According to our study, brands post to LinkedIn only 3 times per week, whereas in this small business guide by LinkedIn, they share that posting 5 times a week, on week days, allows you to reach 60% of your audience.
Pinterest looks like it might be a lost opportunity for some brands as well. According to this recent Shopify study, two million people save product pins every day and 87% of Pinterest users say they have purchased something they found while pinning.
Despite the potential on Pinterest, brands are only posting to pinterest 4–5 times per week, whereas they could be posting that many times in a day. Top brands on Pinterest have experienced steady growth by adopting a multiple-times-per-day posting strategy.
Over to you
Thanks so much for reading! I’d love to hear how our findings feel to you…
- Which networks do you share to the most?
- How many times do you post per week?
- What type of content gets the most engagement for your brand?
I’d love to hear what’s working for your and any thoughts you may have in the comments below. I’m excited to join the conversation.
Try Buffer for free
200,000+ creators, small businesses, and marketers use Buffer to grow their audiences every month.