In our State of Social Media report, eighty-three percent of marketers said they’d like to create more video content in 2017.
And we can certainly see why marketers are so hot on social video. Facebook believe that most of the content we consume online in the future will be video. Twitter has recently relaunched Vine as a camera app enabling users to capture and share short-form video on the platform. And more than 10 billion videos are watched on Snapchat every day.
So it’s clear video is incredibly important to the future of social media marketing. However, when it comes to video, what does “success” really mean? And how do you know if your videos are performing well on social media?
Measuring the success of your video content can be a difficult task. Especially as almost every platform has a range of features and metrics. For example, some platforms count a video view as three seconds, others count a view as soon as you open a video. Some platforms auto-play videos, others don’t. Some channels have limits of 60 seconds for video and on others it’s unlimited.
How are we supposed to keep up?
In this post, we’d love to help you navigate the world of social video metrics. We’ll break down video metrics across Facebook, Twitter, Instagram and Snapchat to give you a definitive guide to what you can measure on each platform, how you can measure it and importantly what each metric means.
Let’s get started.

The complete guide to social video metrics
Here are all the types of videos we will cover in this guide:
- Facebook video
- Facebook Live
- Instagram video
- Instagram Stories
- Instagram live video
- Snapchat Stories
- Twitter video
- Periscope
- YouTube
Feel free to use the quick links to jump to the section that you are most interested in! If you want a quick overview of all the video metrics across all the platforms, check out our handy video metrics spreadsheet or the infographic below:
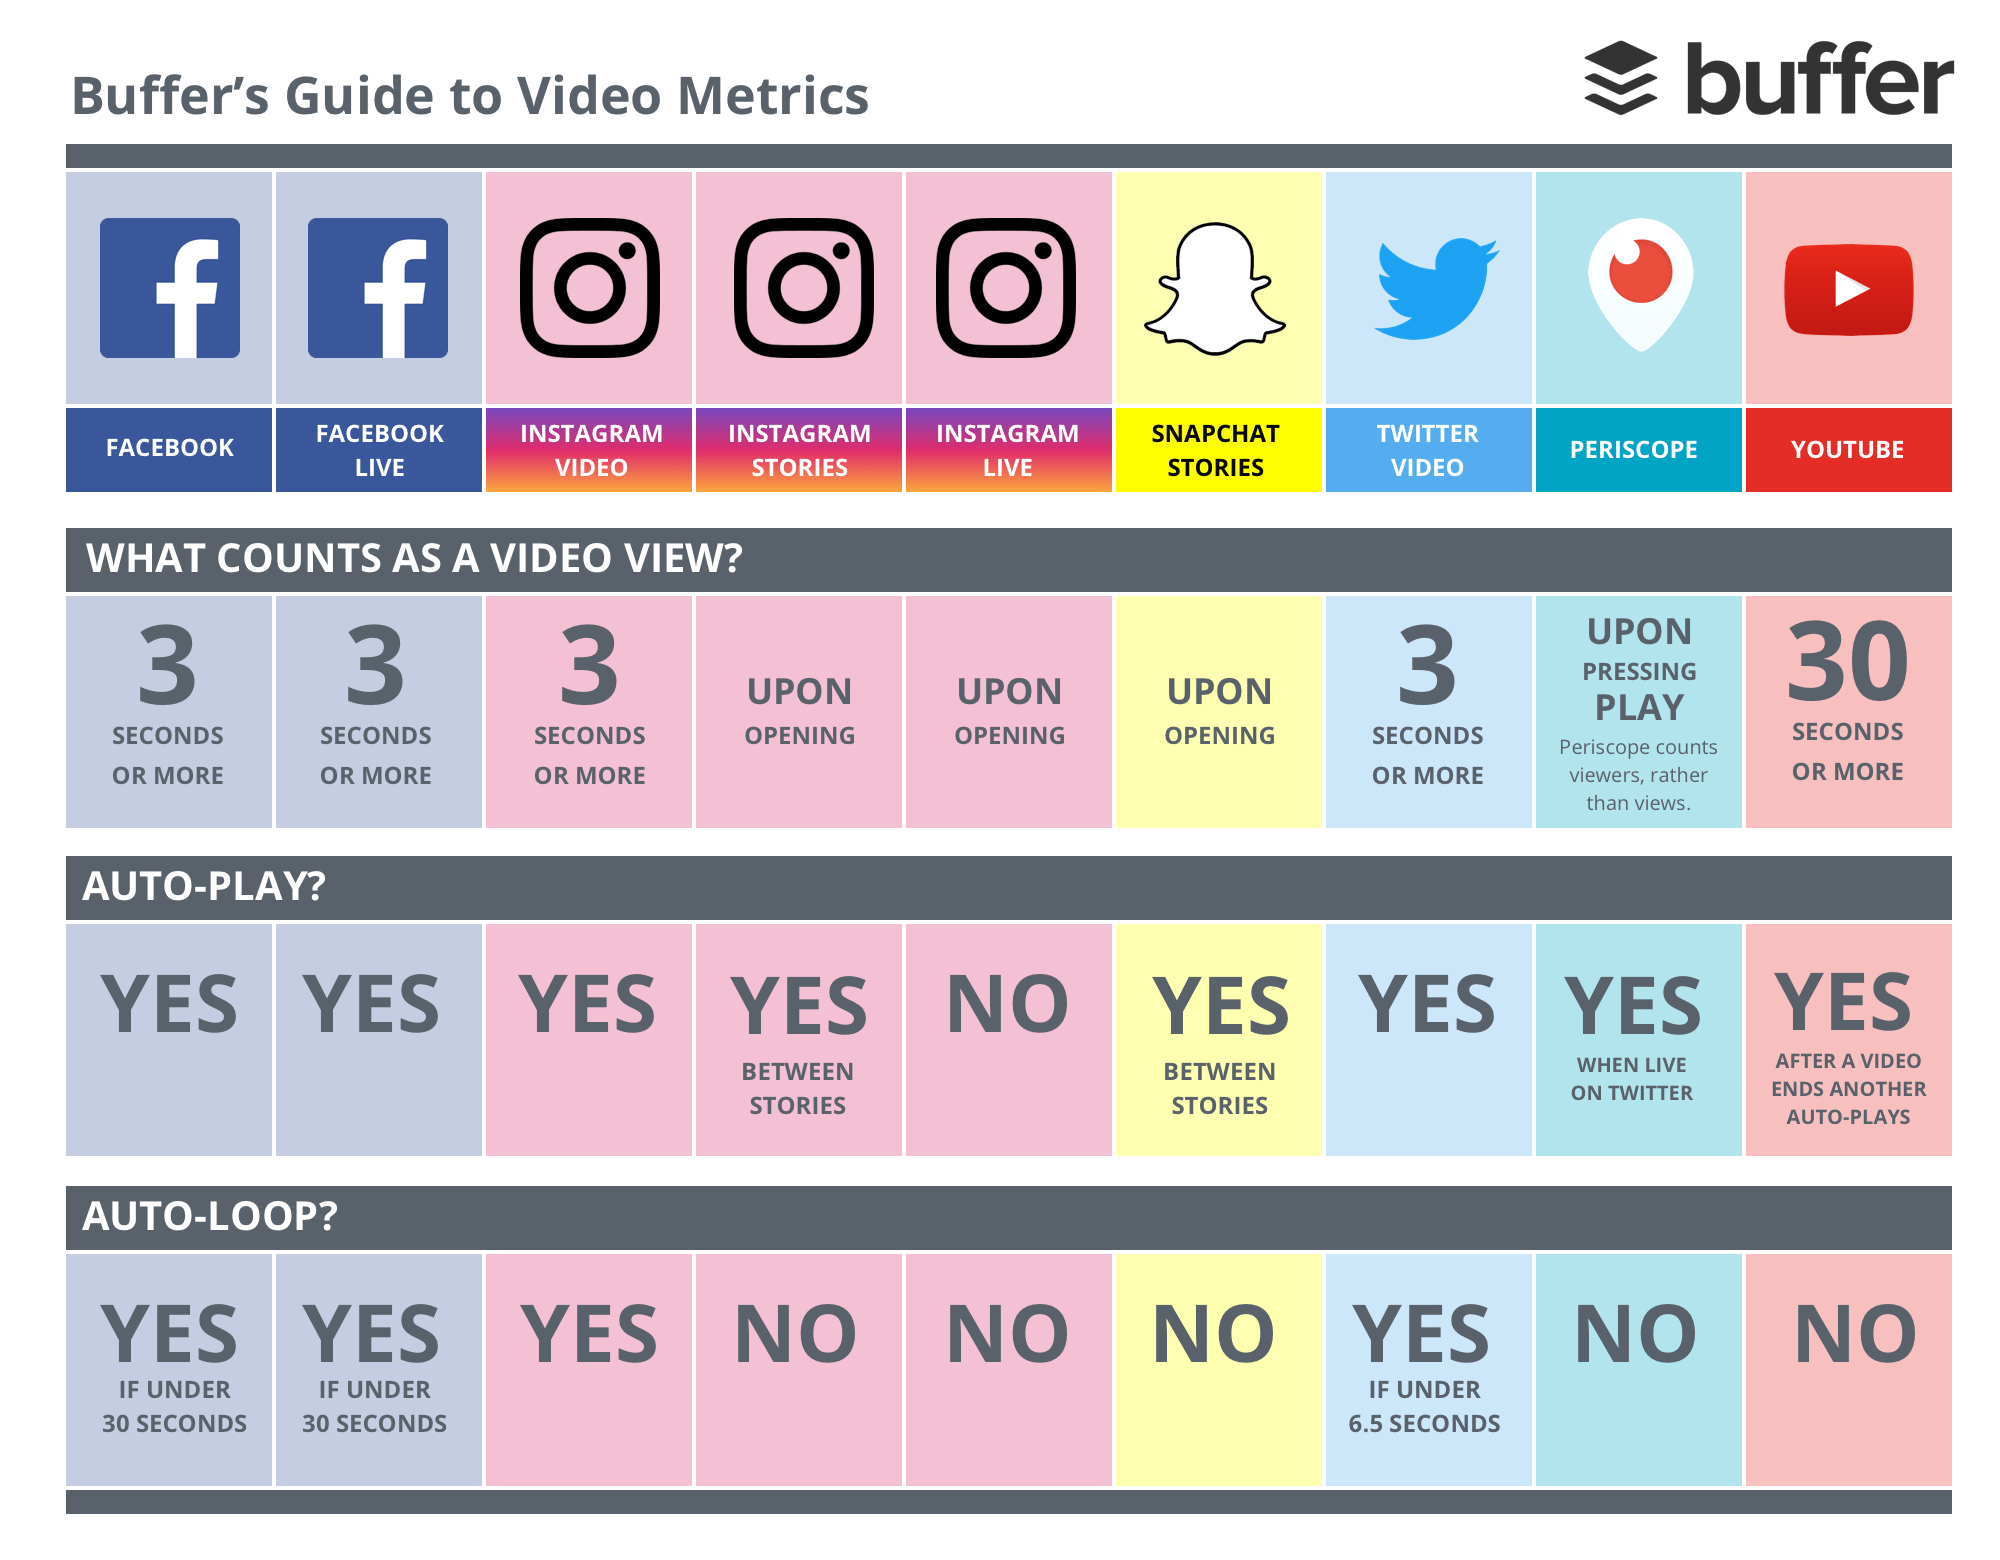
(Thank you, Andréa López, for inspiring us to write this article and create the spreadsheet. Andréa creates helpful spreadsheets about social media on Casual Spreadsheets. Thanks, Marketing Land, for inspiring us to create this infographic, too.)
—
1. Facebook video
Video view: 3 seconds or more
Facebook videos are one of our favorites here at Buffer and also for the 1,252 marketers we surveyed last year. We think that there are a lot of potential for Facebook videos this year.
Mark Zuckerberg even mentioned that Facebook is “making progress putting video first across [Facebook’s] apps” in the press release of Facebook’s Third Quarter 2016 Results.
Here’s an example of how a video post looks like on the Facebook News Feed:

Specs:
- What counts as a view? Three seconds or more
- Auto-plays? Yes
- Auto-loops? Yes (Videos that are 30 seconds or shorter will loop continuously for approximately 90 seconds.)
- Default audio state: Muted (The sound will be on for videos in the mobile app.)
- Maximum length: 120 minutes or 4 GB file size (360 videos are limited to a maximum length of 10 minutes and a maximum size of 1.75 GB.)
- Embeddable outside platform? Yes (Here’s how!)
- View counts for public? Yes
- View counts for owner? Yes
- Analytics dashboard for videos? Yes
Metrics available:
- Minutes viewed
- Unique viewers
- Video views
- 10-Second views
- Video average watch time
- Audience and engagement (People Reached, Post Engagement, Top Audience, and Top Location)
- Facebook also provides a bunch of other metrics for the Facebook post with the video such as reactions, comments, shares, and post clicks, under “Post”.
Where to find the metrics:
There are two ways to see your Facebook video metrics.
1. Overview and Top Videos
To see the overall performance of your videos, head to your Facebook Page Insights and select “Videos” on the left column.
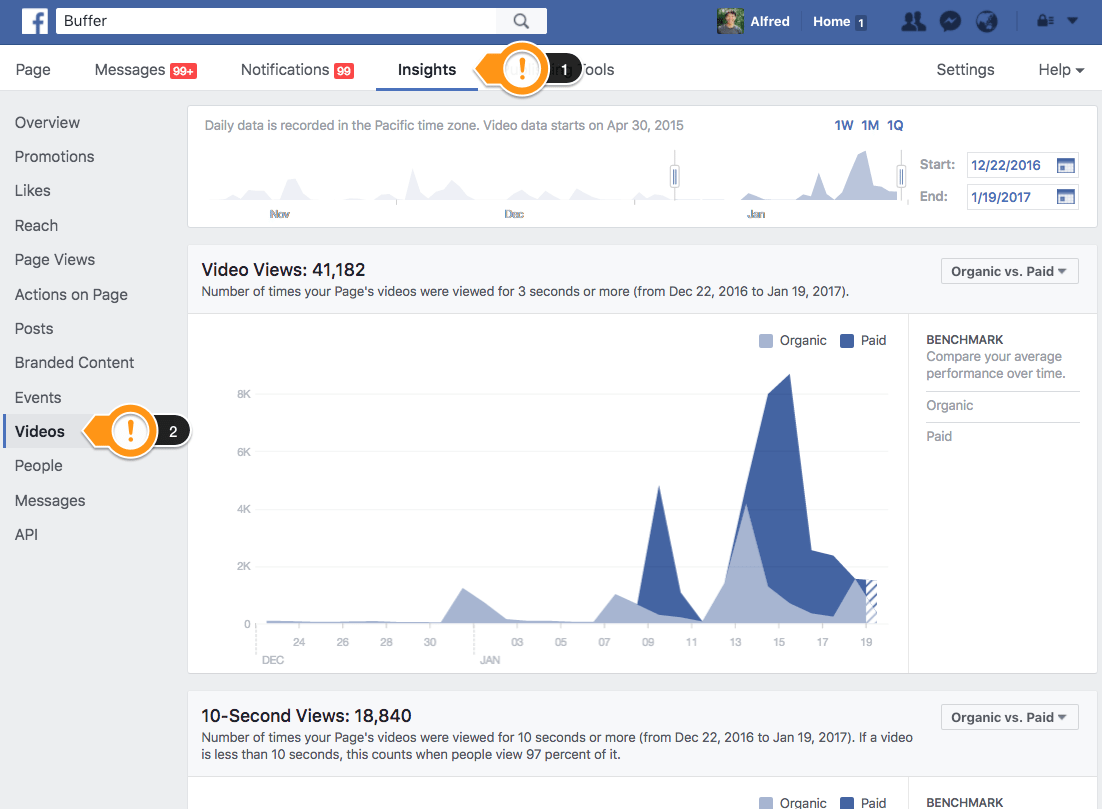
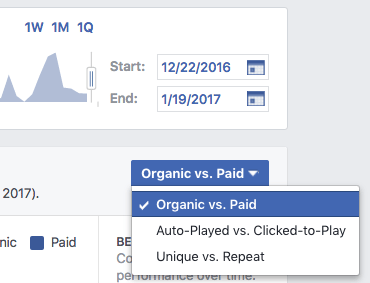
Here, you will see the total number of video views, total number of 10-second views, and the most viewed videos on your Page. You can customize the timeframe in the upper-right corner of the page and adjust the breakdown of the video views in the upper-right corner of each panel.
2. Individual Videos
To see the performance of individual videos, head to your Facebook Page and select “Posts” on the right column instead.
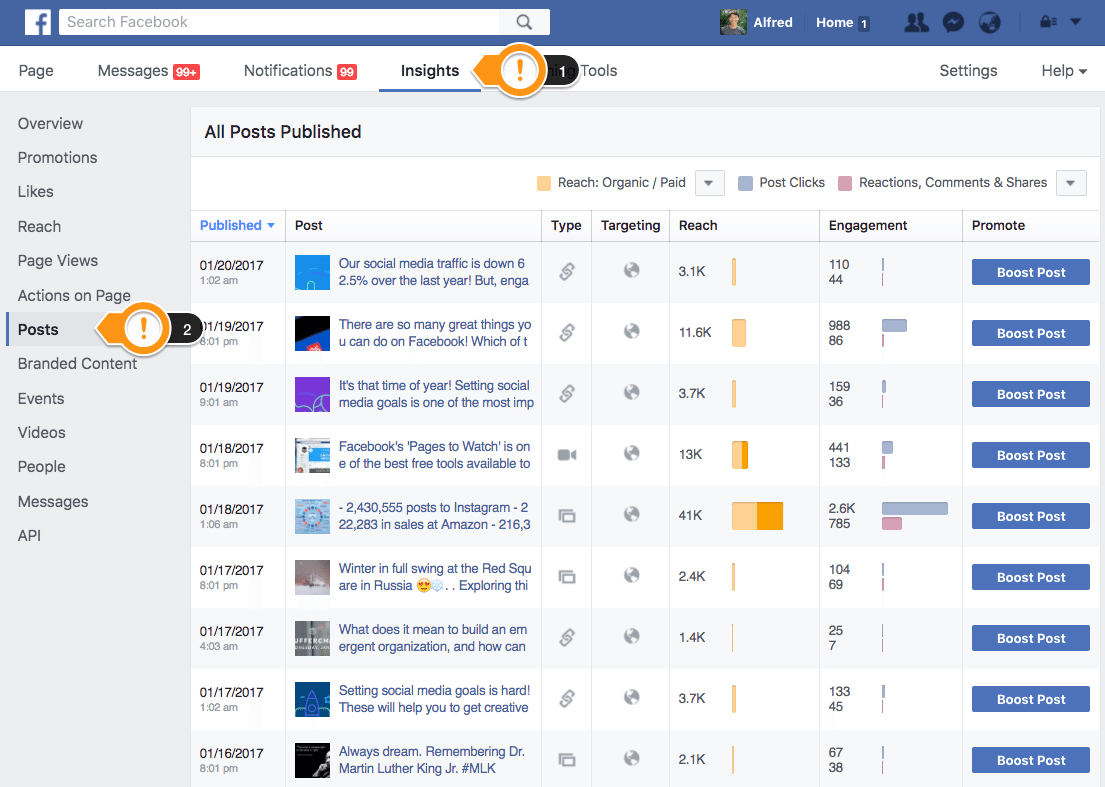
Here, you’ll find all the posts on your Facebook Page, and the video posts are easily identifiable with the video icon (

). For each post, you can see the reach and engagement level and sort the posts according to reach or engagement. For engagement level, there are four options:
- Post Clicks / Reactions, Comments & Shares
- Reactions / Comments / Shares
- Post Hides, Hides of All Posts, Reports of Spam, Unlikes of Page
- Engagement Rate

To see the detailed metrics of a video post, simply click on the title of the post. Here’s what you’ll see:
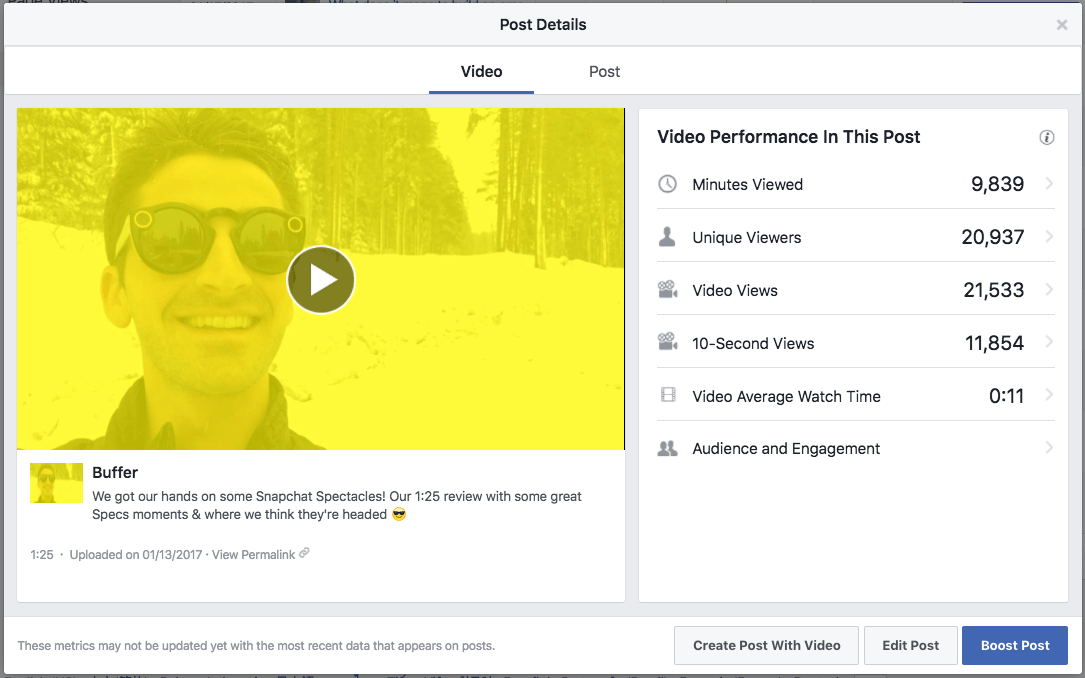
You can click on each of the metrics to see more granular performance data.
—
2. Facebook Live
Video view: 3 seconds or more
As Facebook is pushing for live videos, Facebook Live videos tend to appear higher in News Feed when they are live than when they are no longer live. It might be great to make full use of this before Facebook changes its algorithm again.
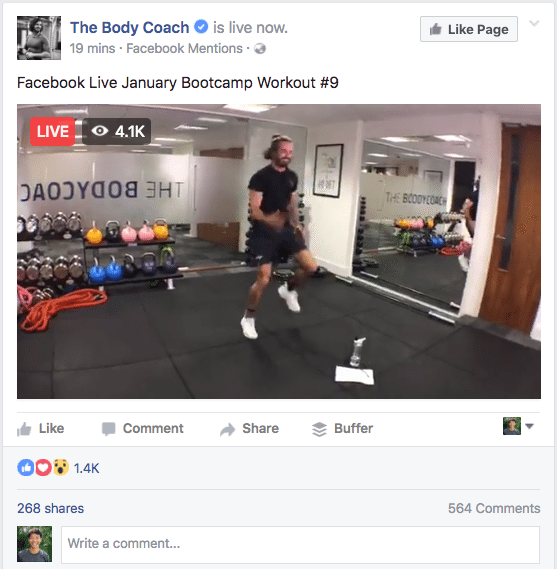
A Facebook Live post looks quite similar to a video post. The only difference is that when the video is live, there’s a red “LIVE” and a live viewer count in the upper-left corner.
Specs:
- What counts as a view? Three seconds or more
- Auto-plays? Yes
- Auto-loops? Yes (Live videos that are 30 seconds or shorter will loop continuously for approximately 90 seconds after the live-streaming ends)
- Default audio state: Muted (The sound will be on for videos in the mobile app.)
- Maximum length: 240 minutes
- Embeddable outside platform? Yes (Only after the live video ends)
- View counts for public? Yes
- View counts for owner? Yes
- Analytics dashboard for videos? Yes
Metrics available:
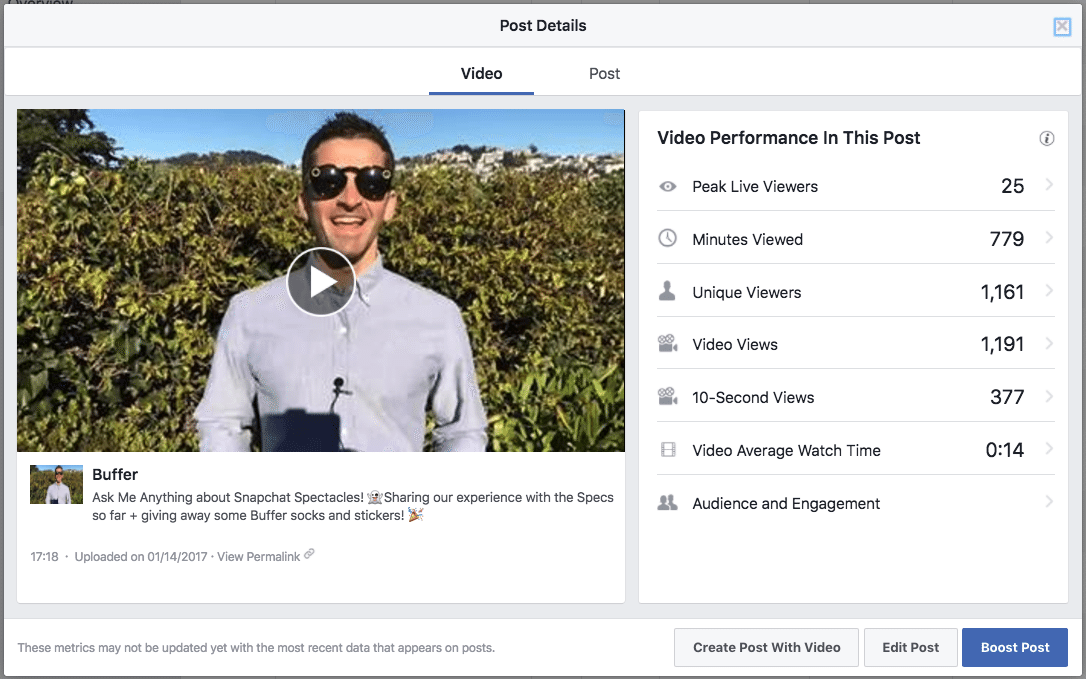
- Peak live viewers (This is an additional metric for Facebook Live videos that normal Facebook videos don’t have.)
- Minutes viewed
- Unique viewers
- Video views
- 10-Second views
- Video average watch time
- Audience and engagement (People Reached, Post Engagement, Top Audience, and Top Location)
- Facebook also provides a bunch of other metrics for the Facebook post with the video such as reactions, comments, shares, and post clicks, under “Post”.
Where to find the metrics:
The metrics of your Facebook Live videos can be found the same way as your normal Facebook videos. Head to your Facebook Page and select “Posts” on the right column.

Search for the live video you are interested in and click on its title. Facebook does not differentiate a live video from a video, and the video icon (

) is used to represent both types.
—
3. Instagram video
Video view: 3 seconds or more
NewsWhip studied the top 10 media publishers’ Instagram accounts to analyze their Instagram strategy. NewsWhip found that while photos get more likes than videos, videos sparked more comments than photos.
Here’s how an Instagram video looks like on a desktop:

Specs:
- What counts as a view? Three seconds or more (doesn’t include views from embedded posts, views from desktop, or video loops)
- Auto-plays? Yes
- Auto-loops? Yes
- Default audio state: Muted
- Maximum length: 60 seconds
- Embeddable outside platform? Yes (Here’s how!)
- View counts for public? Yes
- View counts for owner? Yes
- Analytics dashboard for videos? No
Metrics available:
- Views
- Likes (and who liked the video)
If you are using an Instagram business profile, you’ll get the following metrics as well:
- Impressions
- Reach
- Engagement
Where to find the metrics:
To see the number of views and likes, simply tap on the view count of the post.
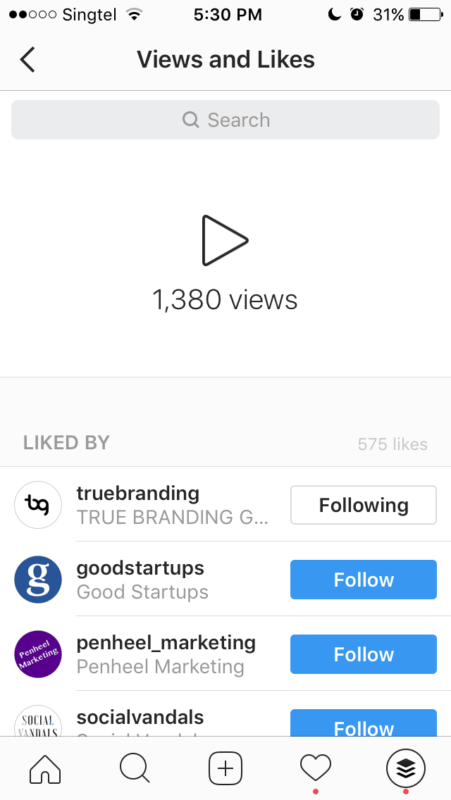
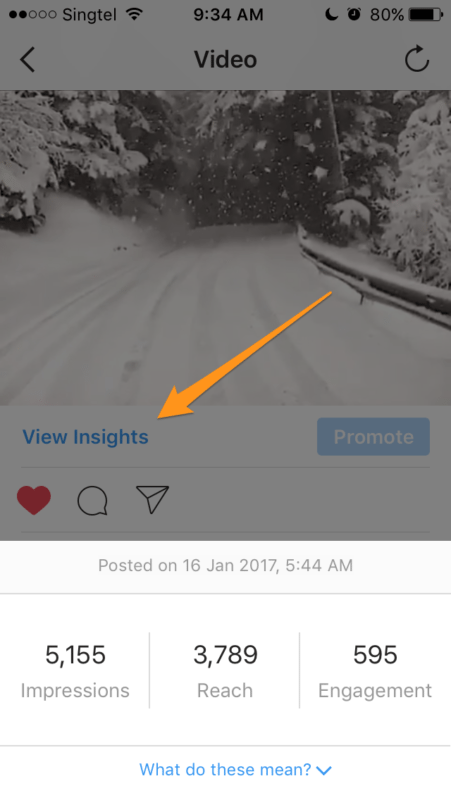
If you have a business profile on Instagram, you’ll have access to more insights. To see the number of impressions, reach, and engagement of your video, select the video you are interested in from your profile and tap on “View Insights”.
—
4. Instagram Stories
Video view: Upon opening
More than 150 million people use Instagram Stories daily. It’s a feature we love at Buffer, too. If you are interested, you can check out our Instagram Stories @buffer on Instagram!
Here’s how an Instagram story looks like:

Specs:
- What counts as a view? Upon opening the story
- Auto-plays? Yes (between stories)
- Auto-loops? No
- Default audio state: Muted
- Maximum length: 10 seconds
- Embeddable outside platform? No
- View counts for public? No
- View counts for owner? Yes
- Analytics dashboard for videos? Yes (for business profiles)
Metrics available:
- Views (and who viewed it)
If you are using an Instagram business profile, you’ll get the following metrics as well:
- Impressions
- Reach
- Engagement
Where to find the metrics:
To see the individual performance of your Instagram Stories video, open your story and swipe up on the video you are interested in.
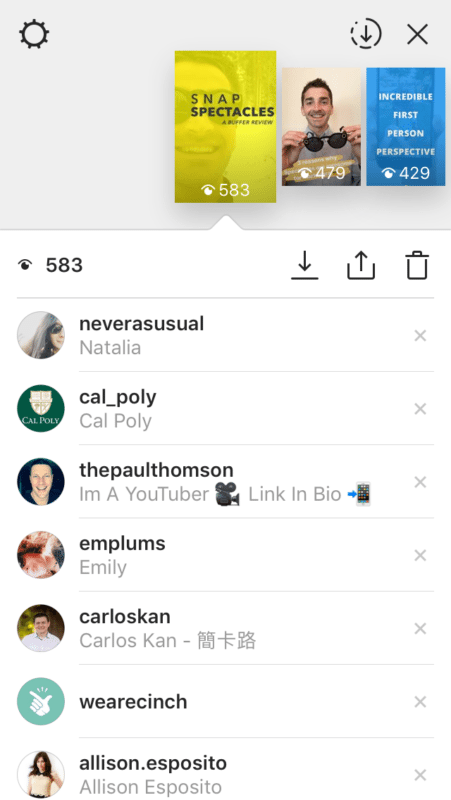
Here, you’ll see the number of views of your video and who viewed the video. Note that these metrics will only be available for 24 hours from the time the video is published.
If you have an Instagram business profile, Instagram now provides insights on Instagram Stories, too. You can see the reach, impressions, replies, and exits for each story with the Instagram Business Tools.
Here’s a short video on how to check out the insights on your Instagram stories:
—
5. Instagram Live
Video view: Once someone joins the broadcast
Following Facebook’s push for live videos, Instagram has also launched live videos last November.
Unlike Facebook Live or Periscope, Instagram live videos are not viewable or saved after the live-streaming has ended. Hence, Instagram sends your followers a notification whenever you go live.

Specs:
- What counts as a view? Once someone joins the broadcast
- Auto-plays? No
- Auto-loops? No
- Default audio state: Muted
- Maximum length: 60 minutes
- Embeddable outside platform? No
- View counts for public? Yes (Number of live viewers)
- View counts for owner? Yes (Number of live viewers)
- Analytics dashboard for videos? No
Metrics available:
- Live viewers at any given time
- Viewers
Where to find the metrics:
The number of live viewers is shown in the upper-left corner of the screen when you go live:

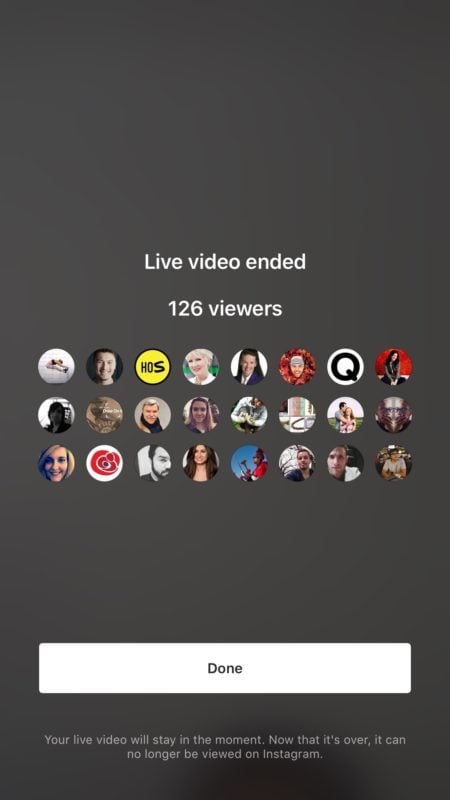
When you end your live video, Instagram will tell you the number of viewers who have watched any part of your live video.
—
6. Snapchat Stories
Video view: Upon opening
More than 10 billion Stories are watched on Snapchat every day. This number would likely have increased with the launch of Spectacles as more people use Snapchat to share their daily experiences.

Specs:
- What counts as a view? Upon opening the snap
- Auto-plays? Yes (between snaps of a Story)
- Auto-loops? No
- Default audio state: On
- Maximum length: 10 seconds
- Embeddable outside platform? No (But there’s a third party app that allows you to do so.)
- View counts for public? No
- View counts for owner? Yes
- Analytics dashboard for videos? No
Metrics available:
- Views (and who viewed the snap)
- Screenshots (and who took a screenshot of the snap)
Where to find the metrics:
Getting analytics for your snaps is still a little tricky at the moment as Snapchat does not provide any native analytics. For now, tools like Snaplytics could be helpful if you have the budget for it.
Otherwise, manually collecting the data from each of your snaps is workable, too! Open one of your snaps and swipe up.

(Image by snapchat download)
The number below the eye symbol represents the number of people who have viewed that snap while the number below the overlapping arrows symbol represents the number of people who have taken a screenshot of that snap.
The names in white are the people who have viewed that snap, and the names in green are the people who have viewed and taken a screenshot of the snap. If many people have viewed your snap (yay!), the list might not display all the names.
—
7. Twitter video
Video view: 3 seconds or more
According to Ameet Ranadive, Twitter’s VP revenue product, videos are 6X more likely to be retweeted than photos and 3X more likely than GIFs.
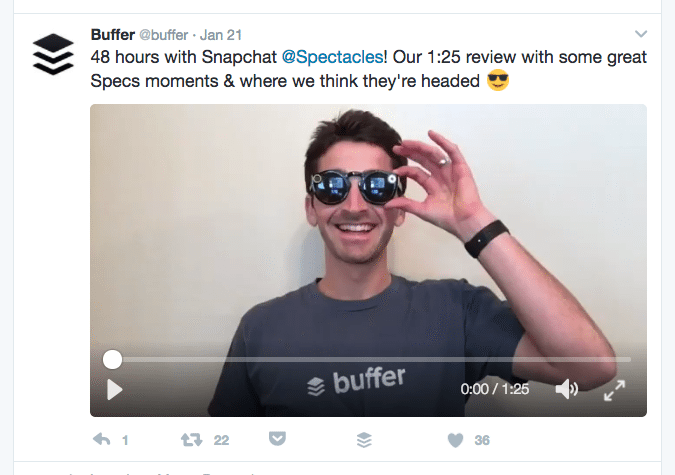
Here’s how a native Twitter video looks like on the Twitter feed:
Specs:
- What counts as a view? Three seconds or more
- Auto-plays? Yes
- Auto-loops? Yes (Videos that are 6.5 seconds or shorter will automatically loop.)
- Default audio state: Muted
- Maximum length: 140 seconds
- Embeddable outside platform? Yes (Here’s how!)
- View counts for public? No
- View counts for owner? Yes
- Analytics dashboard for videos? Yes (in beta)
Metrics available:
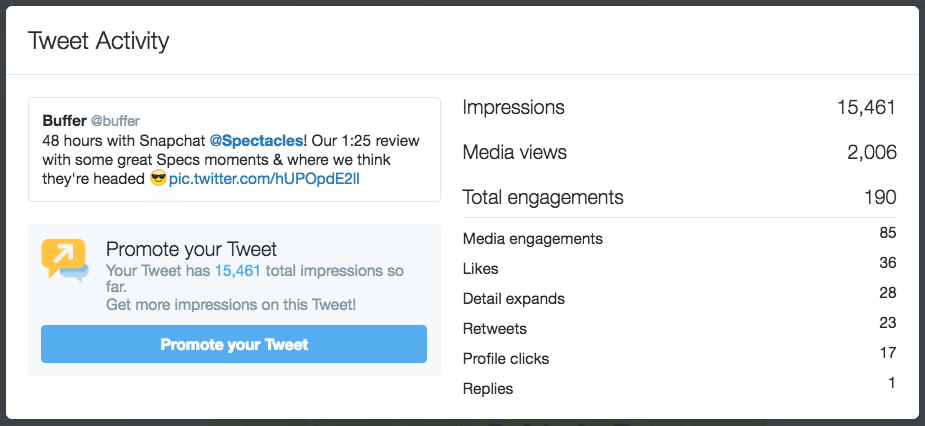
- Impressions
- Media views
- Total engagements (e.g. media engagements, likes, detail expanded, etc.)
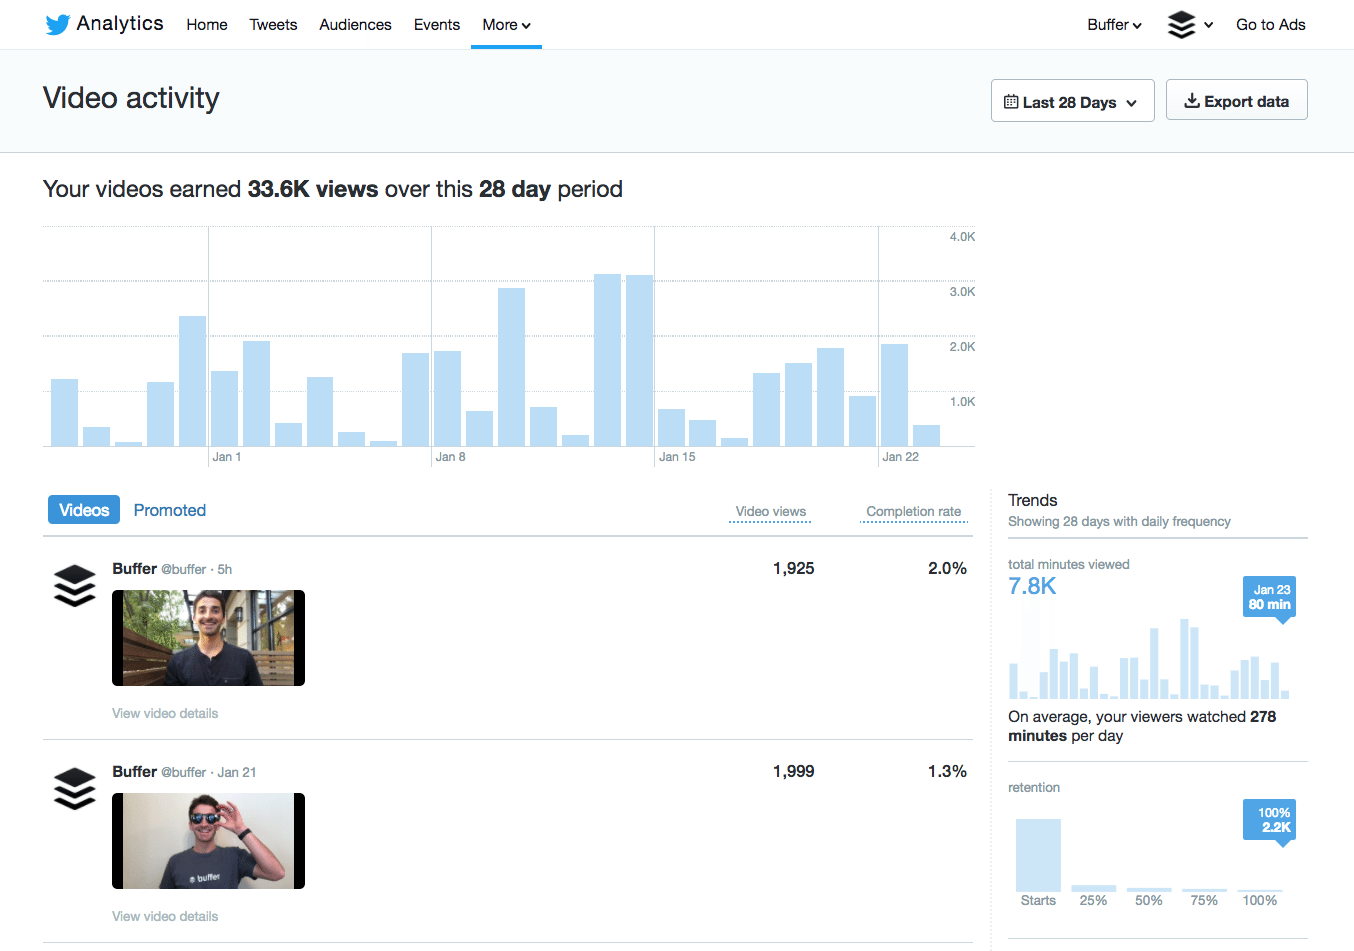
- Video views
- Completion rate (i.e. Total number of completed views divided by total number of video starts)
Where to find the metrics:
To find out the number of impressions, media views, and engagement for each video, click on the graph icon (i.e. View Tweet activity) on the tweet.
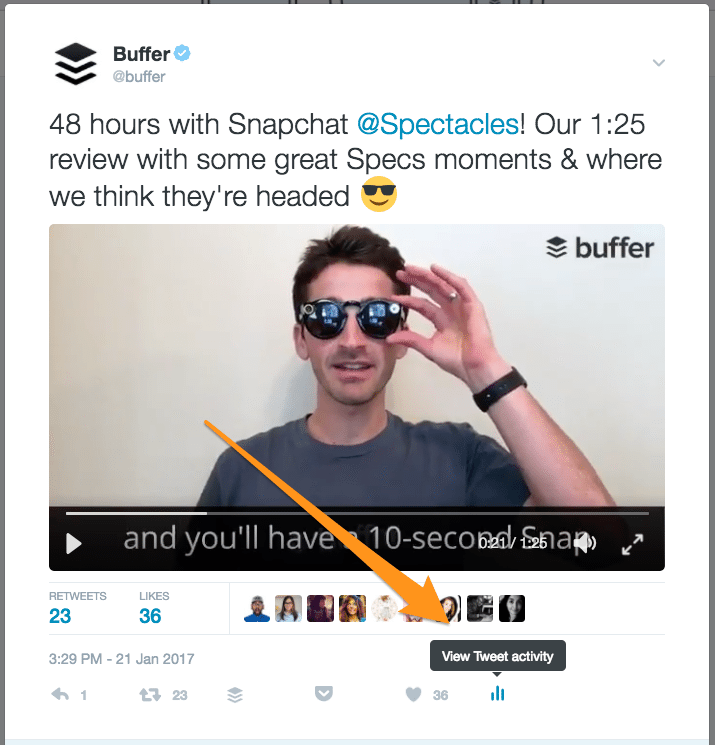
Here’s an example of what you’ll see:
To see the number of views and completion rate of your videos, visit your Twitter analytics’ video section. Here are the quick steps to get there:
- Click on your profile photo on the upper-left corner of the page.
- Select “Analytics”.
- Select “More” on the top navigation bar of the analytics page.
- Select “Video (beta)”.
—
8. Periscope
Video viewer: Someone that presses play, joins a broadcast, or watches at least 3 seconds of an auto-played video
Periscope is probably the first live-streaming app from any of the major social media platforms. After Twitter acquired the company, Periscope has been integrated into the Twitter app. You can view and create live videos from within the Twitter app.
Here’s how a Periscope looks like in Twitter:
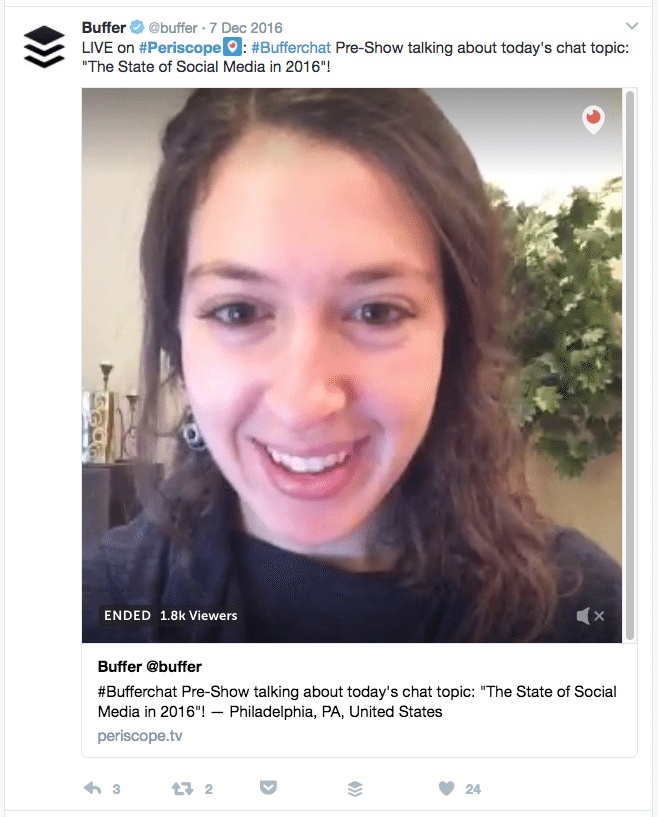
Specs:
- What counts as a viewer*? Someone that presses play, joins a broadcast fullscreen, or watches at least three seconds of an auto-played video. Replay viewers are considered as viewers, too. (*: Periscope counts (individual, unique) viewers, instead of views. For a more detailed explanation about viewership metrics, check out this article by Periscope.)
- Auto-plays? Yes for live broadcasts on Twitter feed (Replays do not auto-play.)
- Auto-loops? No
- Default audio state: Muted
- Maximum length: No time limit
- Embeddable outside platform? The tweet for the Periscope is embeddable outside Twitter. (Here’s more.)
- View counts for public? Yes (Number of live views and replays)
- View counts for owner? Yes (Number of live views and replays)
- Analytics dashboard for videos? No
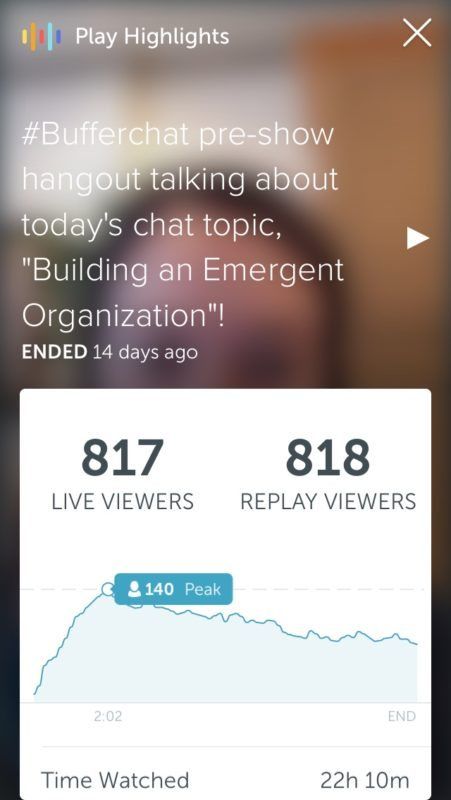
Metrics available:
- Live viewers
- Replay viewers
- Time watched (Total, per viewer, and per broadcast minute)
- Duration
- Comments received
Where to find the metrics:
You can find the metrics of individual videos through the mobile app. Here are the steps:
- Tap on the “People” icon (the first icon from the right).
- Tap on the profile icon in the upper-right corner of the app.
- Scroll down and tap on “Broadcasts”.
- Tap on the broadcast that you are interested in.
Here’s an example of what you’ll see:
—
9. YouTube
Video view: Determined by an algorithm
400 hours of videos are uploaded onto YouTube every minute. People watch hundreds of millions of hours on YouTube and generated billions of views every day.
While YouTube might not exactly be a social media platform, it is the default video hosting platform for most people.

Specs:
- What counts as a view? An algorithm is used to determine if a view is genuine. (If you are interested in finding out more, here’s an interesting Quora thread on this.)
- Auto-plays? Yes (After a video ends, a suggested video will automatically play.)
- Auto-loops? No
- Default audio state: On
- Maximum length: 15 minutes (If you are verified, you can upload files of size up to 128 GB.)
- Embeddable outside platform? Yes
- View counts for public? Yes
- View counts for owner? Yes
- Analytics dashboard for videos? Yes
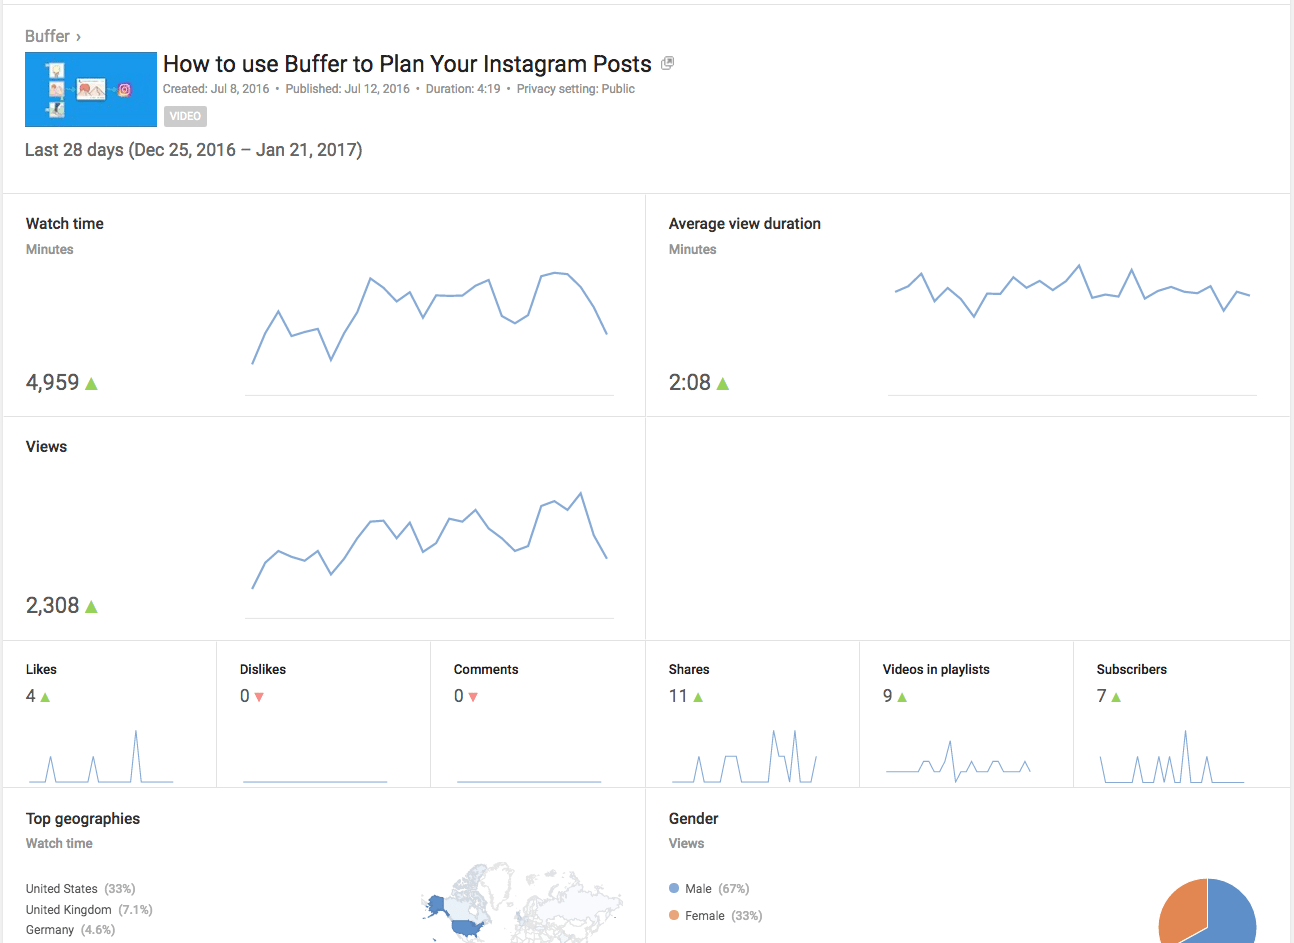
Metrics available:
- Watch time
- Views
- Average view duration
- Likes and dislikes
- Comments
- Shares
- Videos in playlists
- Subscribers
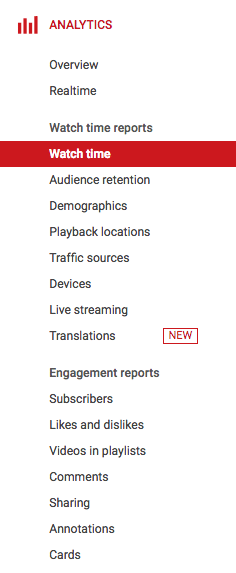
- Audience Retention
- Demographics (Age, gender, and geography)
- Traffic sources
- Playback locations
Where to find the metrics:
All the metrics are located within the YouTube Creator Studio analytics section. Here’s how to get there:
- Click on your profile photo in the upper-right corner of the page.
- Click on “Creator Studio”.
- Click on “Analytics” on the left sidebar.
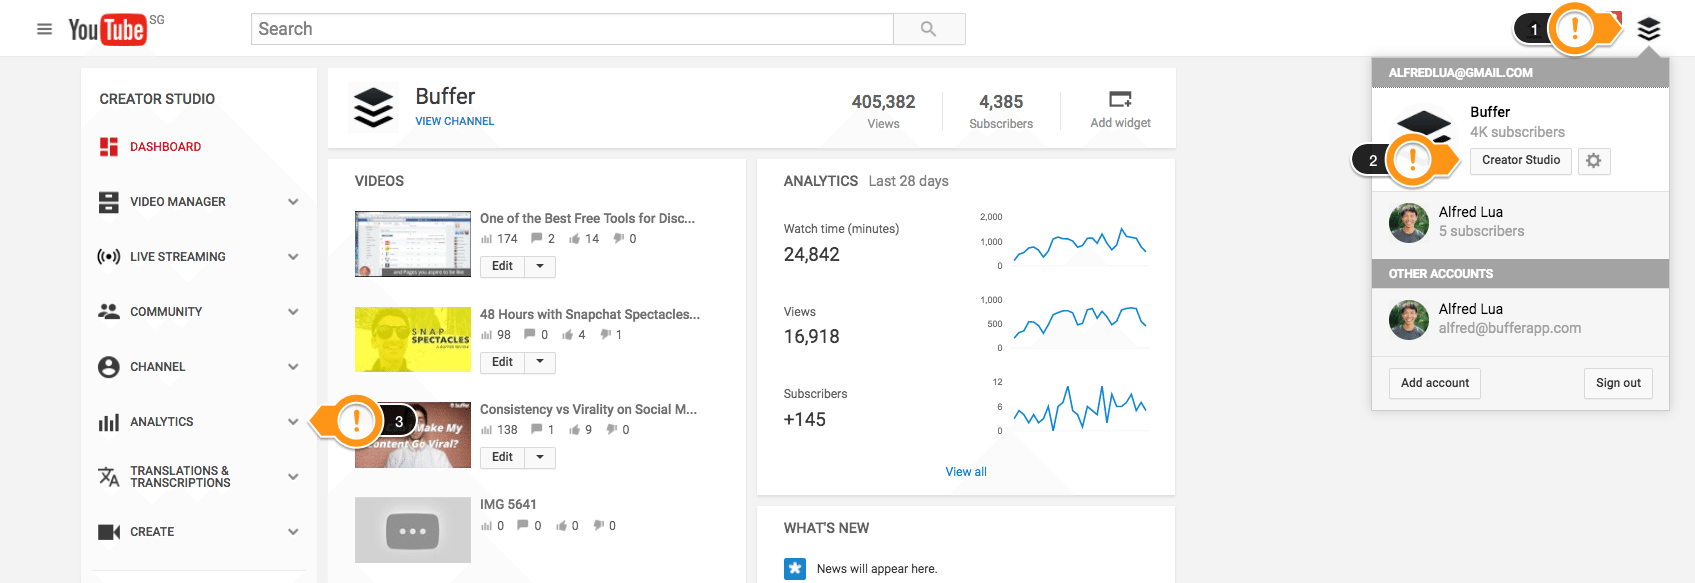
To see the metrics for individual videos, click on “Browse all content”, which is beside “Top 10 Videos”, and select a video. Here’s an example of what you’ll see:
You can also see more granular data by selecting the various reports on the left column after selecting a particular video.
—
How to create your own metrics
While each social media platform provides several metrics natively, you don’t have to stick to them. You can also combine two or more of them to create metrics that are helpful for your measurement.
For example, Snapchat only provides the number of views and screenshots per snap. By dividing the number of people who have viewed the last snap of your story with the number of people who have viewed the first snap of your story, you can get the completion rate of your story (i.e. the percentage of your followers who view all the snaps in your story). This can be used for Instagram Stories as well.
For Instagram, you could add up the views of all your videos within a month and divide it by the number of videos uploaded that month to get the average number of views.
This helps to ensure that the metrics you are measuring are relevant to your social media goals, instead of similar what’s provided by the social media platform.
Over to you: What is your favorite type of video?
Video marketing on social media is on the rise, and we think there are a lot of opportunities with social videos in 2017 and beyond.
What is your favorite type of video among those listed above? What level of engagement have you been seeing from your social videos?
It’d be great to hear from you! Thanks.
—
Updated Feb 9, 2017: Thanks, Liz from Periscope, for pointing out my error with Periscope viewership metrics.
Updated Mar 9, 2017: Facebook videos on the News Feed in the mobile app will now autoplay with the sound on if your phone is not on silent mode.
Try Buffer for free
190,000+ creators, small businesses, and marketers use Buffer to grow their audiences every month.


