
At Buffer, we don’t just write about social media — we study it.
This living resource curates every original data report we've published, from platform-specific trends to posting strategies that actually work.
Whether you're a creator, marketer, or small business owner, these insights can help you make smarter content decisions backed by real numbers.
Key points to note
Before diving into the numbers, here are a few important notes to keep in mind:
- Engagement ≠ Total Volume: A high engagement rate doesn’t always mean more total interactions. For example, LinkedIn may have a higher engagement rate, but Instagram often drives far more total views and interactions due to its larger reach.
- Different platforms, different behaviors: A “like” on Threads doesn’t carry the same weight as a “save” on Instagram or a “share” on LinkedIn. Each platform rewards and surfaces content differently, and user intent varies.
- Not all engagement is visible: Many platforms now prioritize private signals like DMs, shares, and saves, meaning some of the most meaningful engagement isn’t reflected in public metrics.
- Algorithms are always changing: These studies reflect a snapshot in time (usually over a 6–12 month period). Platform algorithms evolve quickly, so trends may shift, especially after major feature or ranking updates.
- Consistency affects everything: Across nearly every study, one pattern holds: creators who post consistently (especially weekly) tend to outperform sporadic posters, regardless of platform or format.
- Correlation ≠ causation: Just because a format (like long-form TikToks) performs well on average doesn’t mean every long video will outperform a short one. These are trends, not guarantees.
- Buffer’s dataset reflects the activities of Buffer users: All data is based on activity from Buffer-connected accounts — primarily small businesses, creators, and marketing teams.
Some important definitions and formulas
Here are some terms you’ll run into throughout this page and what they mean.
→ The percentage of people who interacted with your post out of the total who saw it.
How we calculate engagement rate:
(Total Interactions ÷ Total Impressions) × 100
Average
→ The sum of all engagement rates divided by the number of posts. Helpful for comparing platform performance overall.
Median
→ The “middle” value in a list of engagement rates. It removes outliers and gives a clearer picture of typical performance over time.
Reach
→ The number of unique users who saw your post — one of the best indicators of how far your content traveled.
Watch time
→ The total time people spent watching your video. For TikTok, YouTube Shorts, and Reels, this is often more important than views or likes.
Post consistency
→ How often you post over a given time period. In our studies, “consistent” typically means posting at least once a week for 5+ weeks.
Engagement benchmarks and posting behavior
These reports will help you understand what’s normal on social media — and what it takes to stand out.
What’s a good engagement rate on social media in 2025?
To determine where users are engaging the most, we analyzed average and median engagement rates across eight major social platforms over a full year.
The findings reveal not just which platforms perform best, but how engagement is shifting over time — and what that means for your content strategy.
Platform-wide average engagement rates
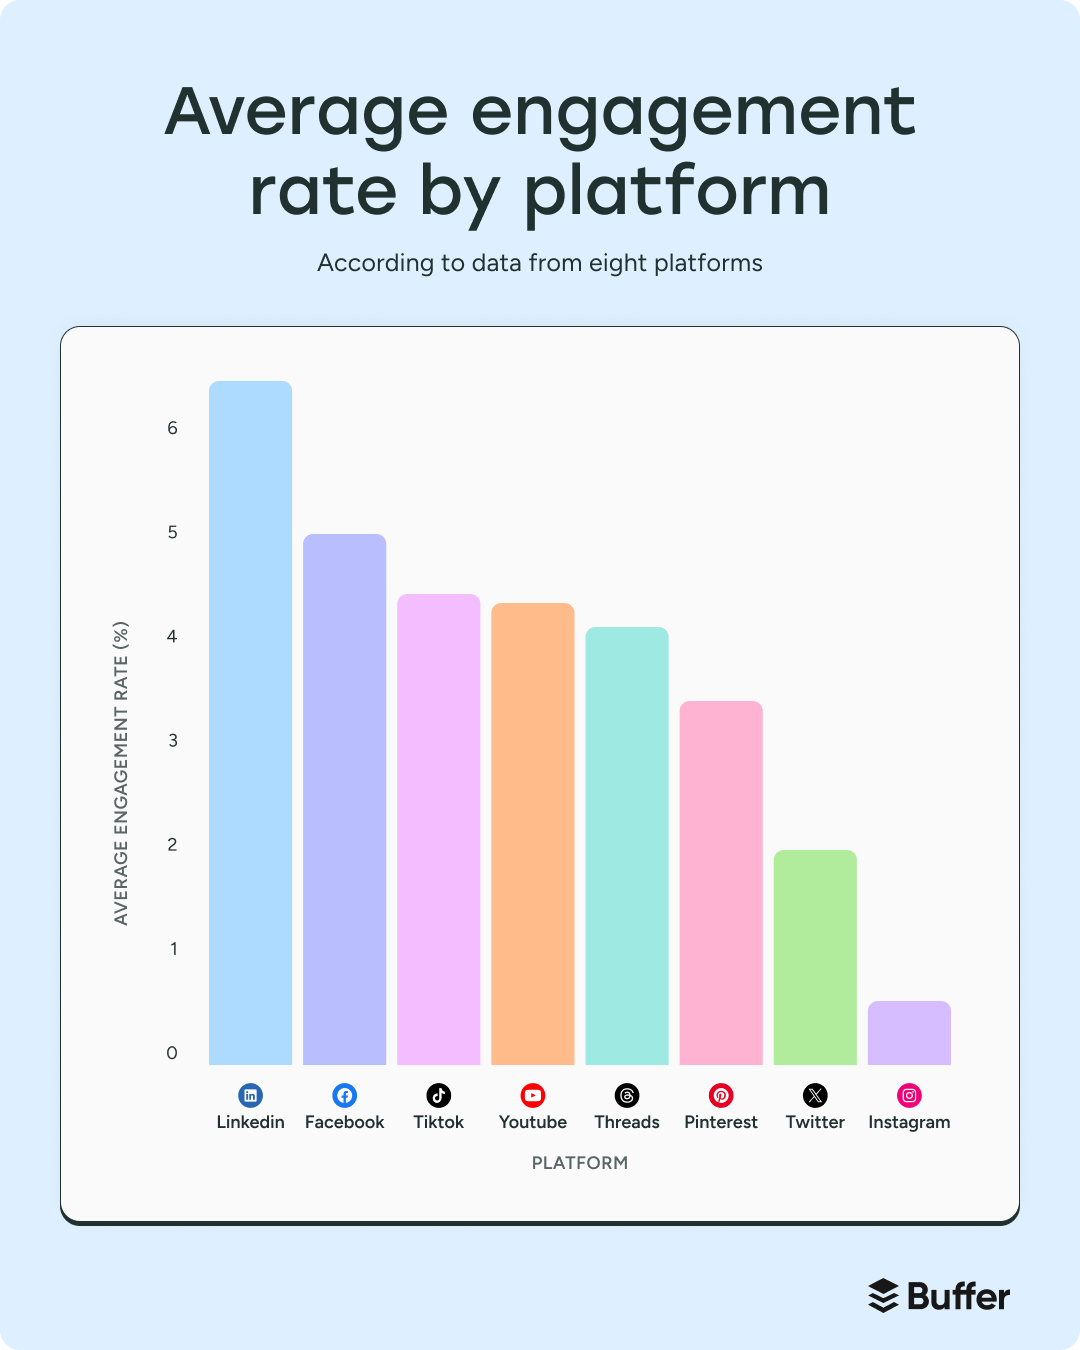
We checked for average engagement first, which helps us compare platforms at a high level, showing where engagement is strongest overall.
This snapshot reveals where content tends to get the most traction overall — and where high visibility doesn’t always translate to high engagement.
So, in ranking order:
- LinkedIn: 6.50%
- Facebook: 5.07%
- TikTok: 4.86%
- Threads: 4.51%
- YouTube Shorts: 4.41%
- Pinterest: 3.46%
- X/Twitter: 2.31%
- Instagram: 1.16%
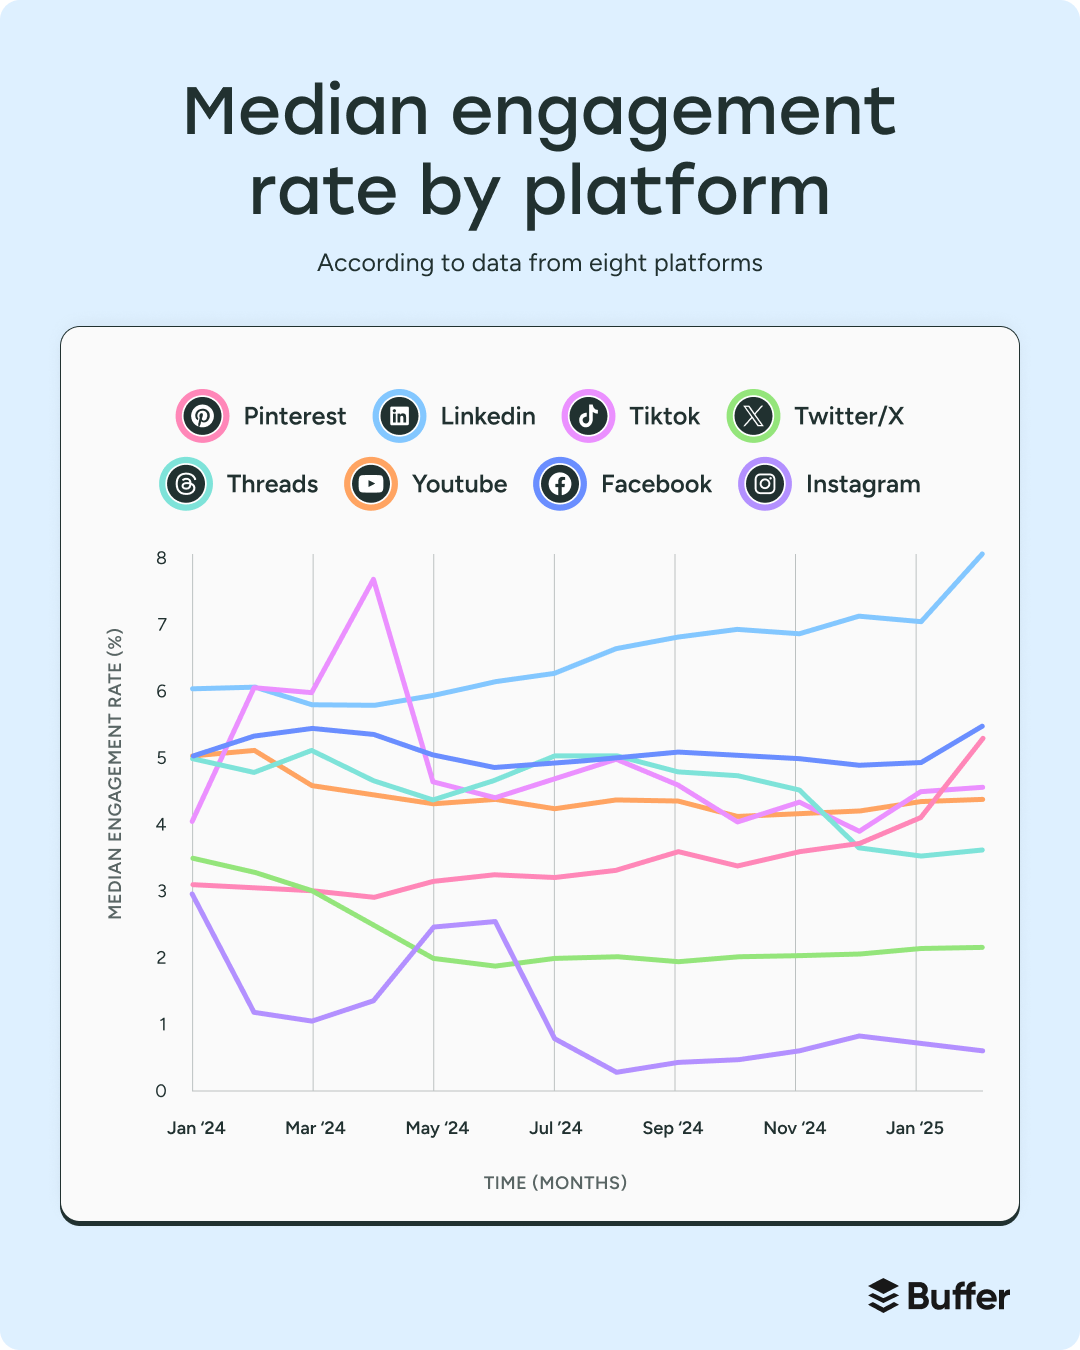
Median engagement trends from Jan 2024 – Jan 2025
Of course, averages can be skewed by a few viral hits. That’s why we also looked at median engagement over time — to understand what the average creator is experiencing month to month.
We found that some platforms are rising, others are holding steady, and a few are clearly slipping.
- LinkedIn: rose from 6.00% → 8.01%
- Instagram: dropped from 2.94% → 0.61%
- Threads: decreased from 4.76% → 3.60%
- TikTok: slid from 5.14% → 4.56%
- YouTube Shorts: climbed from 3.95% → 4.71%
- Pinterest: jumped from 3.08% → 5.26%
- Facebook: steadied around 5.45%
- X/Twitter: declined from 3.47% → 2.15%
📌 What does the data mean for you?
These numbers aren’t just for comparing platforms — they tell a story about where attention is moving, how users are engaging, and what kind of content each platform now rewards.
LinkedIn is now the strongest platform for organic engagement, climbing to an 8% median — a huge opportunity for thought leaders. Threads started strong and still beats X, but engagement is beginning to normalize as the platform matures. X/Twitter is declining — the lowest median and average engagement of any platform studied.
Instagram’s public engagement is dropping fast, but that doesn’t mean users aren’t interacting. DMs, shares, and saves may be growing behind the scenes. TikTok still performs well, but watch time is overtaking likes and comments as the key signal of success. YouTube Shorts is a rising star, with median engagement trending up month over month.
Pinterest is quietly outperforming more talked-about platforms, especially for evergreen content. Meanwhile, Facebook remains consistent, driven in part by active Groups and local communities.
The power of consistency
We looked at over 100,000 Buffer users across a 26-week period to answer one question:
Does posting consistently really make a difference?
Short answer — yes. A big one.
Key findings:
What happens when you show up week after week? Creators who posted at least once a week for 20+ weeks saw 450% more engagement per post than those who posted fewer than five times across the same period.
→ Just five months of consistent weekly posting = 4.5× more engagement per post.
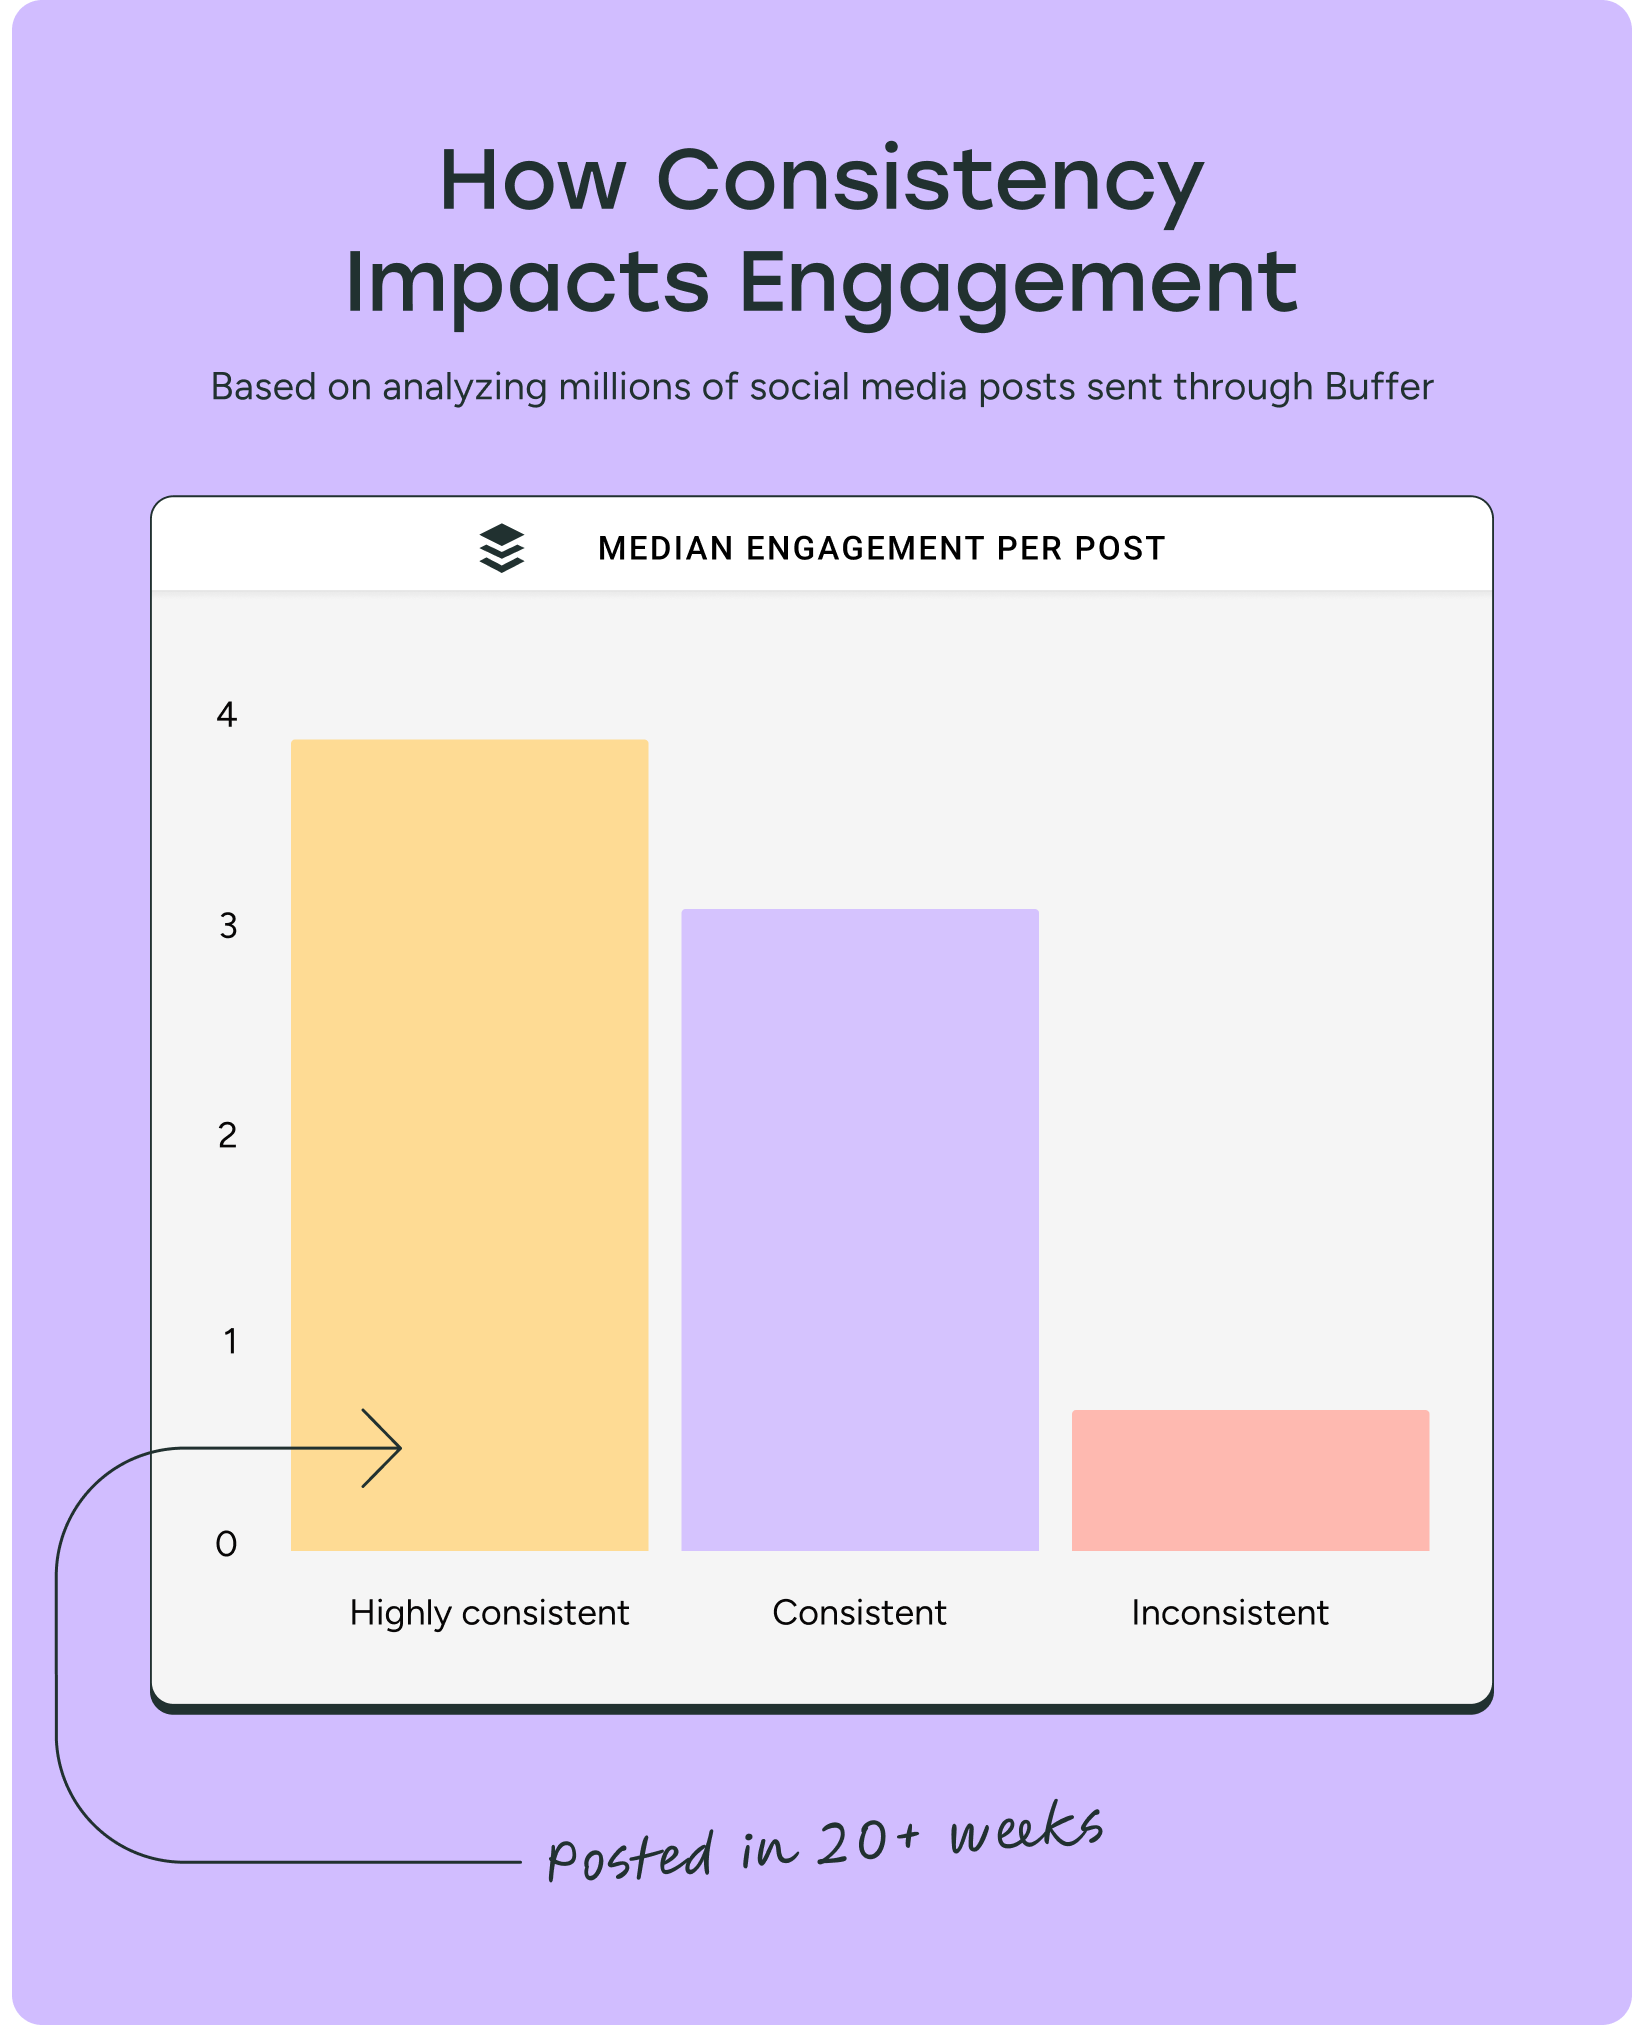
Even creators who posted consistently for just 5–19 weeks earned 3.4× more engagement than the least consistent group. Showing up just one month more than usual can meaningfully shift your results.
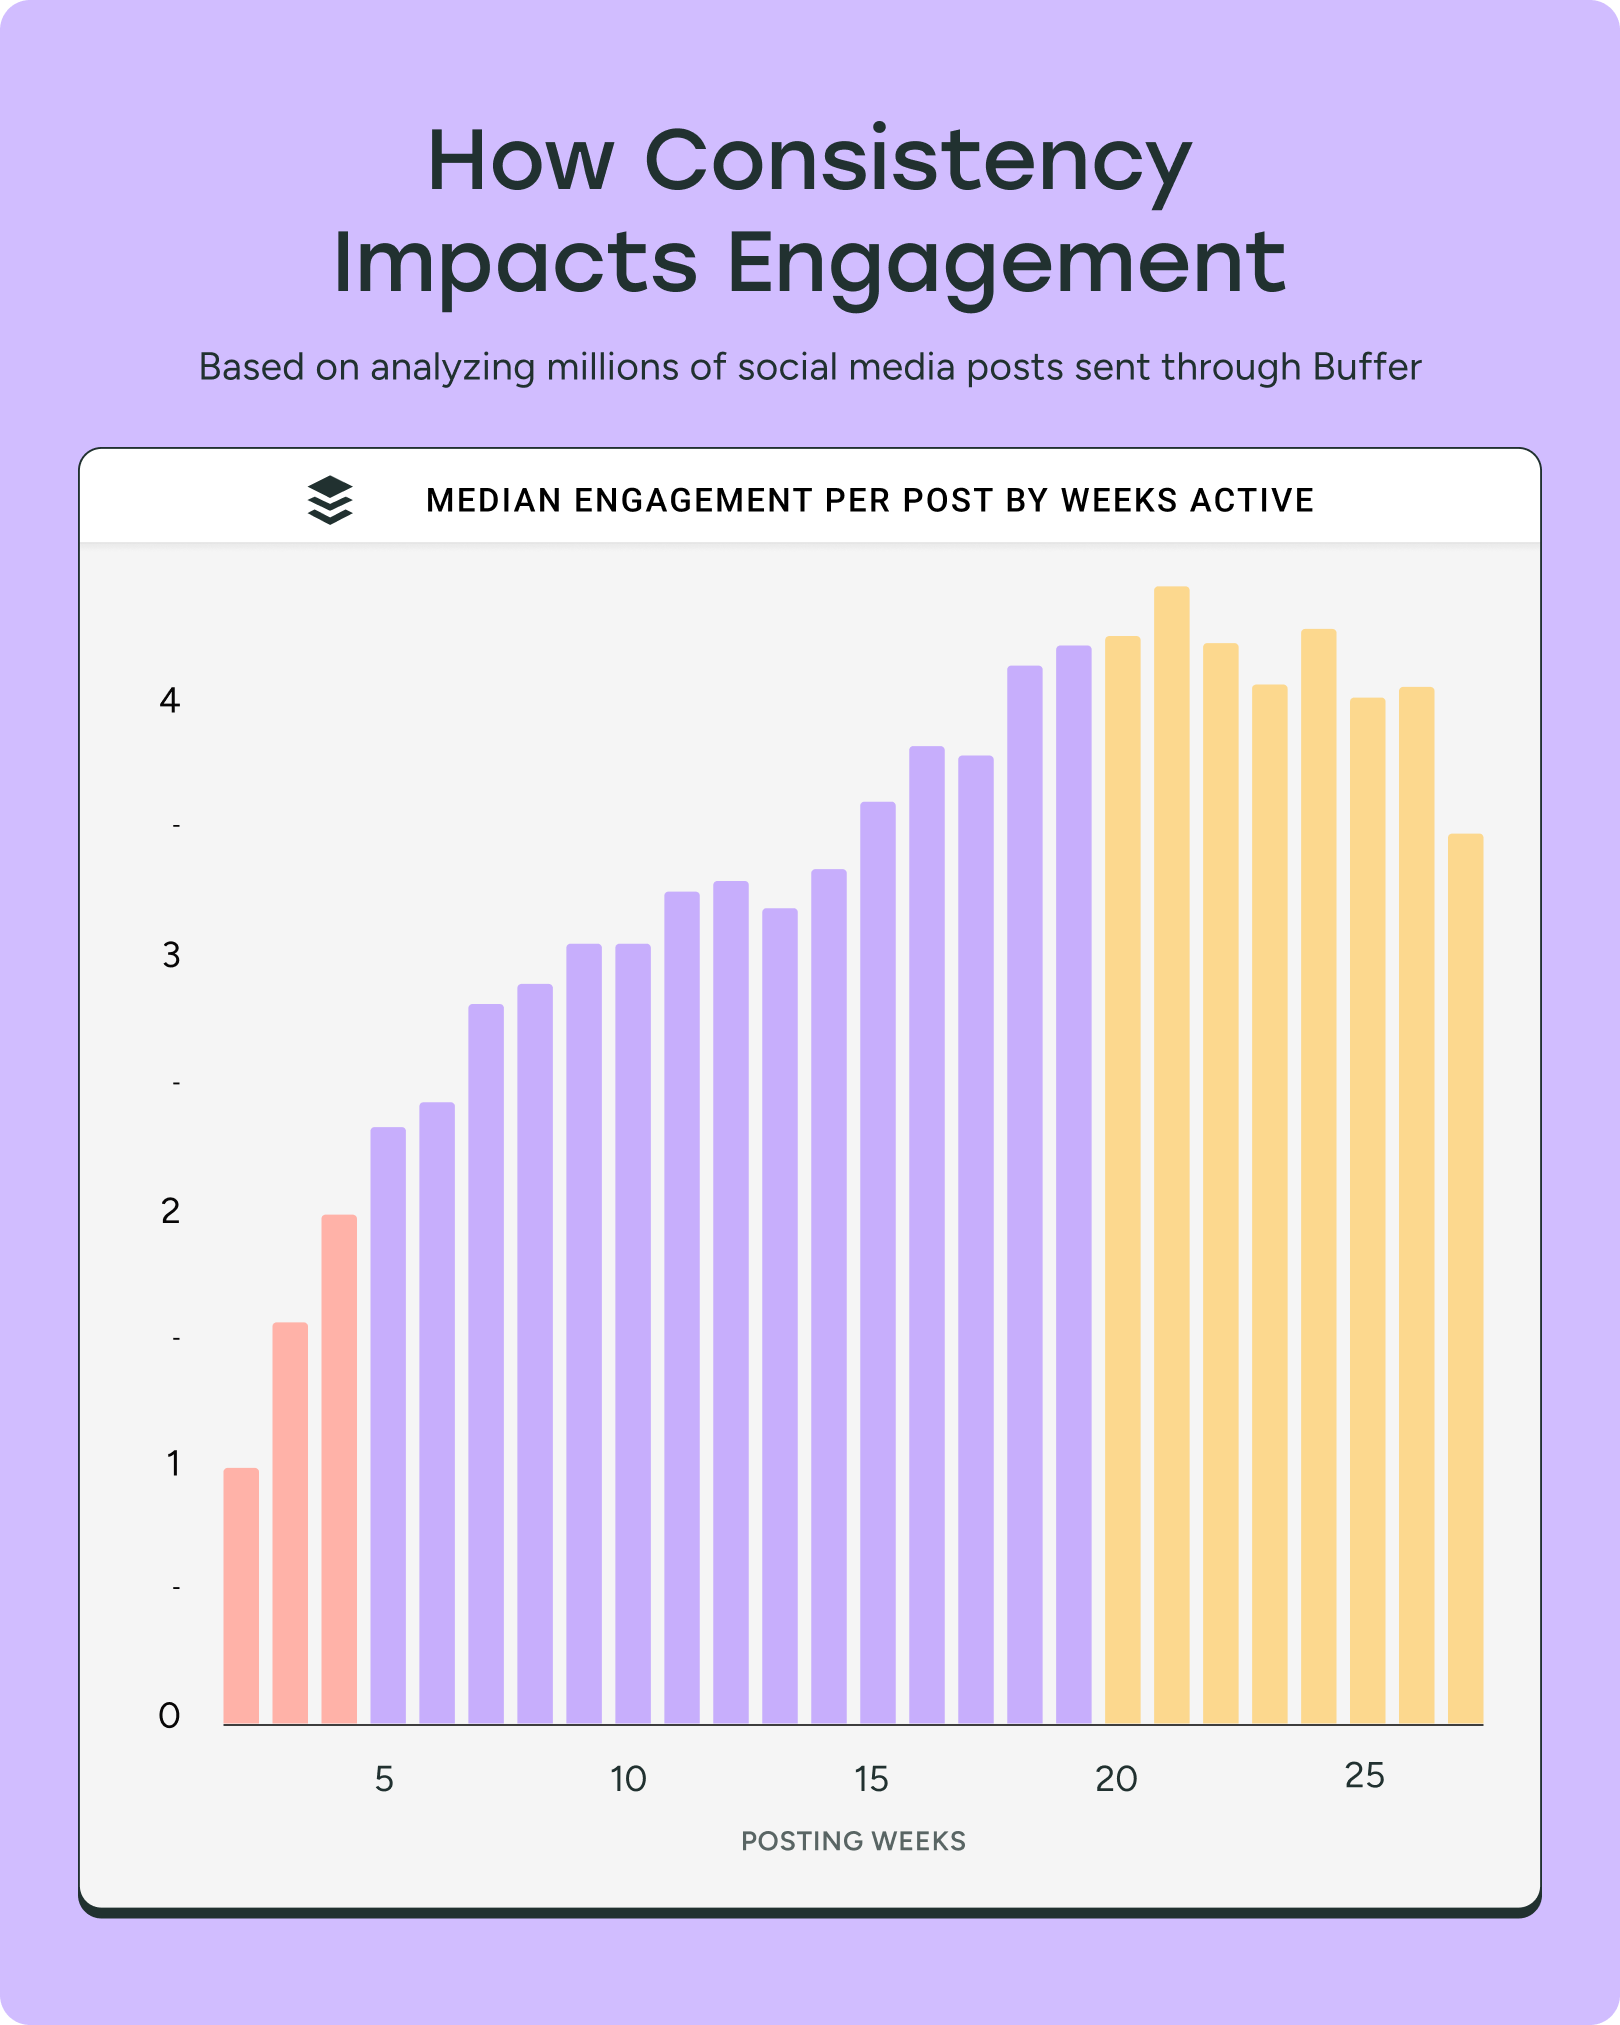
Engagement peaked around the 21-week mark, with a median of 4.47 interactions per post. After that, returns began to level off — a sign that consistency matters more than volume.
This pattern held across platforms — whether it was Threads, Instagram, or LinkedIn. It’s not about going viral once. It’s about building predictable engagement over time.
📌 What does the data mean for you?
Consistency compounds. If you’re looking for one high-impact habit to build, make it this: post once a week, every week.
Even short posts. Even if it’s not perfect. The results are clear — frequency breeds familiarity, and familiarity builds engagement.
📚 Resources to help you post consistently
- 4 Tips for Consistently Generating High-Quality Social Media Content for Your Small Business
- 5 Tips That Made Me A Consistent Content Creator
- 7 Simple Habits to Help You Get Better at Creating Content More Consistently
Do AI-assisted posts perform better or worse?
So far, we’ve seen how engagement rates and consistency shape performance. But what about how the content gets made — and whether AI can help?
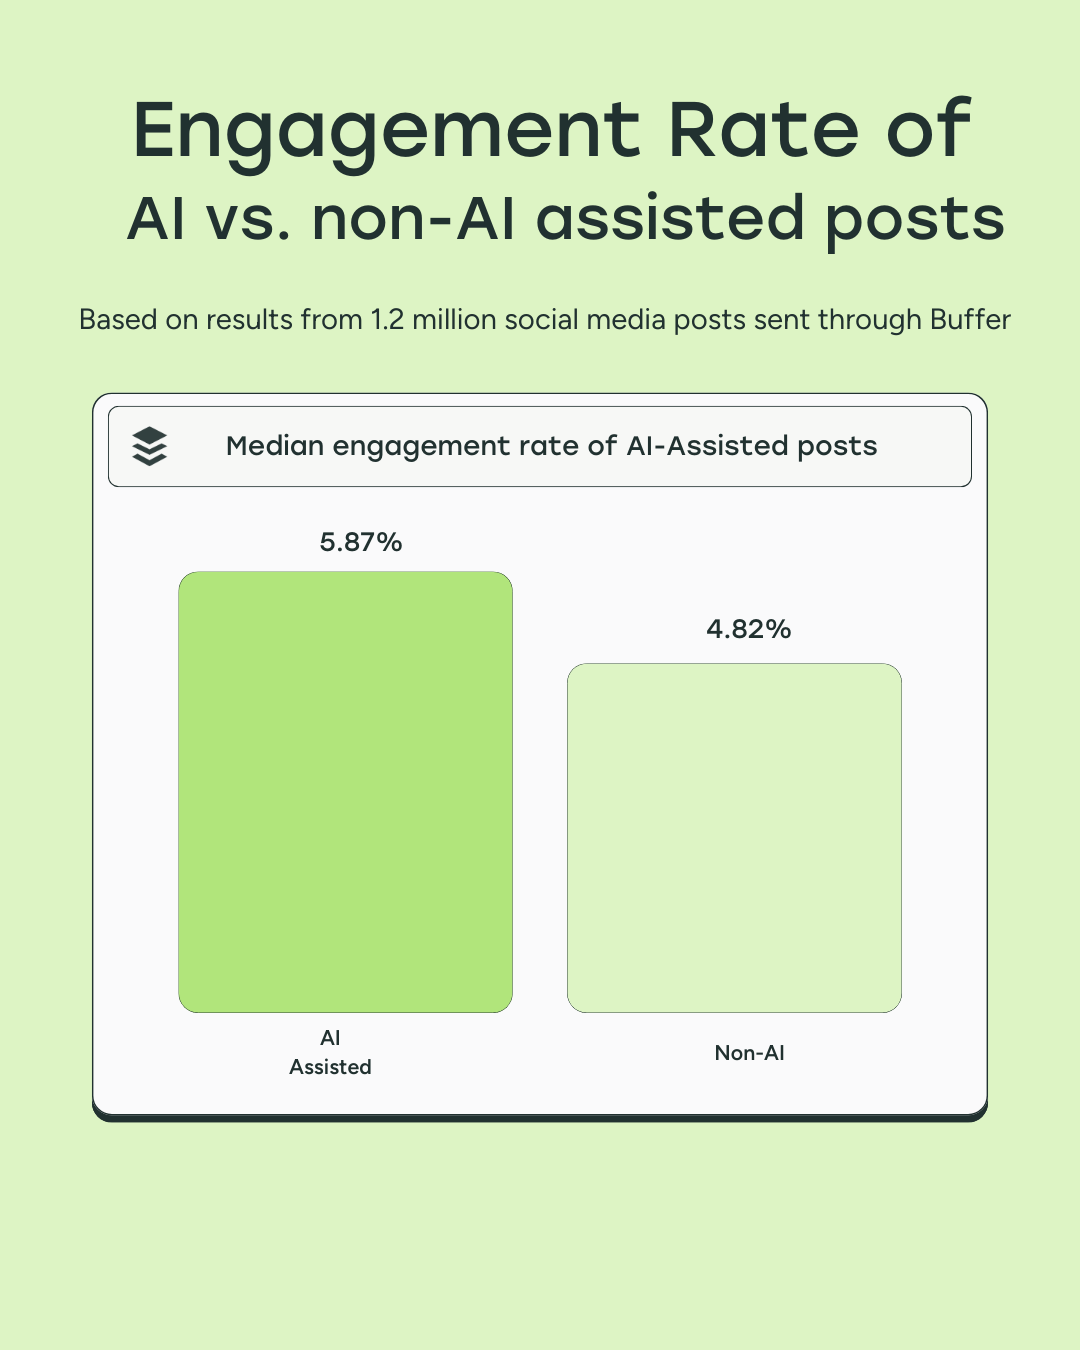
To understand how AI is shaping content performance, we analyzed 1.2 million posts across six major platforms — comparing posts written entirely by humans to those created with help from Buffer’s AI Assistant.
Spoiler: AI didn’t just help people write faster. It also helped them post smarter — and more often.
Key findings:
AI-assisted content saw ~22% more engagement than non-AI-assisted posts.
The median engagement rate jumped from 4.82% to 5.87% when AI was used — a meaningful 22% boost.
Platform-level gains ranged from +5% on YouTube to +100% on Threads, showing that some platforms benefit more from AI-written formats than others.
But this wasn’t just about writing style — creators using AI also posted more often and refined their content faster, which contributed to stronger performance.
📌 What does the data mean for you?
AI isn’t magic — but it is momentum.
Tools like Buffer’s AI Assistant can help you get past the blank page faster, test out new angles, and stay consistent.
These small productivity gains stack up. Better hooks, clearer formatting, and stronger CTAs can all contribute to higher engagement — even if the post was your idea from the start.
In short? AI can help you publish more of your best work — more often. And as AI tools become more embedded in everyday workflows, the line between 'AI-assisted' and 'human-created' will blur — but the goal remains the same: showing up consistently with content that connects.
📚 Resources to boost your AI toolkit
- The 7 Best AI Video Generators for Creators and Marketers, Tried and Tested
- The 9 Best AI Image Generators of 2025 (+ Examples)
- How I Use AI Writing Tools as a Content Writer
- 17 Must-Try AI Social Media Content Creation Tools in 2025
Platform-specific insights
Get the edge on each platform with unique performance and usage patterns.
Do longer TikTok videos get more views?
Everyone talks about TikTok as a short-form platform — but the data tells a different story.
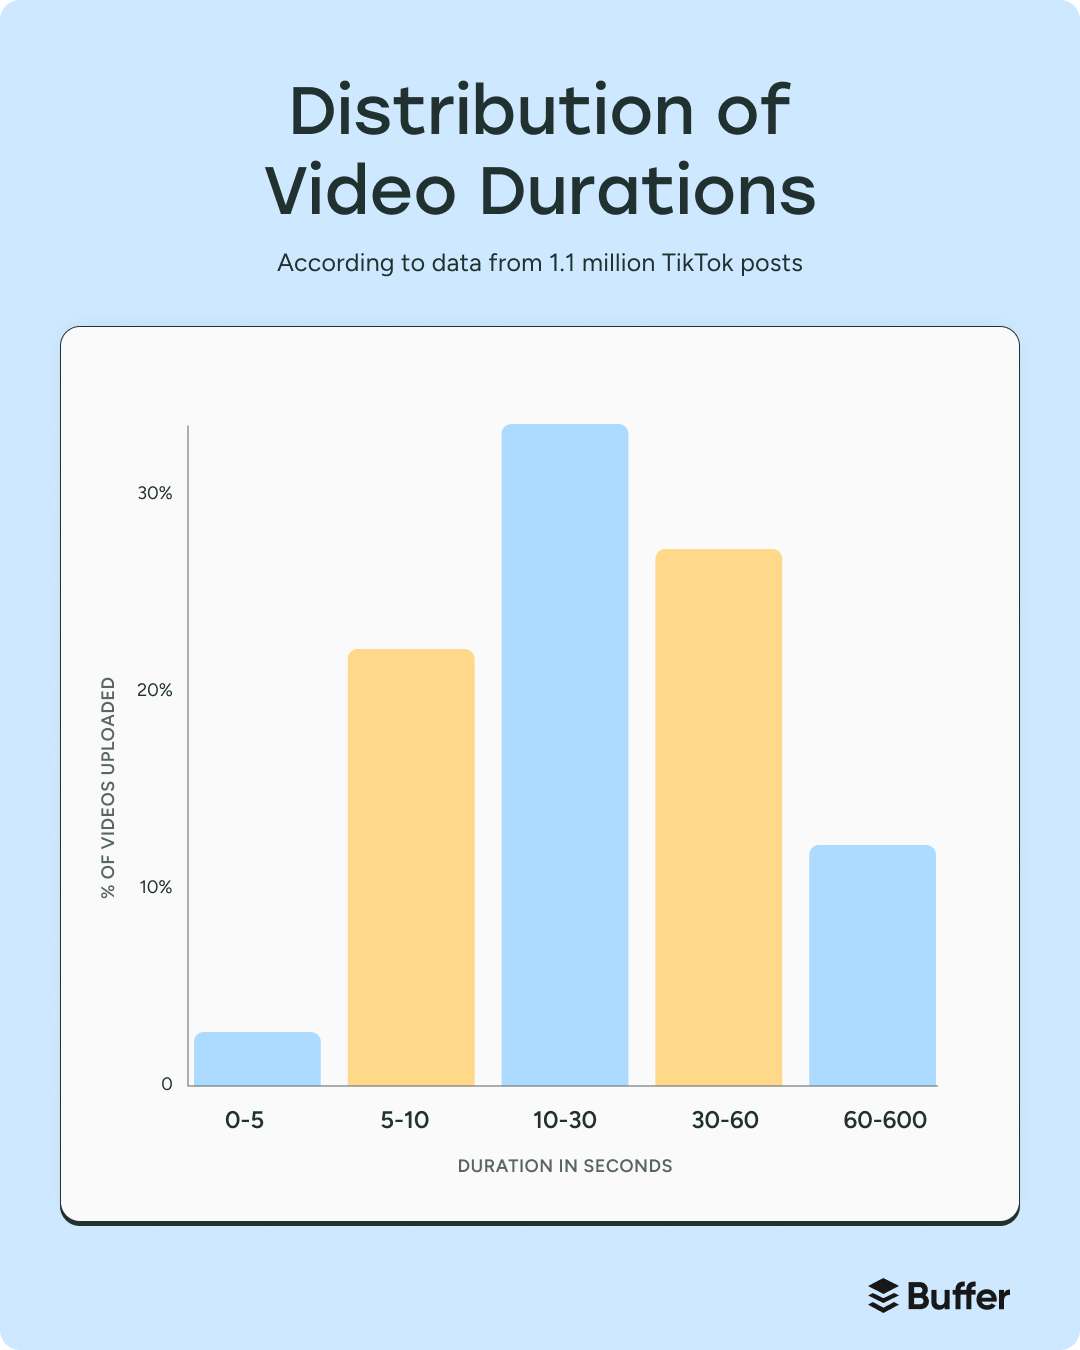
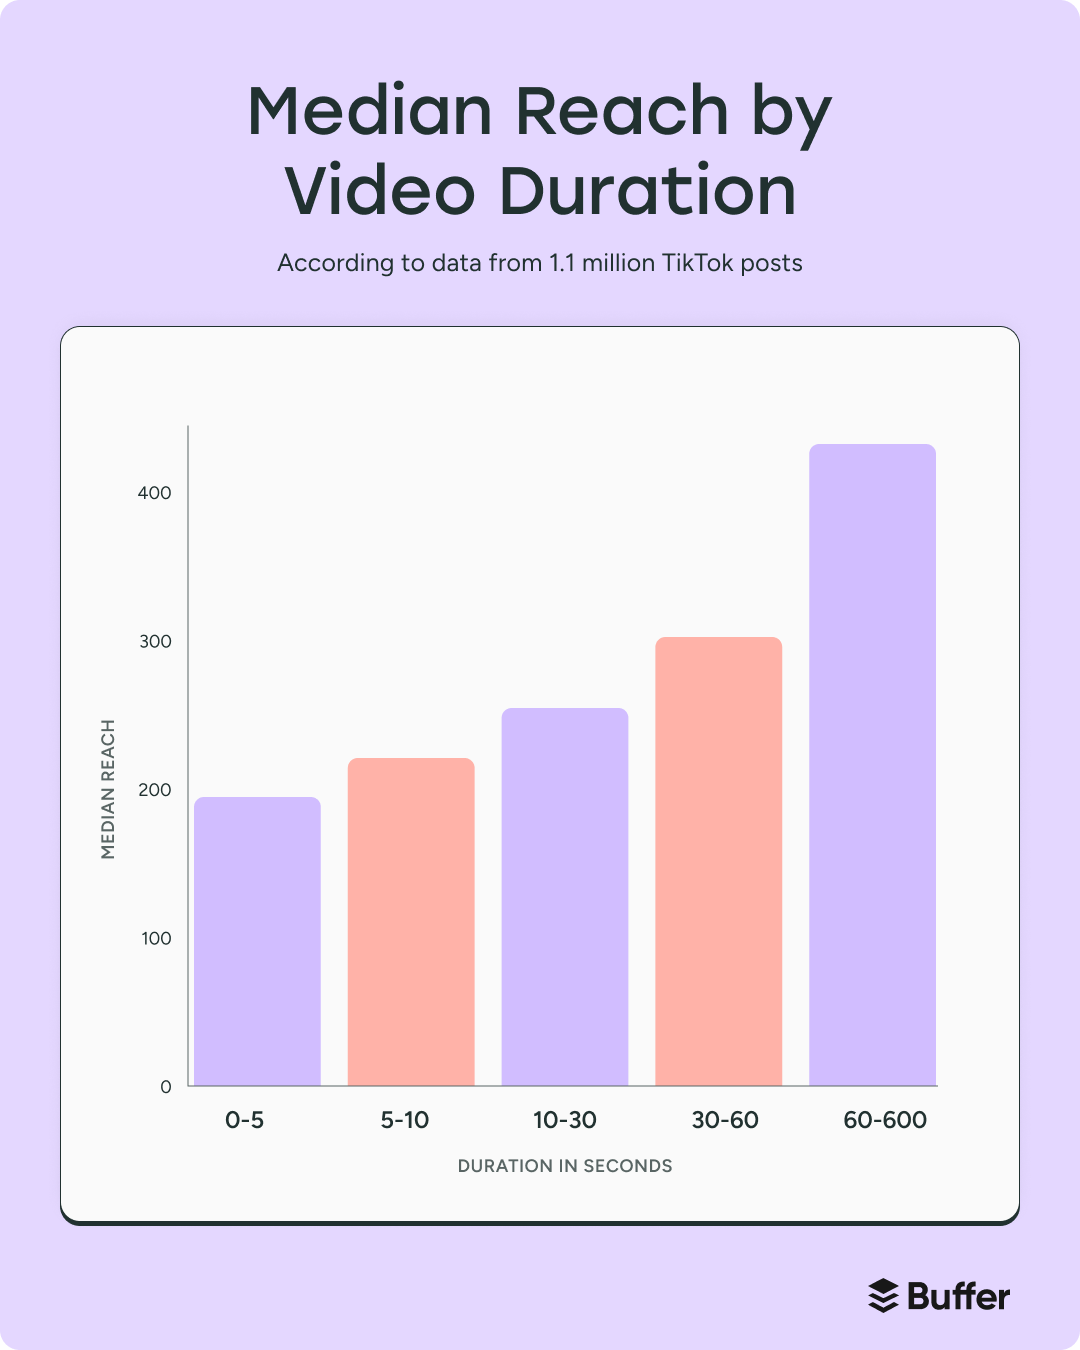
We analyzed 1.1 million TikTok videos to find out how video length affects performance. The results challenge the idea that shorter is always better.
Key findings:
To start off, we checked what everyone is already doing and most TikToks — 86% — are under 60 seconds. But surprisingly, creators who go longer are reaping the rewards.
Compared to mid-length videos (30–60 seconds), TikToks over 60 seconds earned:
- +43.2% more reach
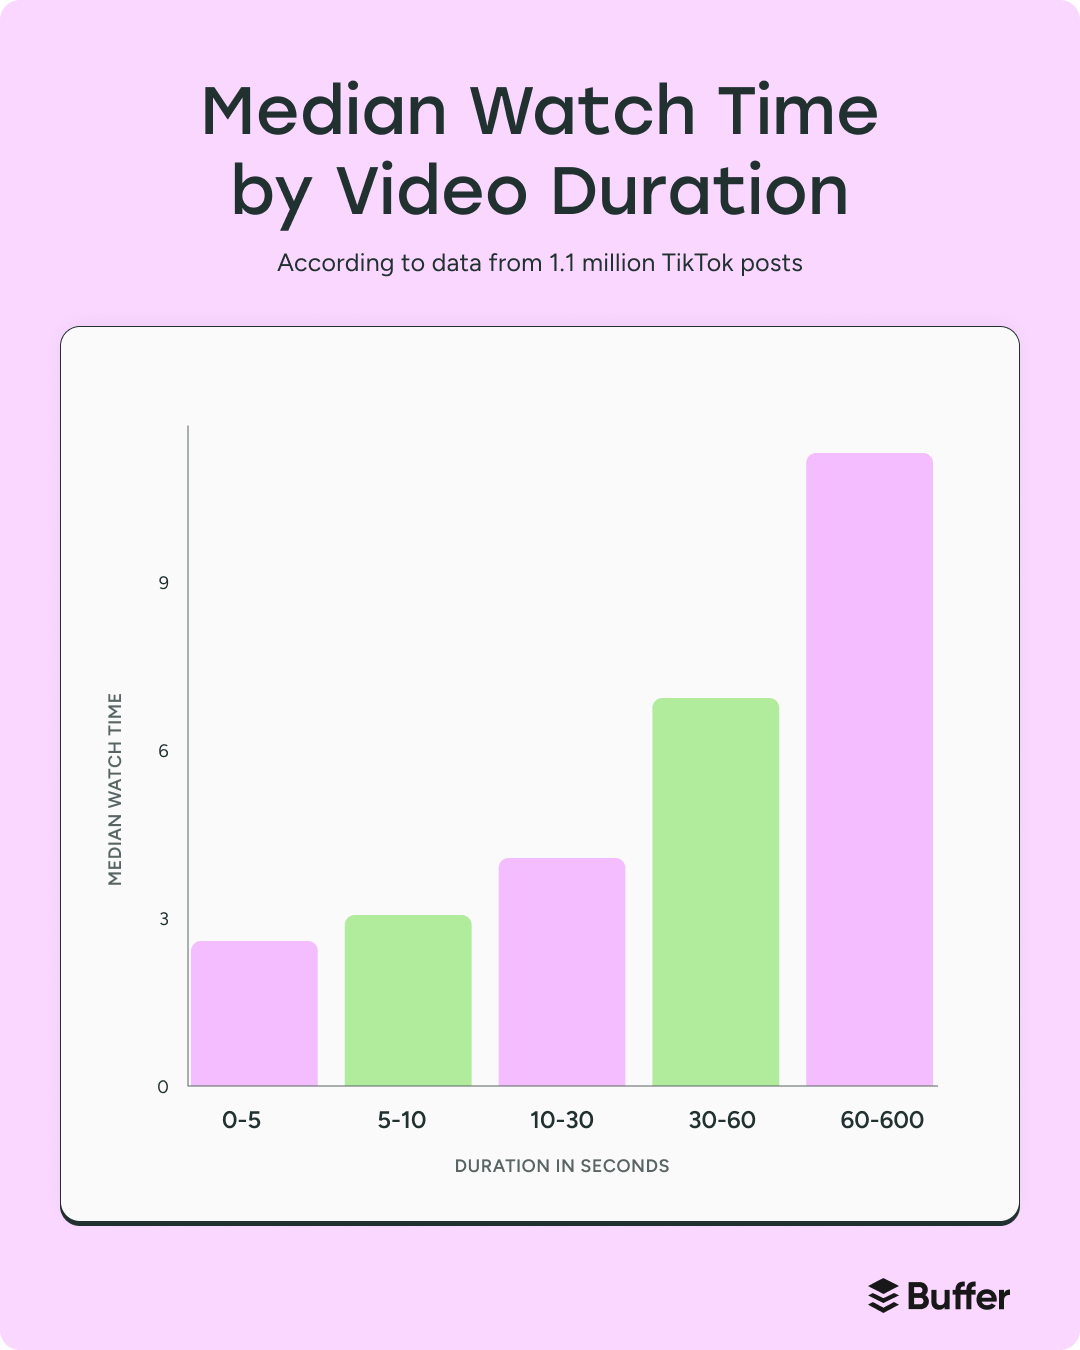
- +63.8% more watch time
And when compared to ultra-short clips (5–10 seconds), the results are even more dramatic, with videos over 60 seconds seeing:
- +95.7% more reach
- +264.5% more watch time
Even 30–60 second clips saw solid wins over shorter content:
- +18.9% more reach vs. 10–30 sec videos
- +36.7% more reach vs. 5–10 sec clips
📌 What does the data mean for you?
If you take nothing else away from this section, take this: create videos that are 60 seconds or longer.
Even mid-length videos of 30-60 seconds consistently produce stronger results than ultra-short clips.
Finally, remember: the algorithm rewards watch time, but quality still wins. A strong first few seconds matter just as much as length, so hook fast, then deliver.
📚 Resources to elevate your TikTok content
- How Long Can a TikTok Be? The Ultimate Guide to TikTok Video Length (+ What Gets the Most Views)
- How to Get Your Next Idea Using TikTok's Creator Search Insights
- 14 Ways to Get More Followers on TikTok in 2025
How content formats affect Instagram reach and engagement in 2025
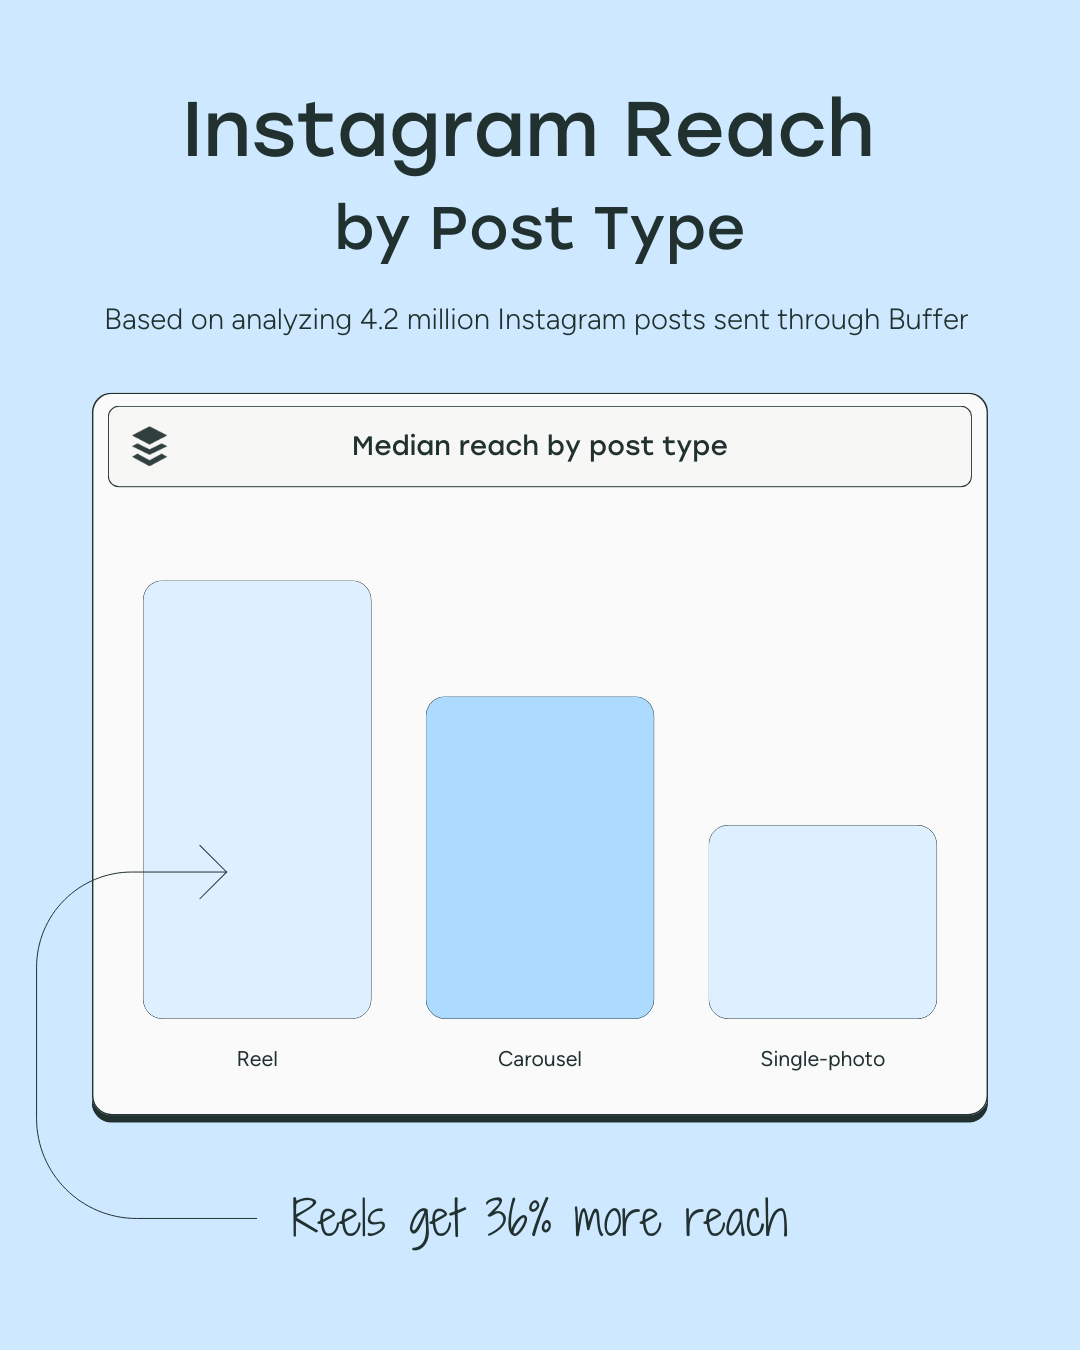
We analyzed over 4 million Instagram posts from 2022 to late 2024 to understand how content format affects both reach and engagement.
Our data revealed that reels and carousels both have strengths — but they serve different goals.
Key findings:
Reels drive discovery. On average, Reels earned:
- 36% more reach than carousels
- 125% more reach than single-image posts
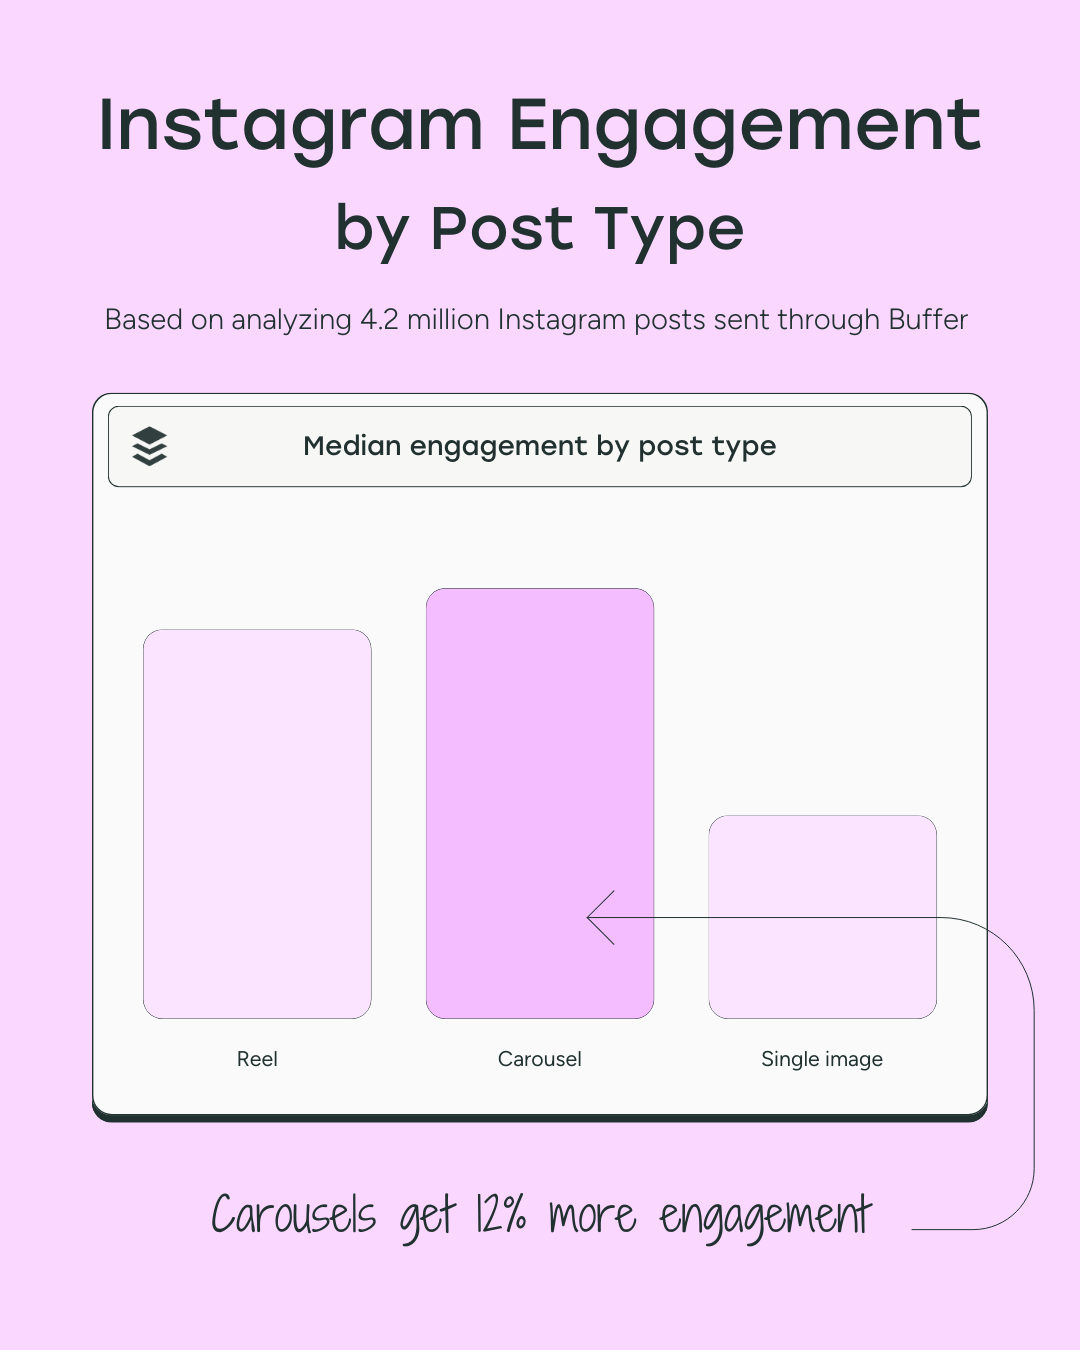
Carousels drive engagement. They outperformed other formats when it came to interactions:
- 12% more engagement than reels
- 114% more engagement than single-image posts
📌 What does the data mean for you?
There are three things to consider given these findings.
One, to grow your audience and boost visibility on Instagram, use reels – they’re seen more often, especially by non-followers.
Two, to engage your existing community more deeply, use Carousels – they get more likes, comments, saves, and shares.
And finally, use photos more sparingly. They still have a role — but perform lowest on both reach and engagement. Better yet, put them in a carousel.
📚 Resources to upgrade your Instagram
- Instagram Reels in 2025: Tips, Strategies, and Hacks to Create, Edit, and Distribute Your Videos
- 11 Places to Find Scroll-stopping Instagram Templates for your Posts, Stories, and Reels
Social media network usage in 2025
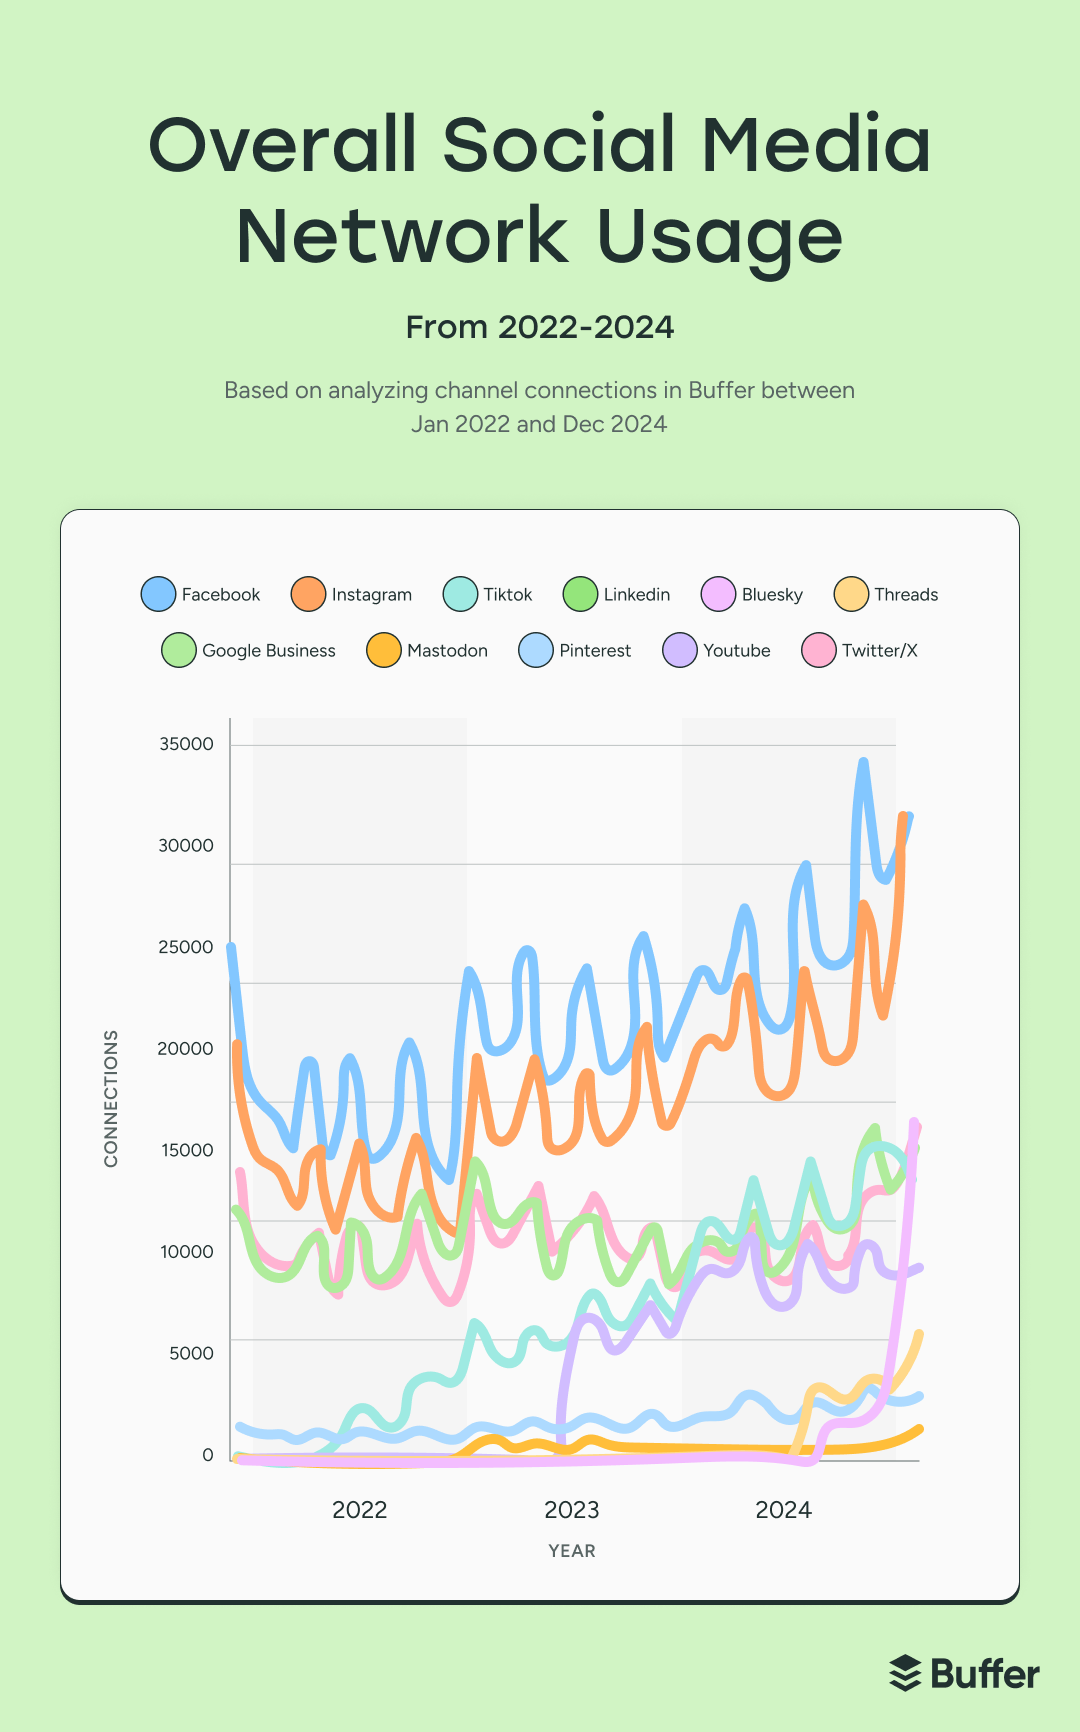
The social media landscape is constantly shifting, so to understand where creators and brands are focusing their attention, we analyzed millions of Buffer channel connections from 2022 to late 2024. Our data shows both the rise of new players and the staying power of legacy platforms.
Key findings
Here’s how some of the biggest (and fastest-growing) platforms stack up:
- Bluesky surged: +1,588% increase (from 1.6K to 27K connections)
- Threads grew fast: +600% (from 3.3K to 23K)
- TikTok exploded: from just 779 → 276K connections
- Facebook stayed strong: +70% (from 1.08M → 1.85M)
- Instagram nearly doubled: +95% (from 657K → 1.28M)
- Pinterest gained momentum: +113%
- X (formerly Twitter) had slower growth: +37%
- YouTube Shorts skyrocketed: 5.6K → 147K in just 18 months
📌 What does the data mean for you?
The social landscape is no longer about picking one winning platform — it’s about diversifying smartly. Threads and Bluesky demonstrate how quickly new platforms can emerge. Getting in early can give you a head start on reach and relevance.
But legacy platforms still matter. Facebook and Instagram continue to grow steadily, reminding us that the biggest audiences often reside where people already spend their time.
And video? It’s unavoidable. The surge in TikTok and YouTube Shorts shows that creators are prioritizing formats that drive visibility quickly.
In all of this, the most important thing to remember is to focus on where your audience is — and where they’re headed next.
Threads vs. Twitter/X: Which sees the most engagement?
The release and rapid rise of Threads kickstarted a new question among the text-first platforms: which sees the most engagement?
To answer that, we analyzed 10.2 million posts from 2024 to compare engagement performance on Threads and X (Twitter) via Buffer.
Key findings
Threads posts have a median engagement rate of 6.25%, compared to just 3.60% on X. That’s a 73.6% increase in engagement — despite Threads having a smaller overall user base at the time of analysis.
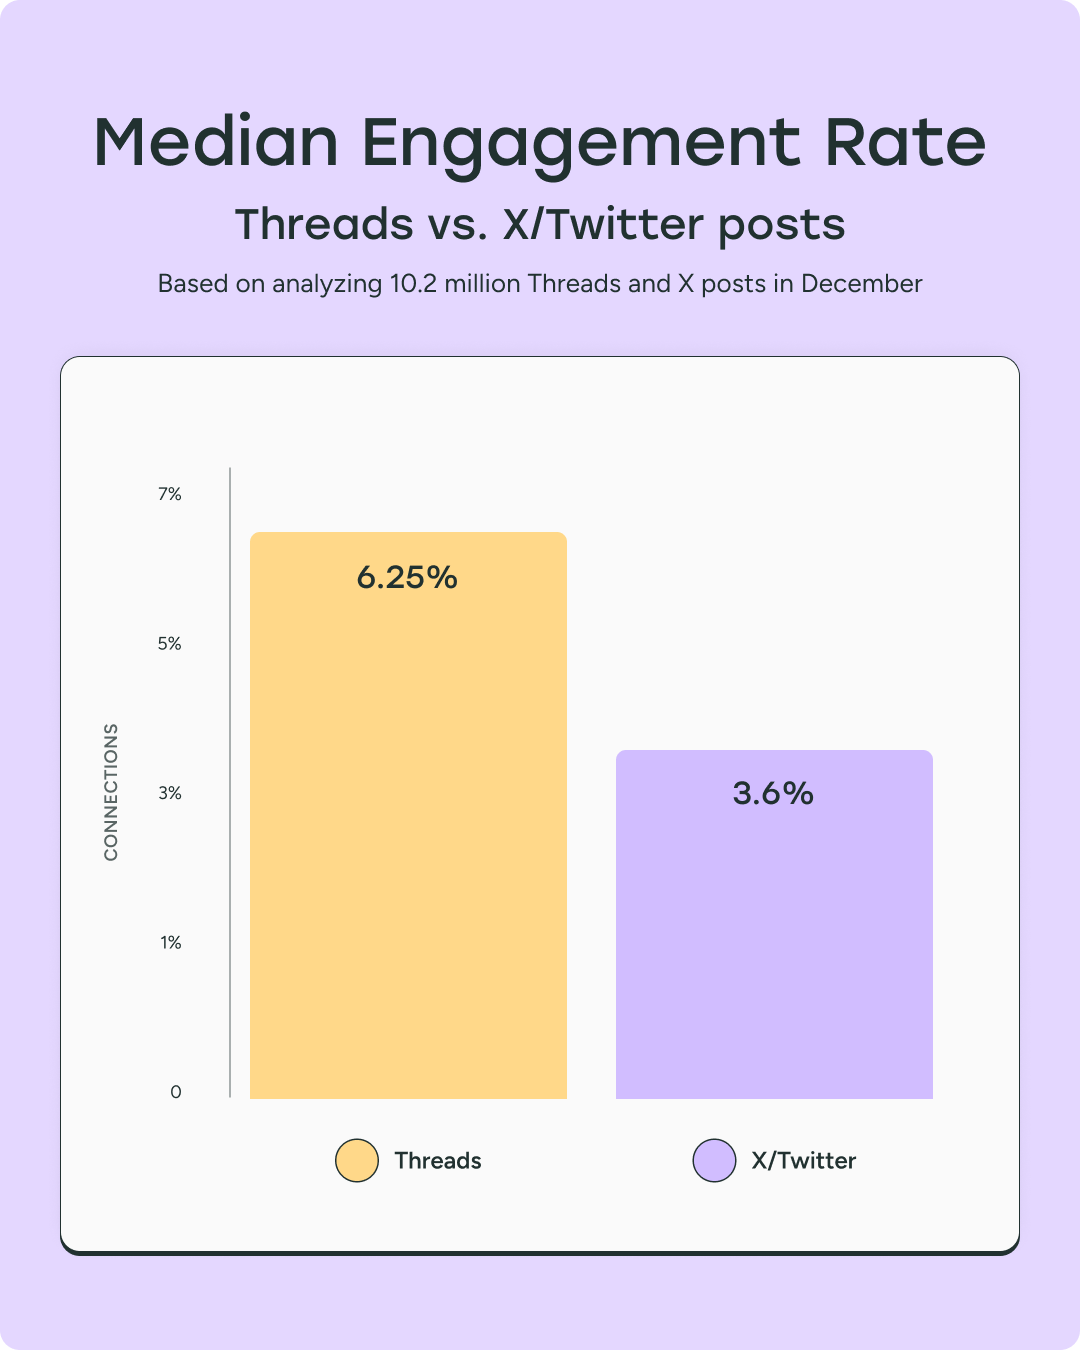
The average engagement rate was also higher on Threads: 4.44%, compared to 2.42% on X — a +83.5% uplift in average engagement.
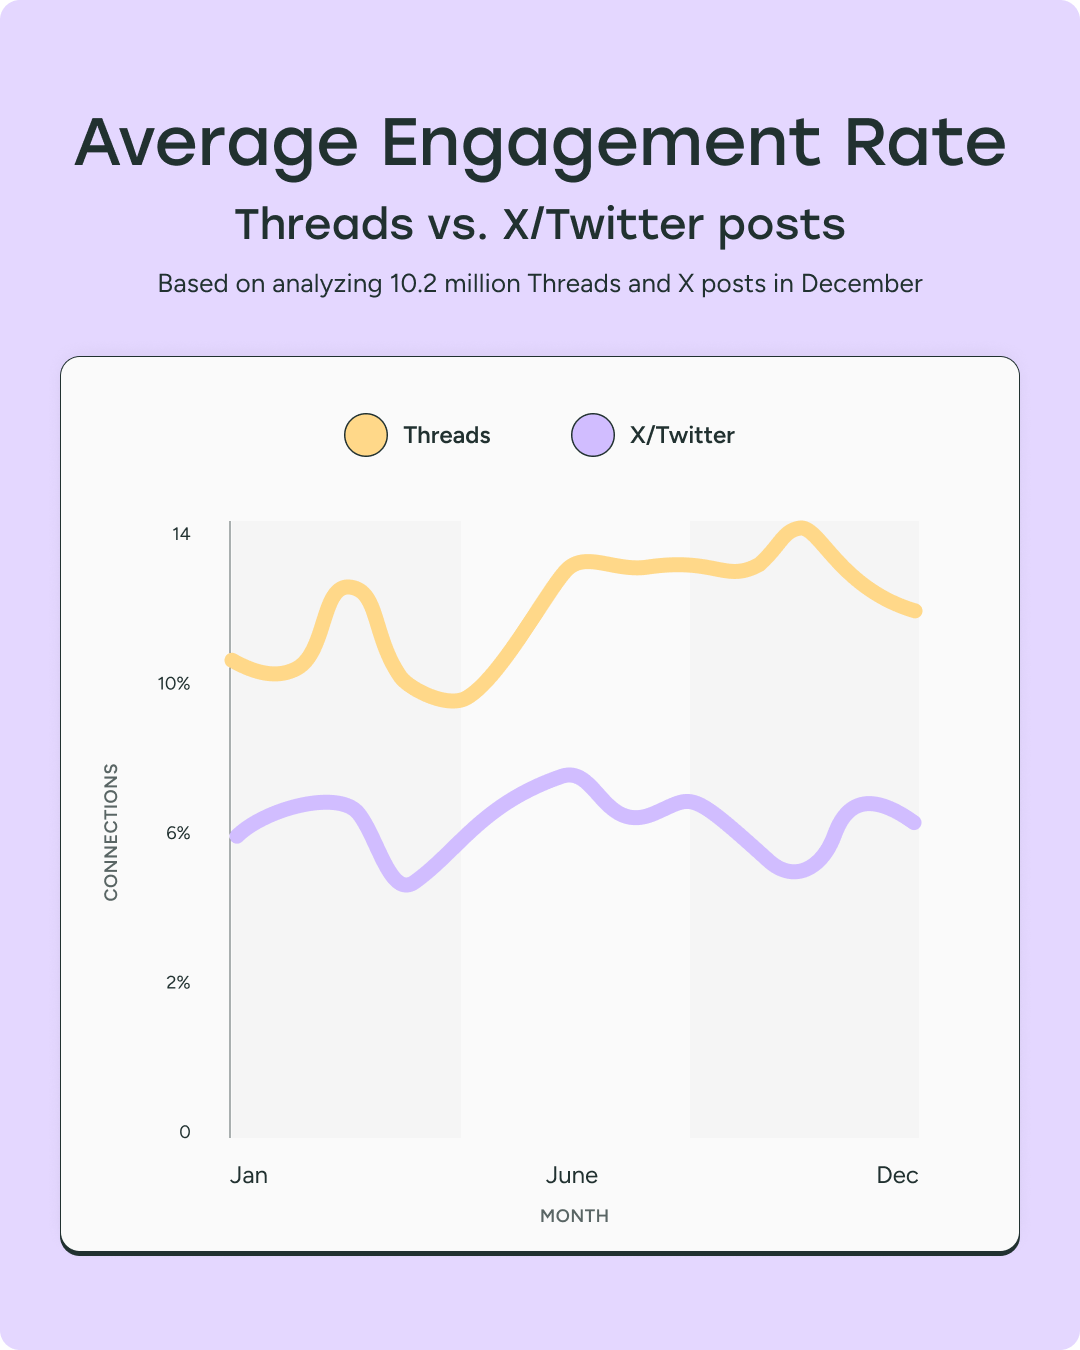
Why the gap? Engagement on Threads is being driven by its reply-first algorithm and relatively low content saturation, giving posts a longer shelf life and higher visibility.
While X still boasts a larger active user base and broader reach potential, the data shows that creators looking for engagement — especially from early adopters and niche communities — are more likely to find it on Threads.
📌 What does the data mean for you?
If your content goal is connection and conversation, Threads offers significantly better engagement today.
But if you’re optimizing for news, virality, or reach, X still has strategic value — especially when paired with Threads.
Your best move? Cross-post thoughtfully and prioritize platforms where your community is most active.
📚 Resources to grow on Threads and X
- How to Use Threads: A Guide to Getting Started and Building a Following
- How to Get More Followers on Threads: 9 Tactics to Help You Grow
- How I Went Viral on X (Formerly Twitter): An In-Depth Analysis
- 9 Ways to Grow Your Following on X/Twitter
The state of text-first platforms: Threads, X, Bluesky
Text-first platforms kickstarted social media as we know it and are always surging in popularity — but they’re not all built the same.
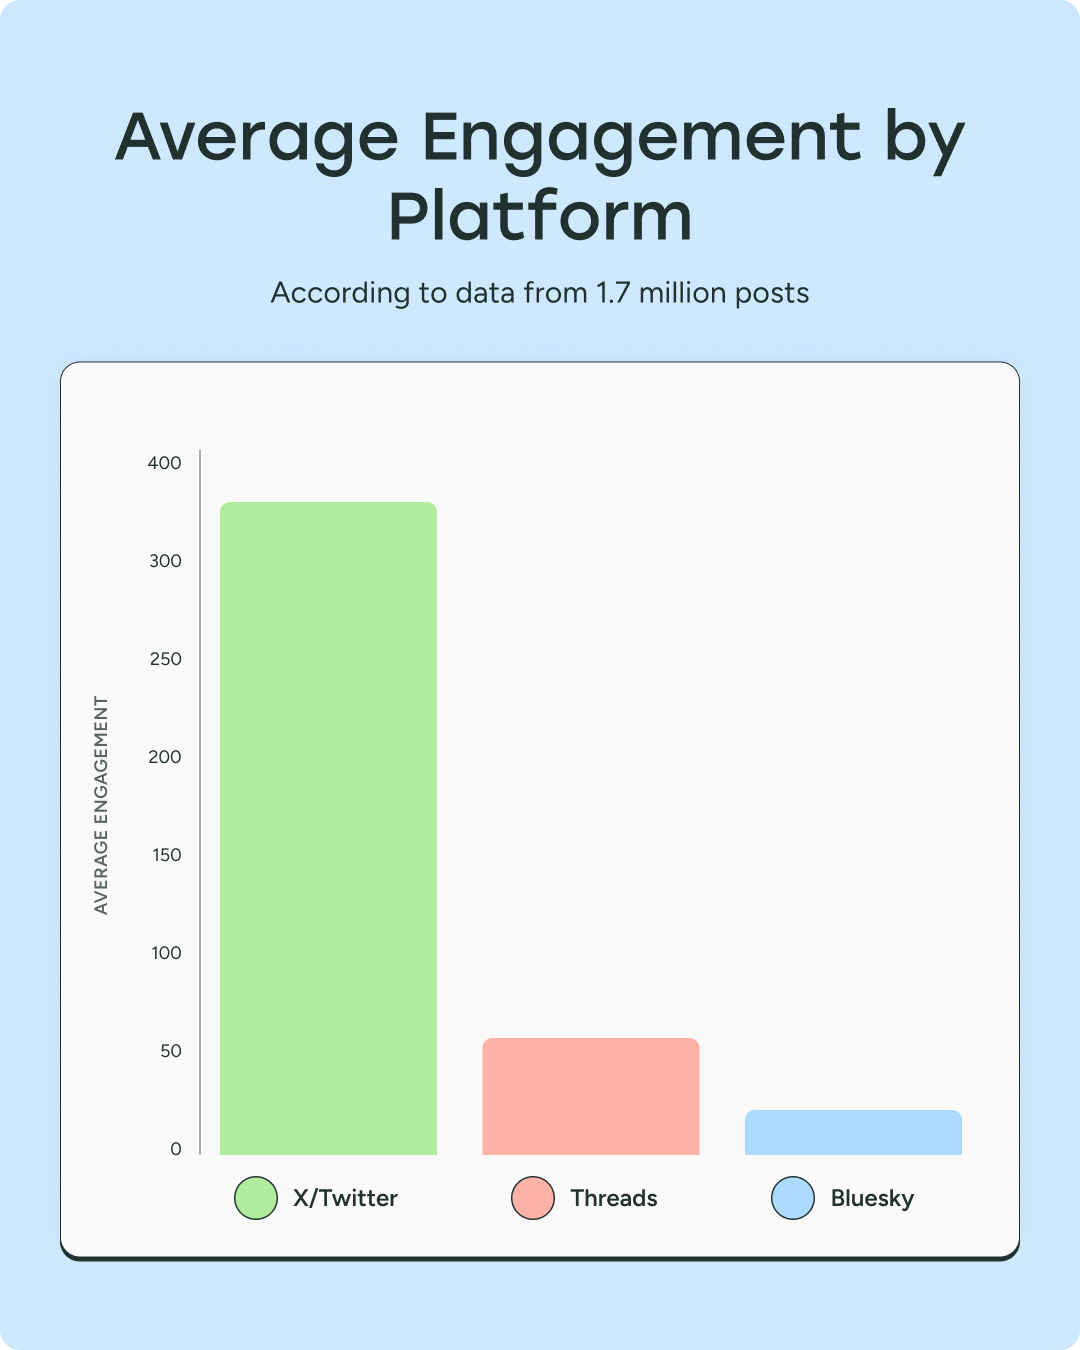
To compare how creators are showing up (and being seen) on Threads, X, and Bluesky, we analyzed 1.7 million posts from early 2025.
While they might seem interchangeable at first glance, the data reveals key differences in engagement dynamics.
Key findings
The median post gets 4 engagements on all three platforms. So for the typical user, performance starts in a similar range.
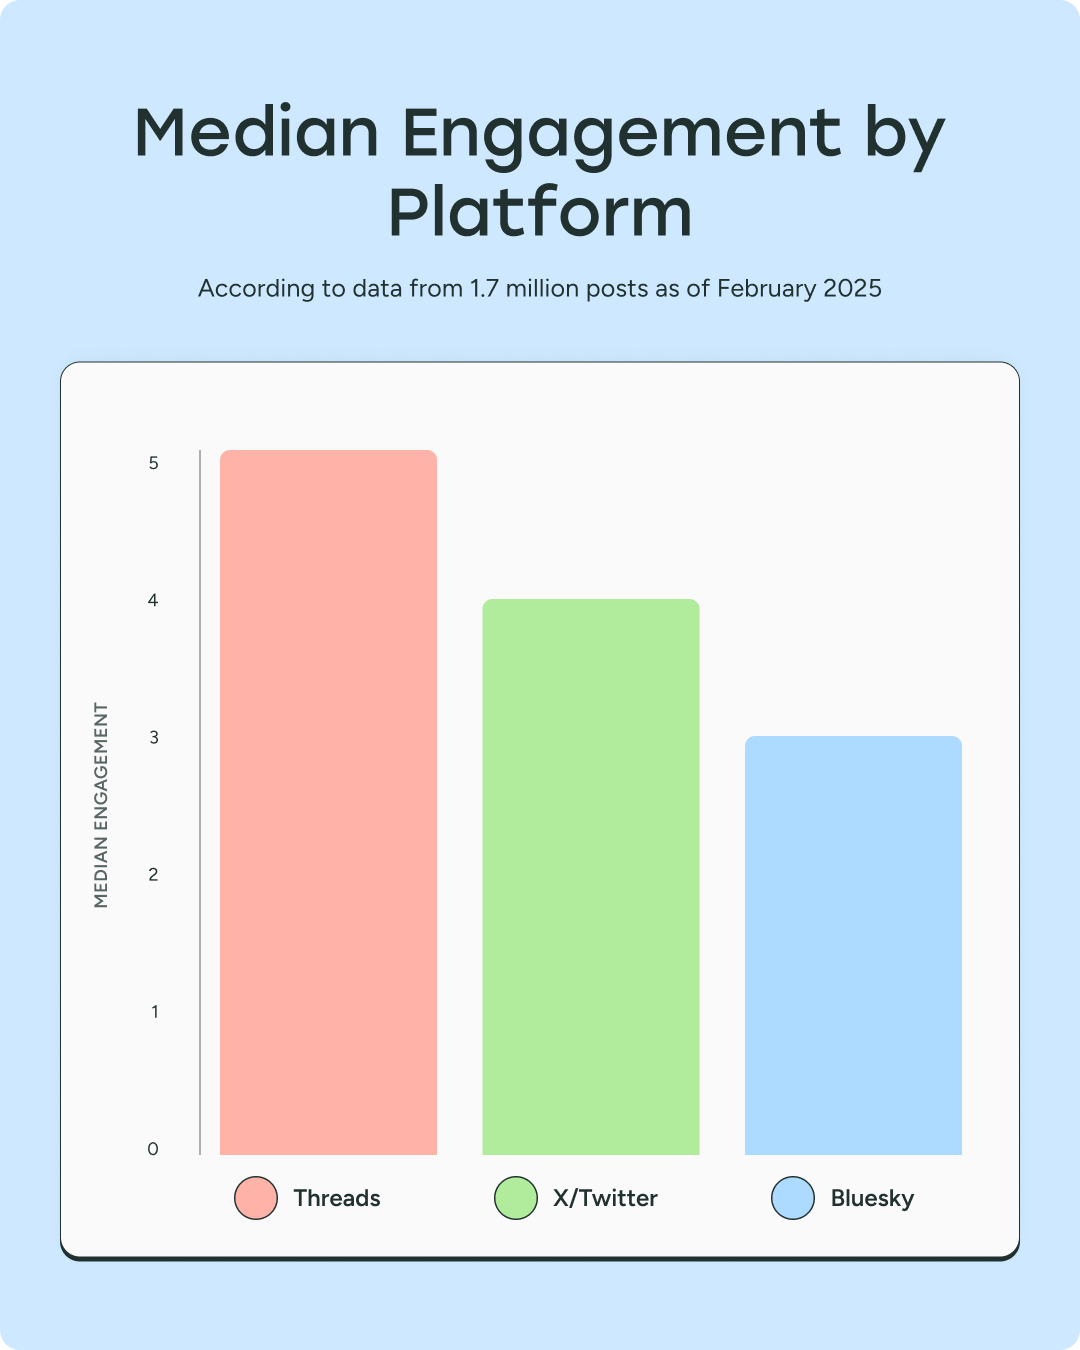
But when you look at average engagements, platform behavior diverges:
- X posts average 328 engagements — meaning a few viral hits skew the numbers.
- Threads average 58 — indicating steady, consistent interaction.
- Bluesky averages 21 — niche and focused, with smaller but dedicated audiences.
But why does it matter at all? It helps to make an informed decision about which platform to pick and what approach to take.
- X is unpredictable — powerful if you strike viral gold, but chances are you'll usually get a modest 4 interactions.
- Threads is the steady middle ground — engagement isn’t extreme, but it’s predictably solid.
- Bluesky is intentionally small-scale — designed for creators who value tight-knit interactions over mass reach.
📌 What does the data mean for you?
A multi-platform approach can give you both scale and depth. Combine the strengths of each platform:
- Chasing viral reach? Invest in X, knowing the payoff comes in spikes.
- Want consistent conversations? Threads offers a dependable baseline.
- Prefer deep-dive community engagement? Bluesky may be worth the effort.
And so you don’t duplicate efforts, explore cross-posting. Creators seeing the most success often cross-post with slight tweaks — repackaging ideas to match each platform’s vibe.
📚 Resources for your text-first platforms
- 6 Threads Content Ideas For Your Next Post (+Tips to Help You Draft It)
- 7 Bluesky Content Ideas and Tips for Your Next Post
- 26 Great Ideas For Social Media Posts That You Can Steal
The best time to post on every platform
Our most popular question — answered with data from real user posts.
Buffer analyzed millions of posts across all major platforms to determine the best times to publish.
Below, you’ll find a breakdown of top-performing time windows by platform — plus links to dive deeper into each individual analysis.
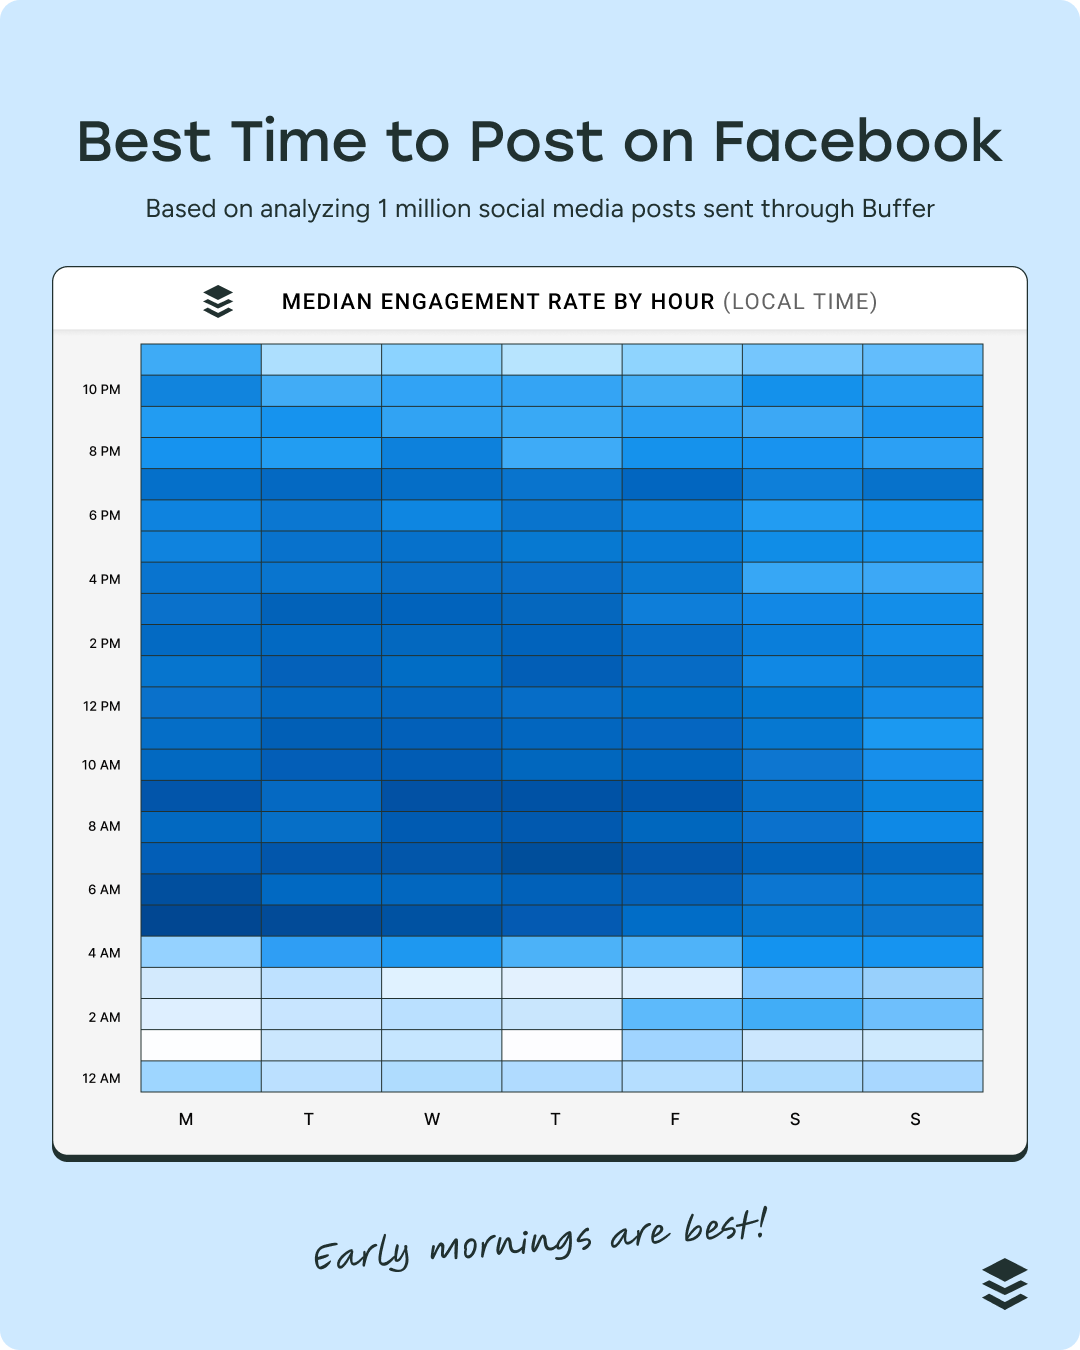
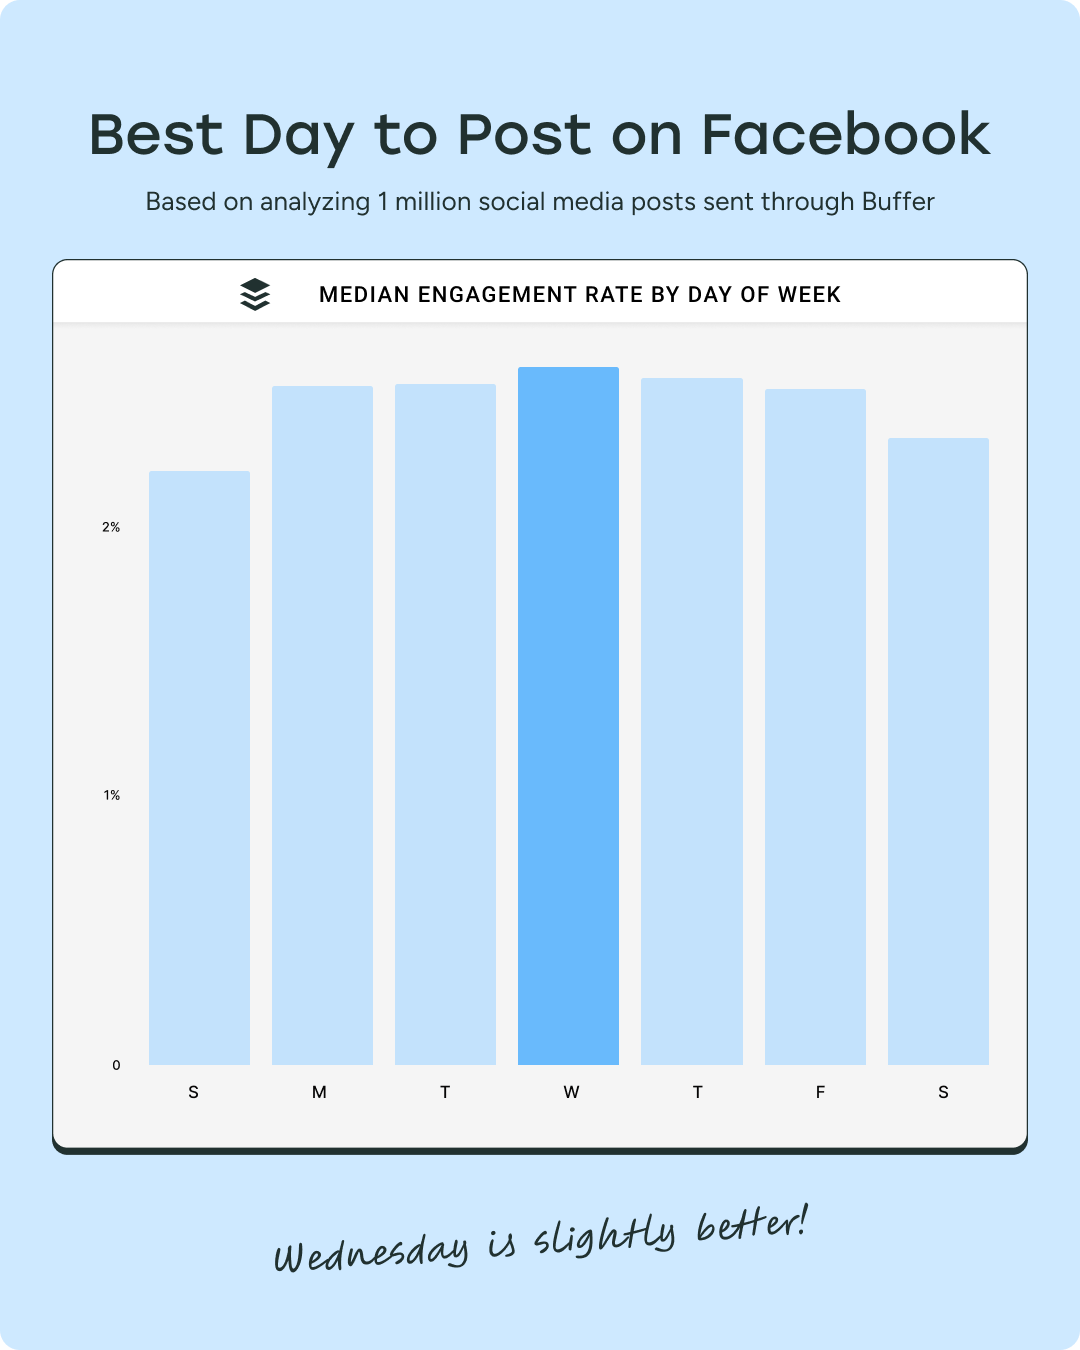
Best time to post on Facebook
The best time to post on Facebook is between 5–7 a.m. local time, with Mondays and Wednesdays driving the most engagement. Early morning scrolls remain effective, especially for content that sparks conversation.
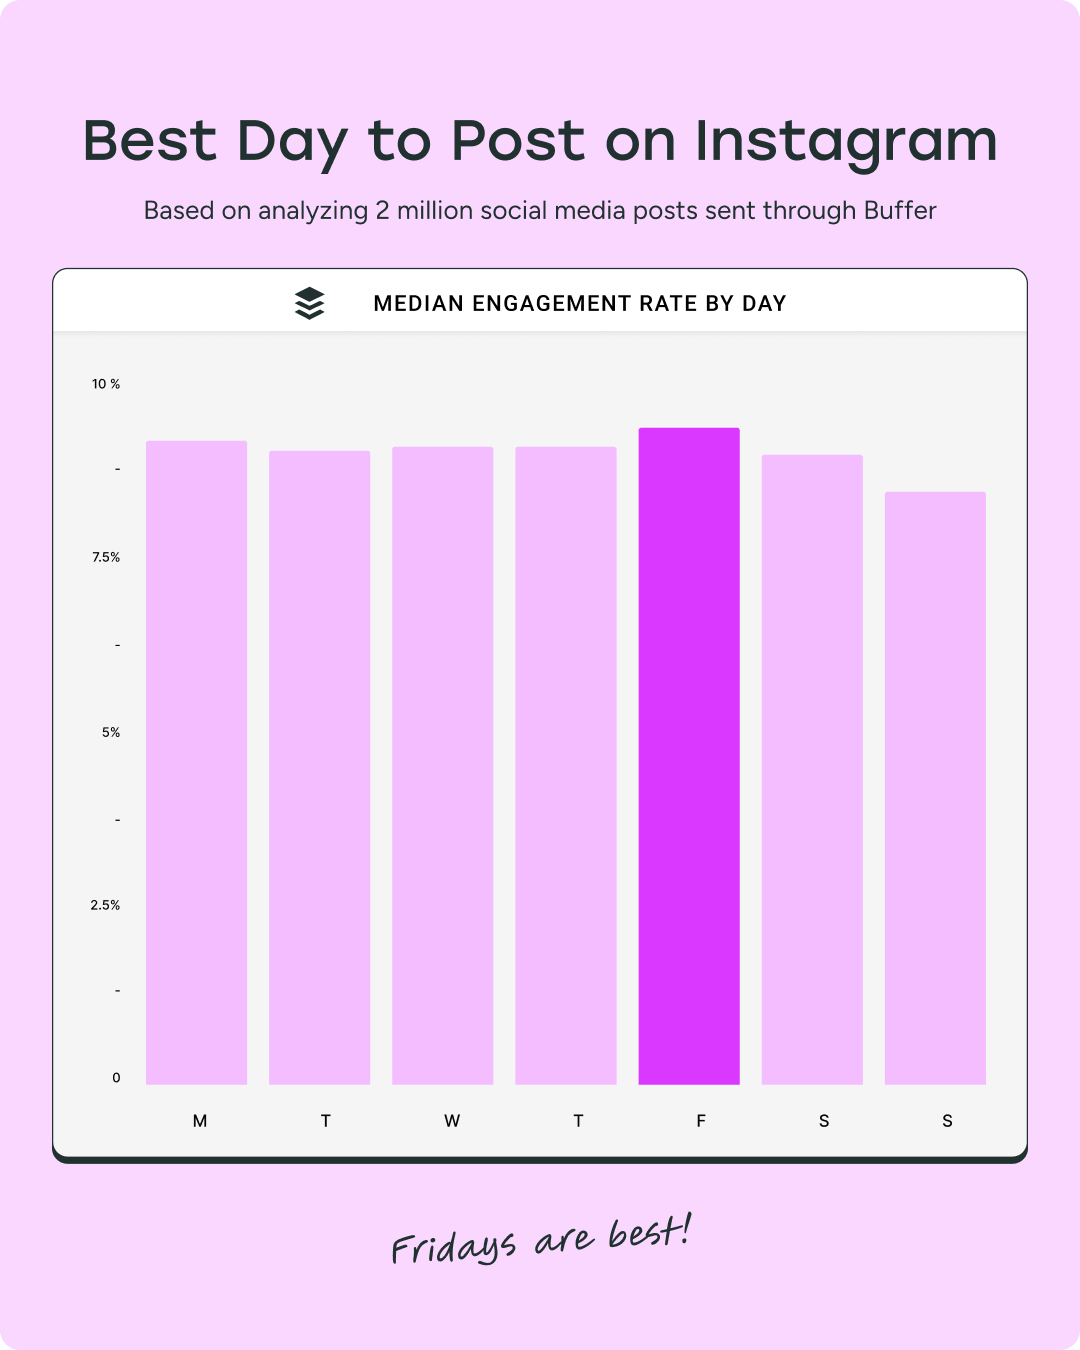
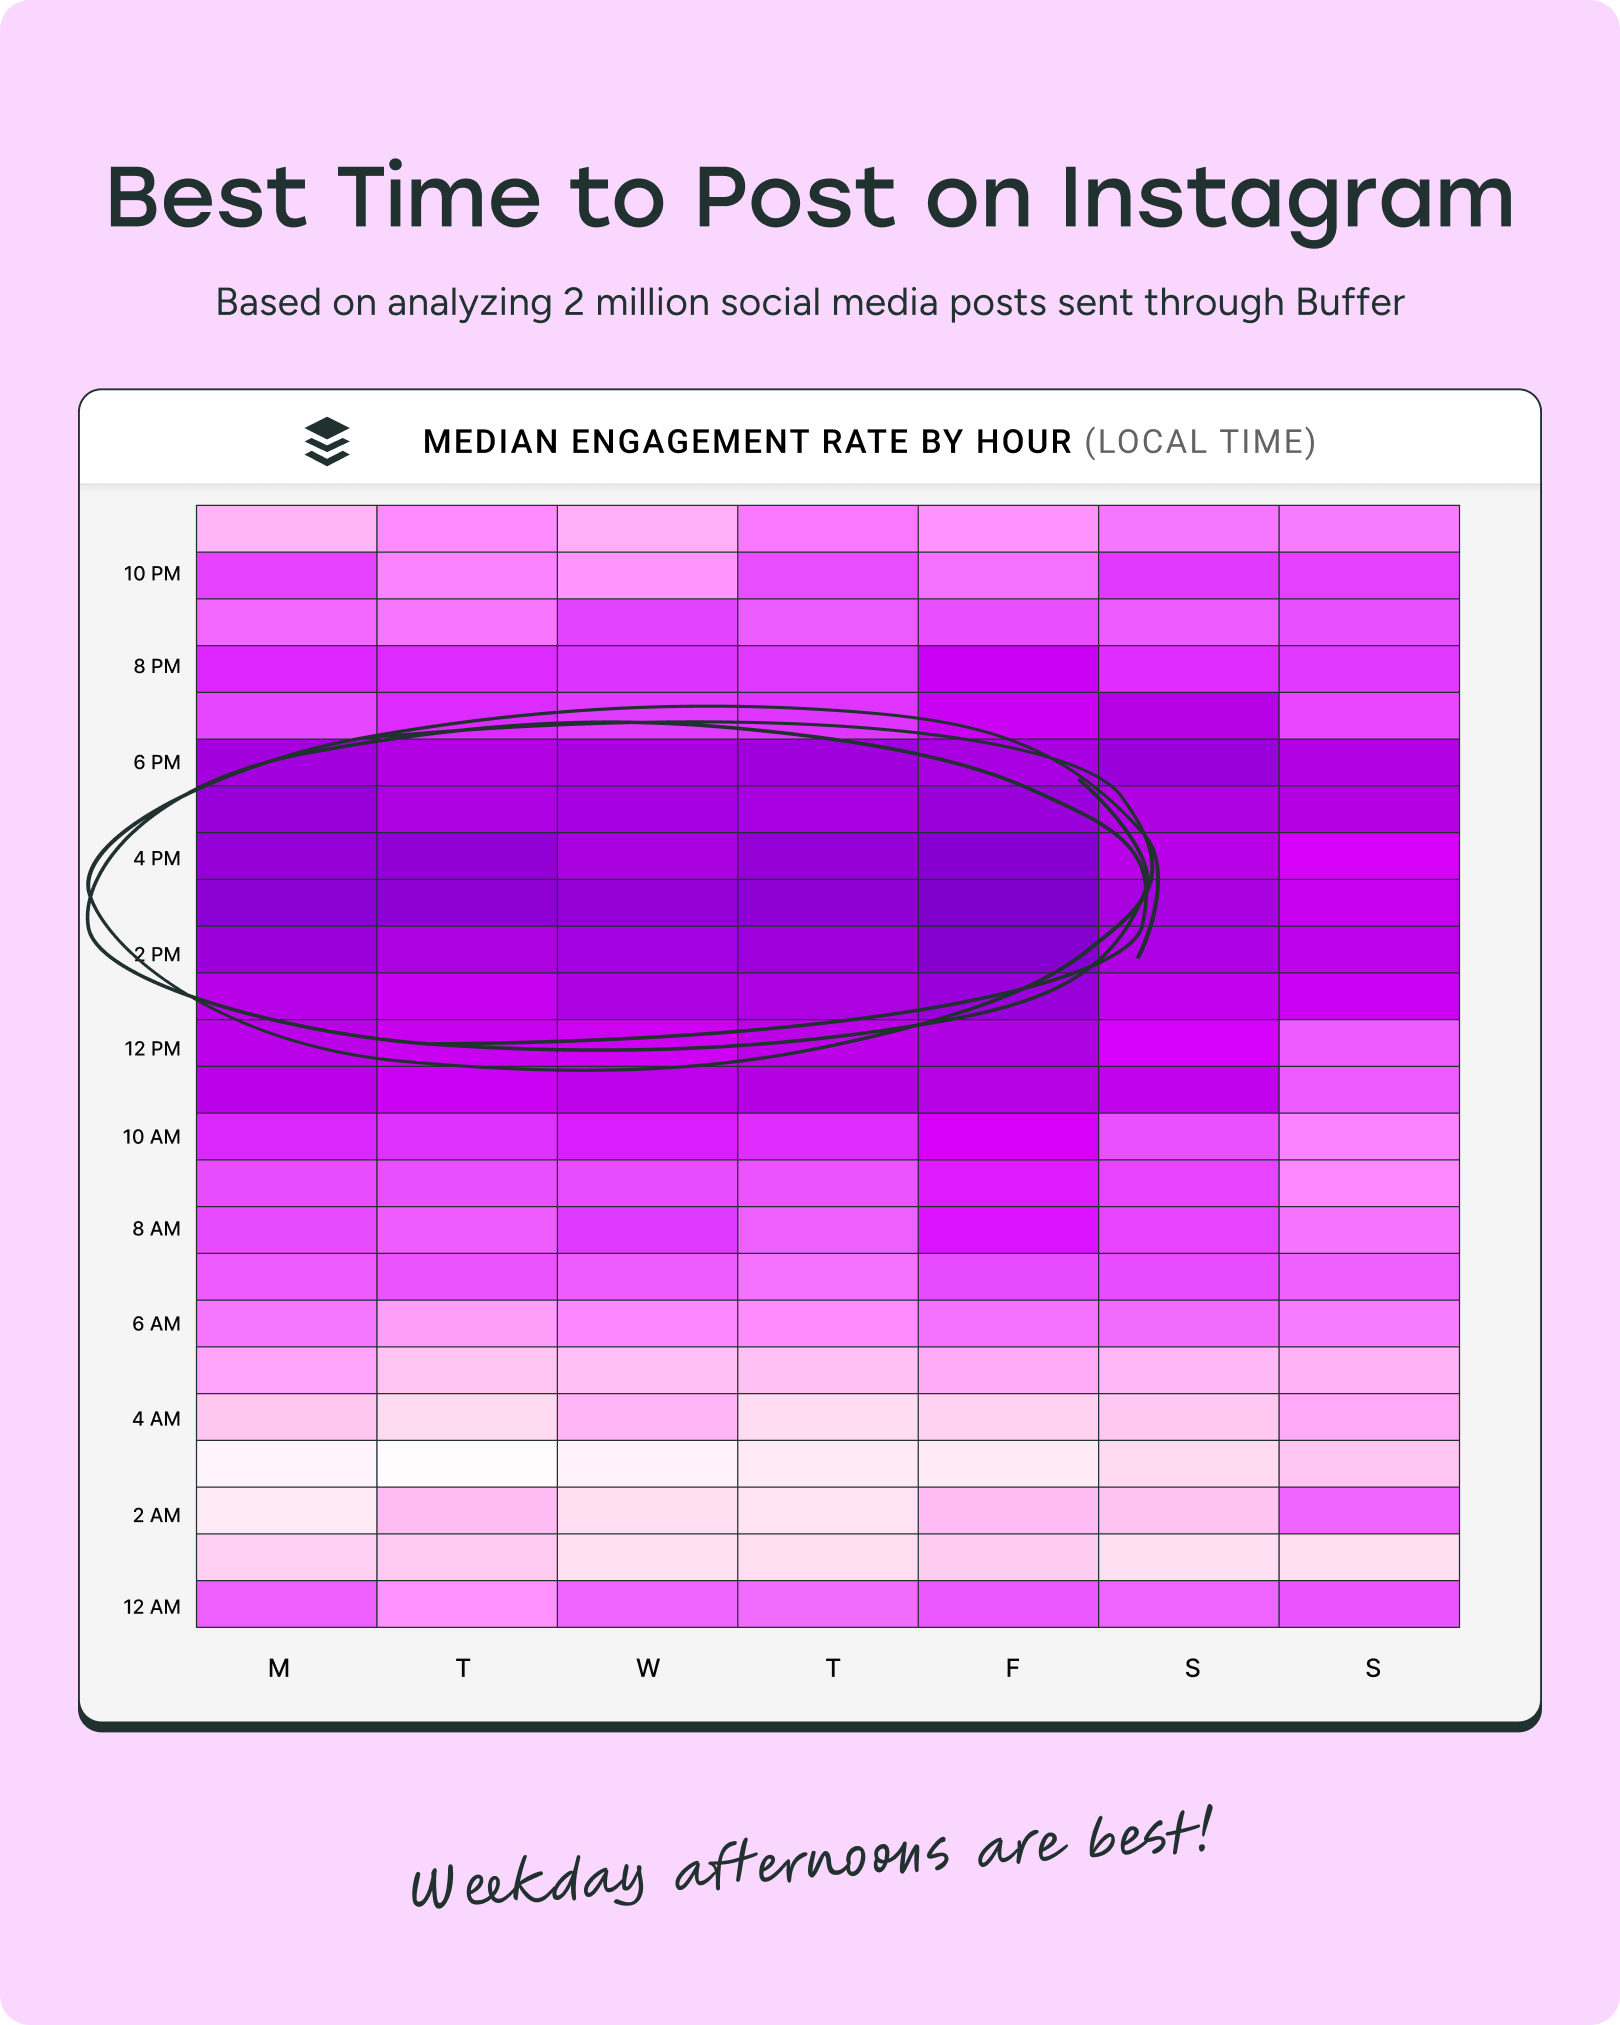
Best time to post on Instagram
Instagram sees peak performance in the late afternoon, especially 3–6 p.m., with Fridays generating the most interactions. This is prime time for visual content and save-worthy posts.
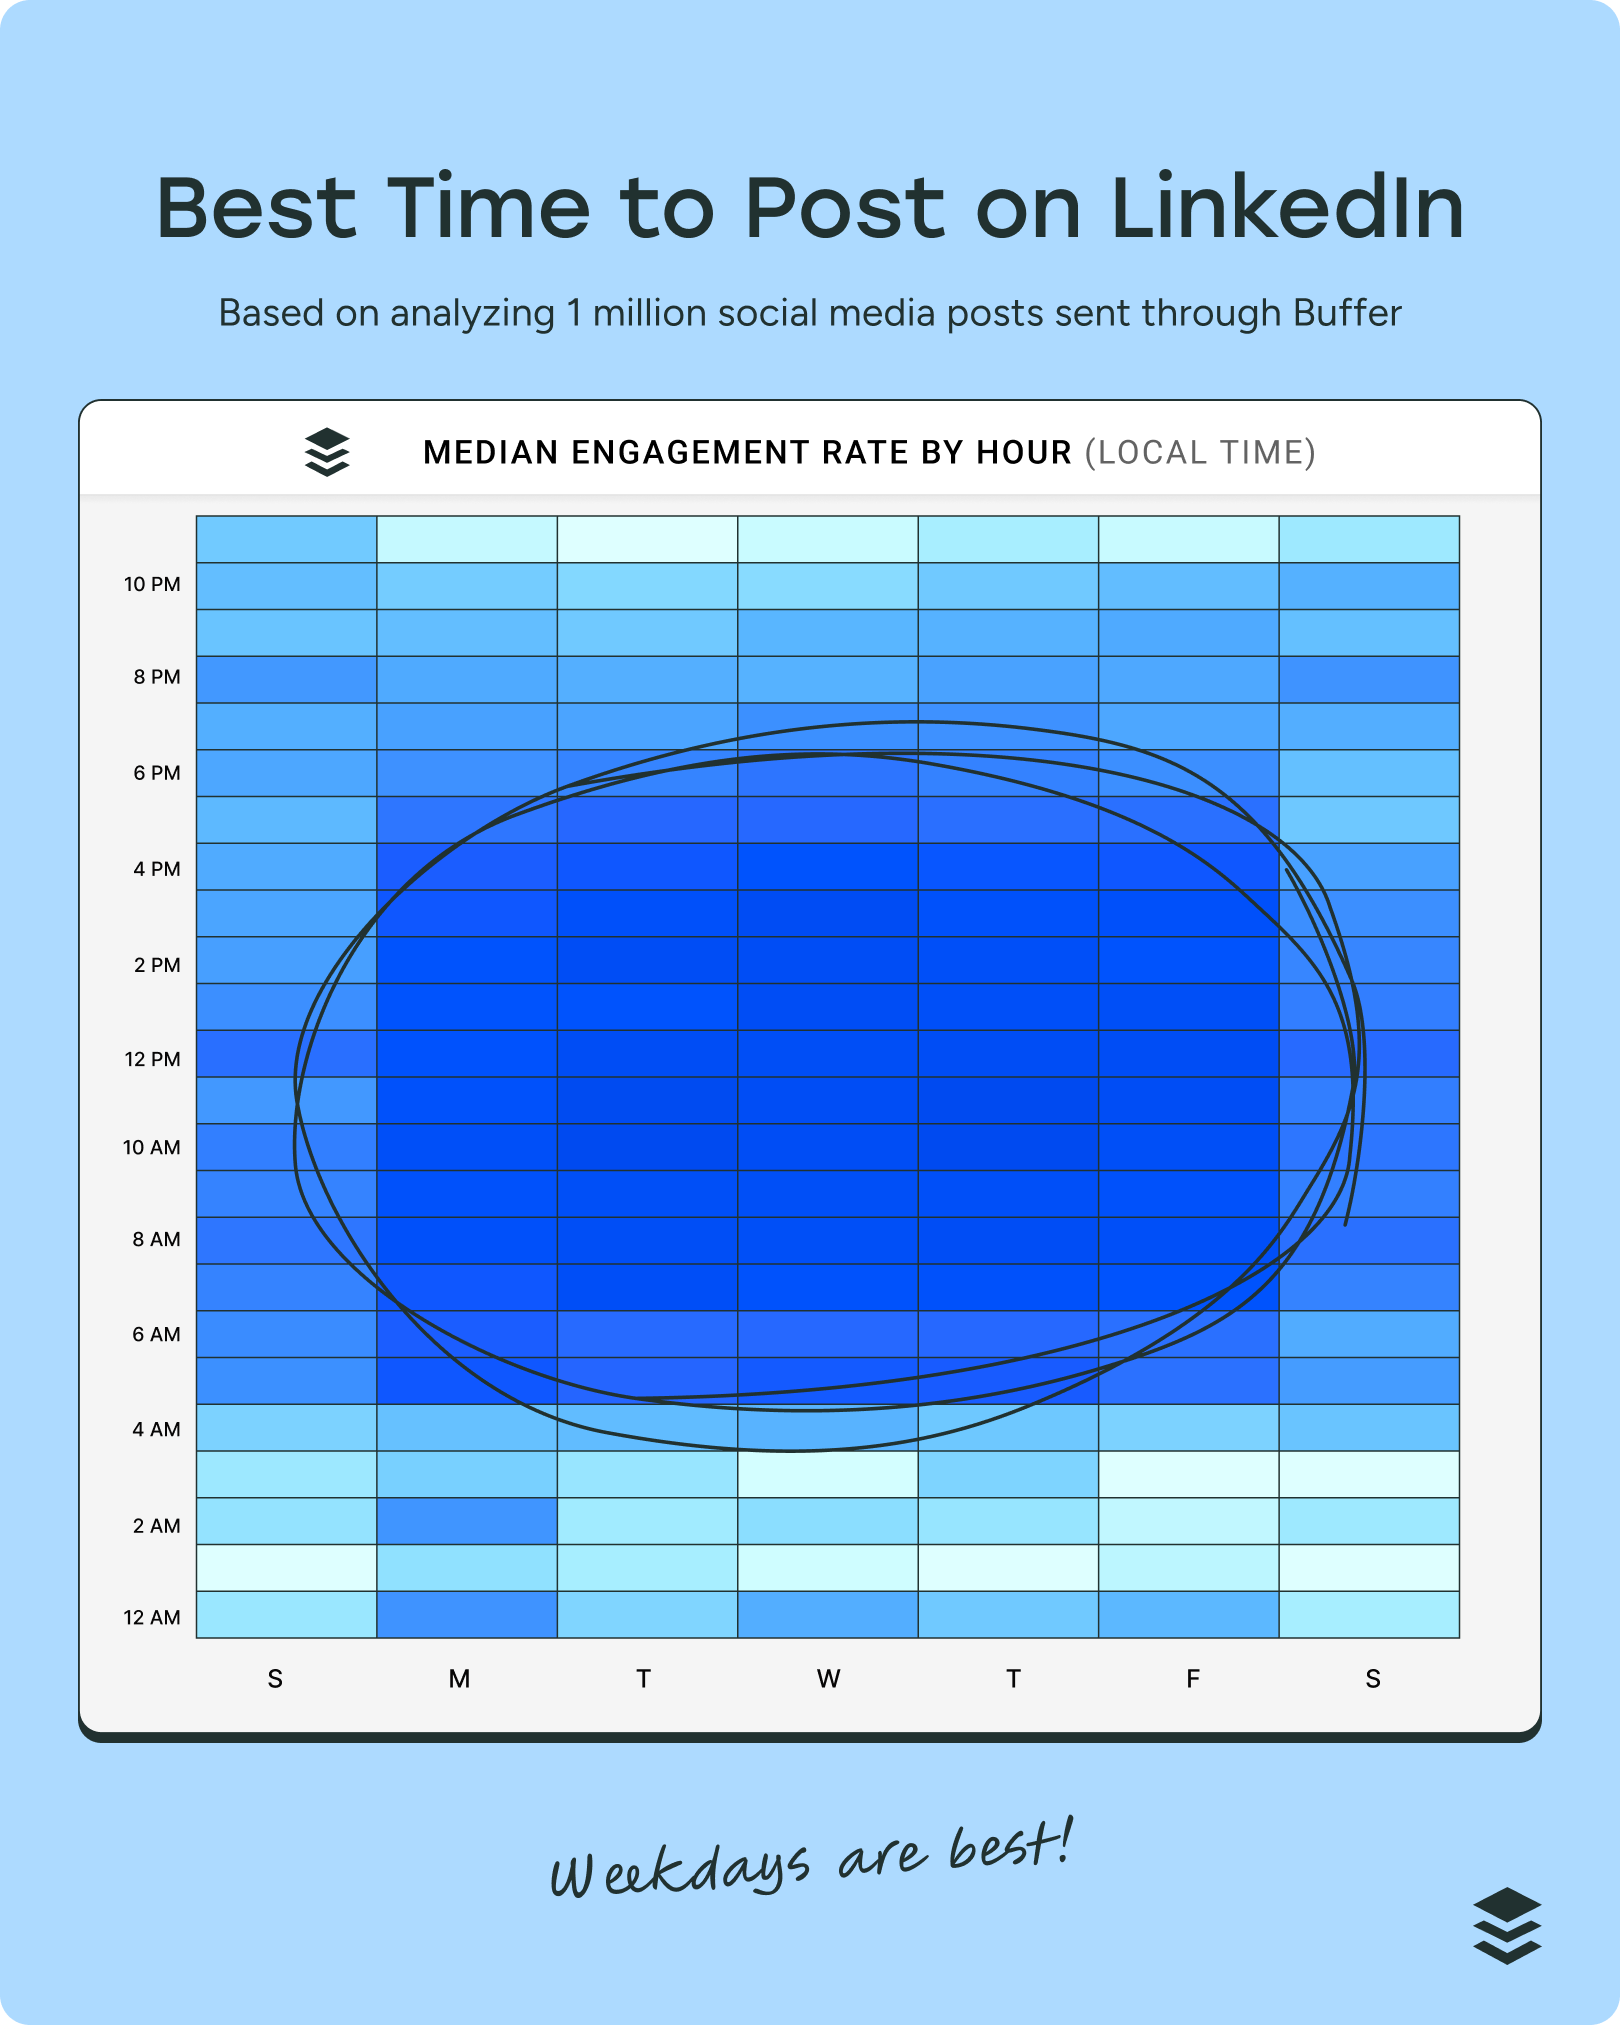
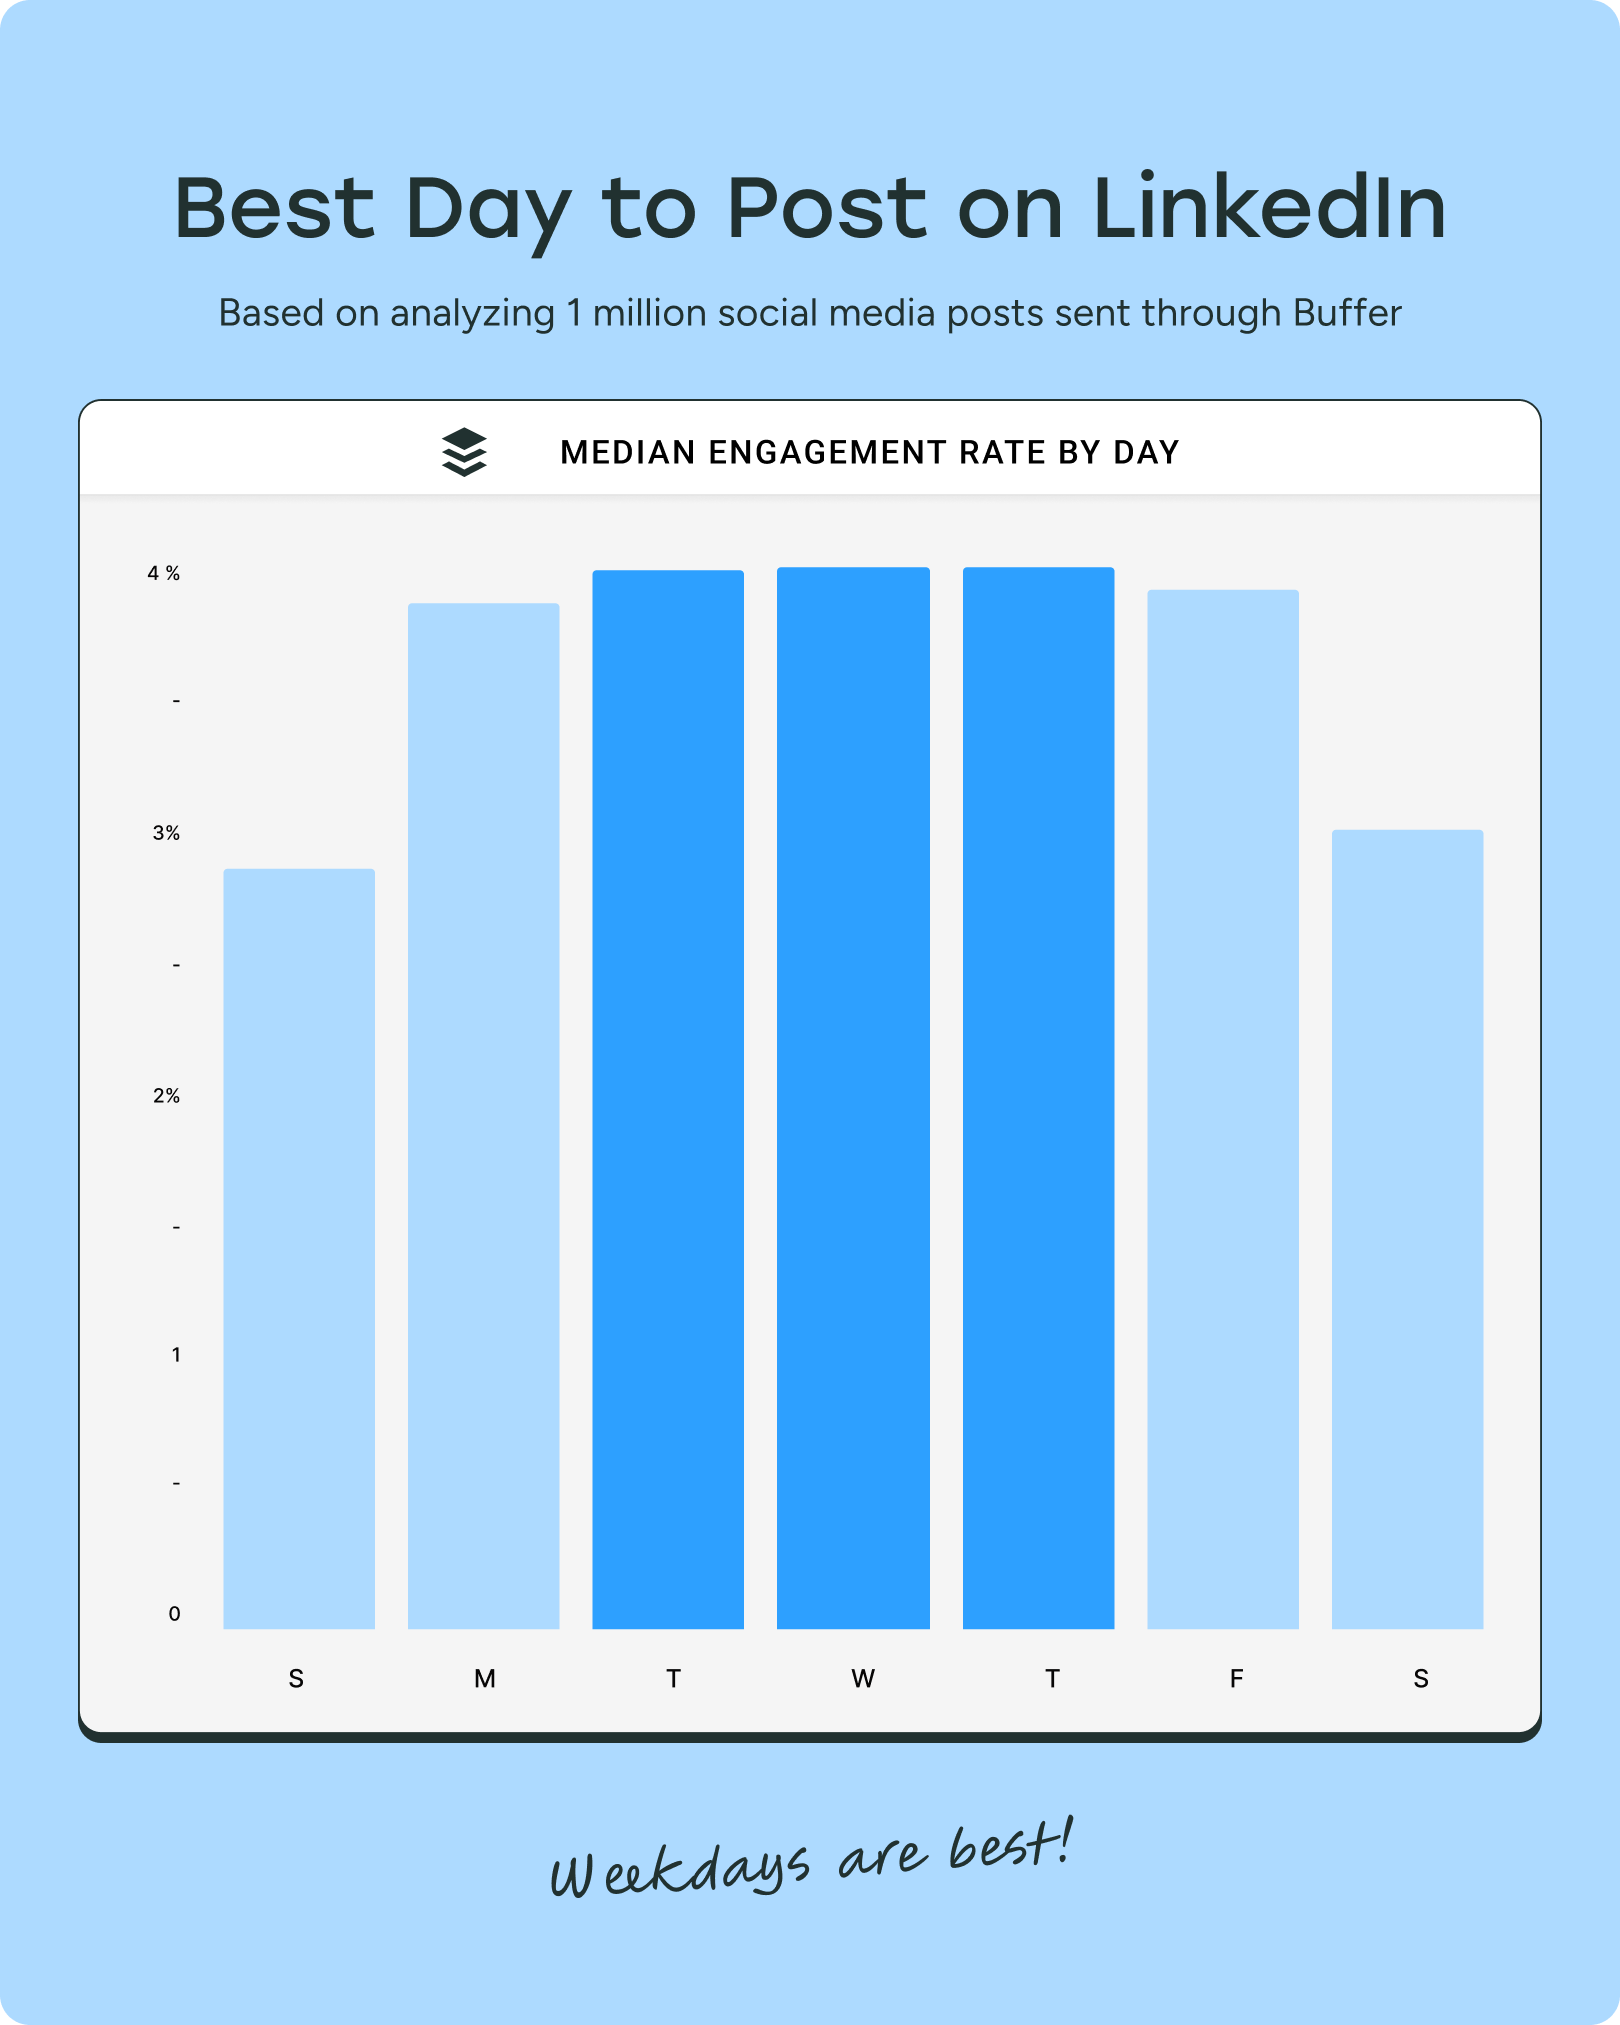
Best time to post on LinkedIn
For LinkedIn, the optimal posting window is 7 a.m. to 4 p.m., with a noticeable spike around 10 a.m. on Tuesdays. Align your content with working hours to reach professionals in discovery mode.
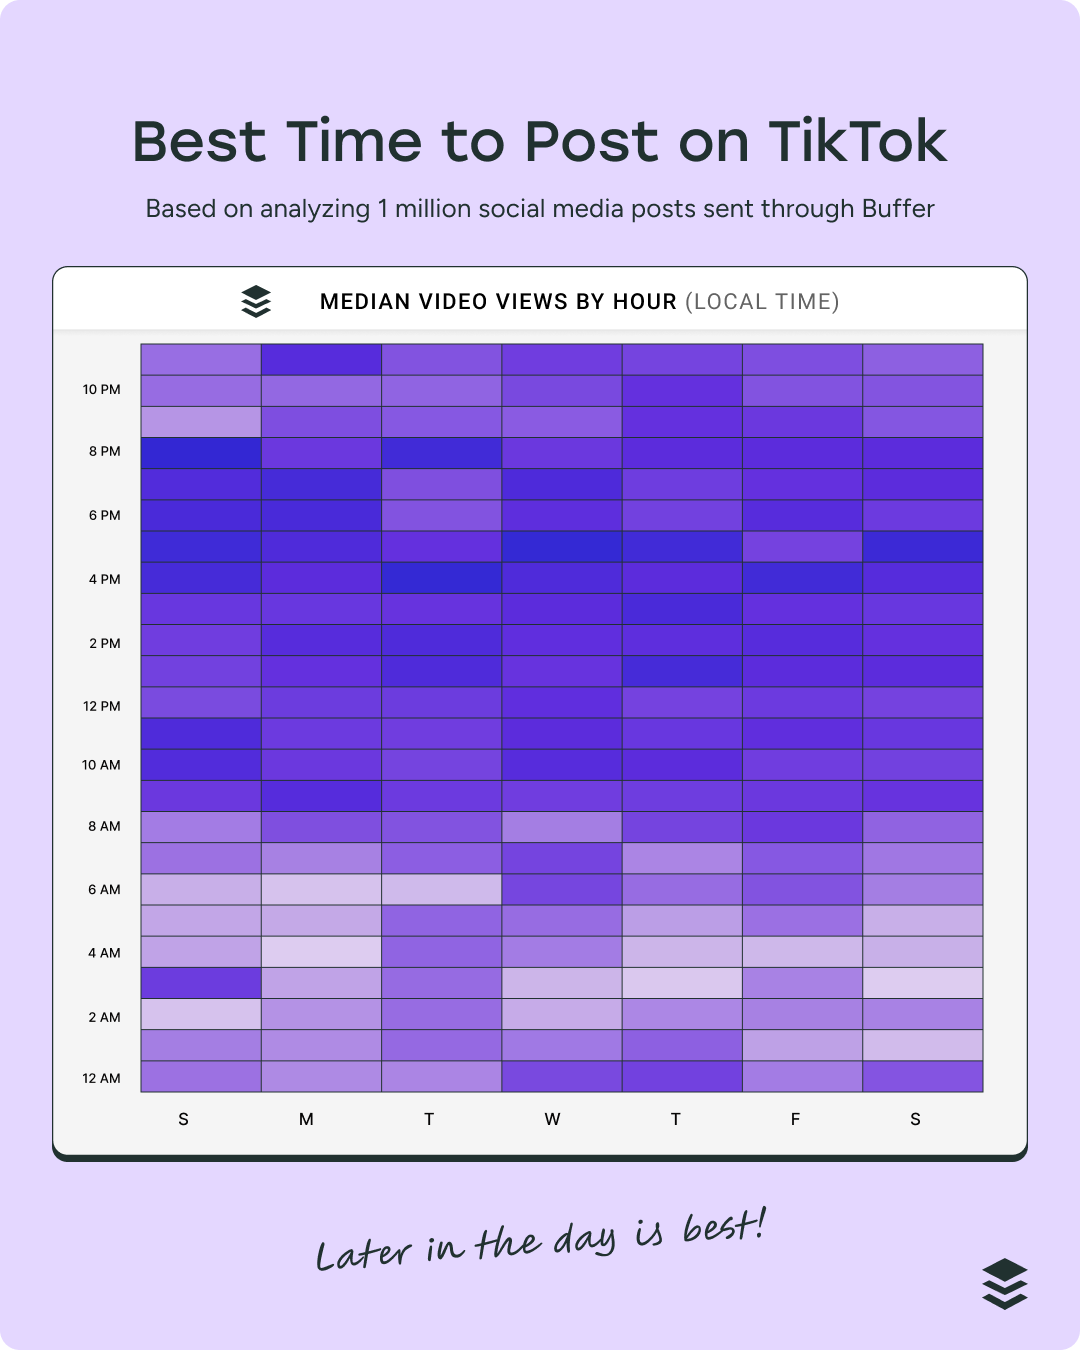
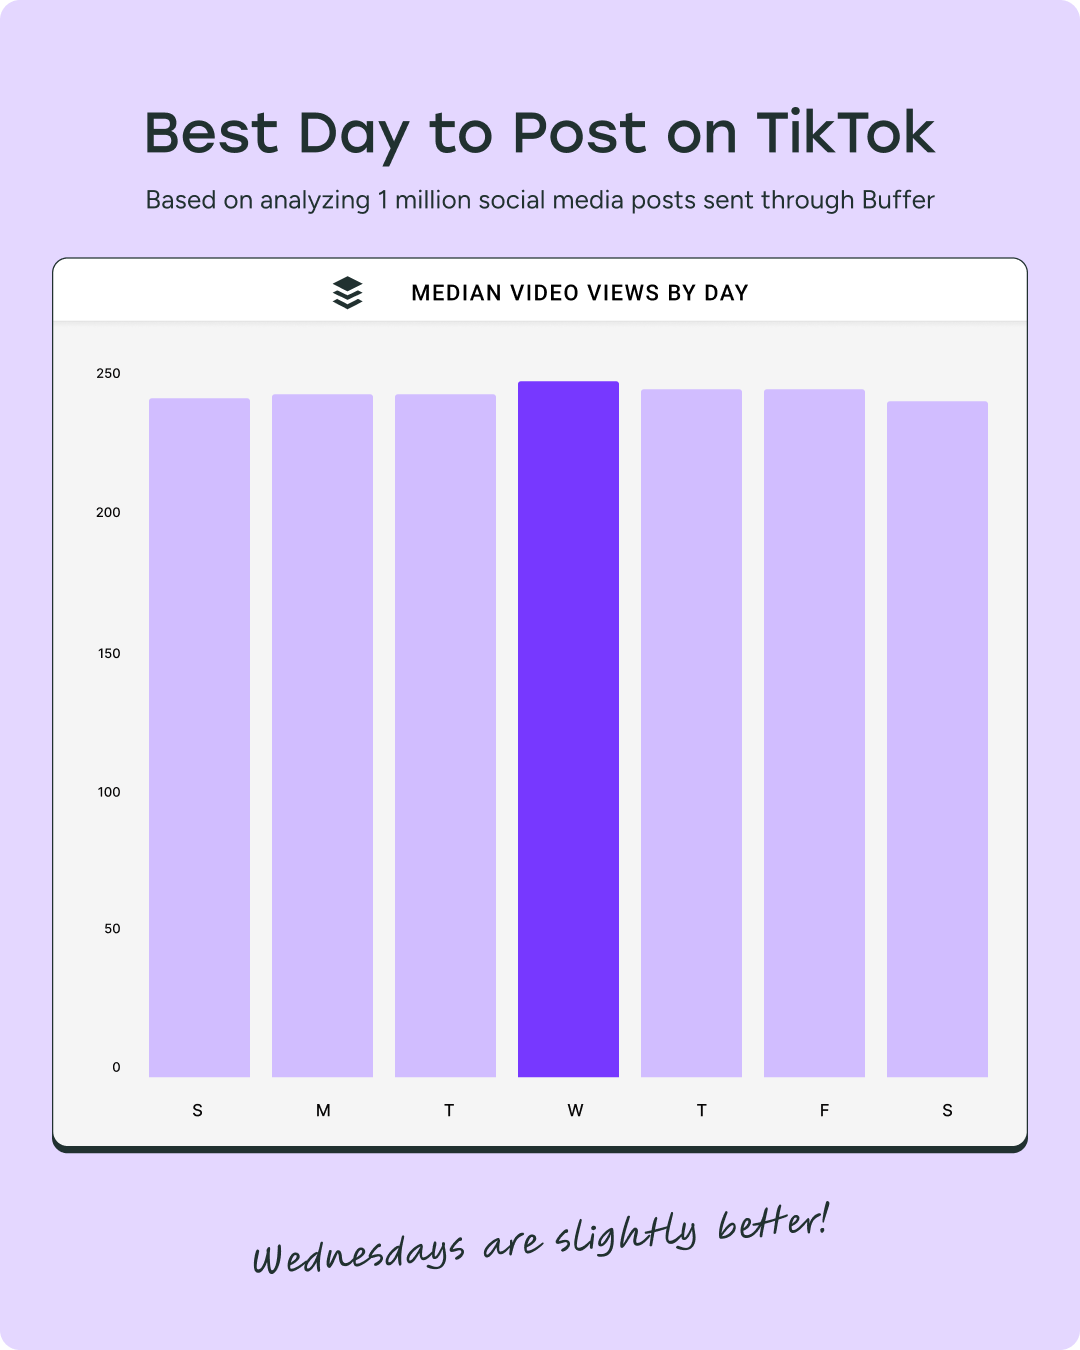
Best time to post on TikTok
TikTok posts perform best when published in the late afternoon to early evening (4–7 p.m.), with Sunday evenings and midweek afternoons standing out. This reflects when users are most likely to watch longer-form video content.
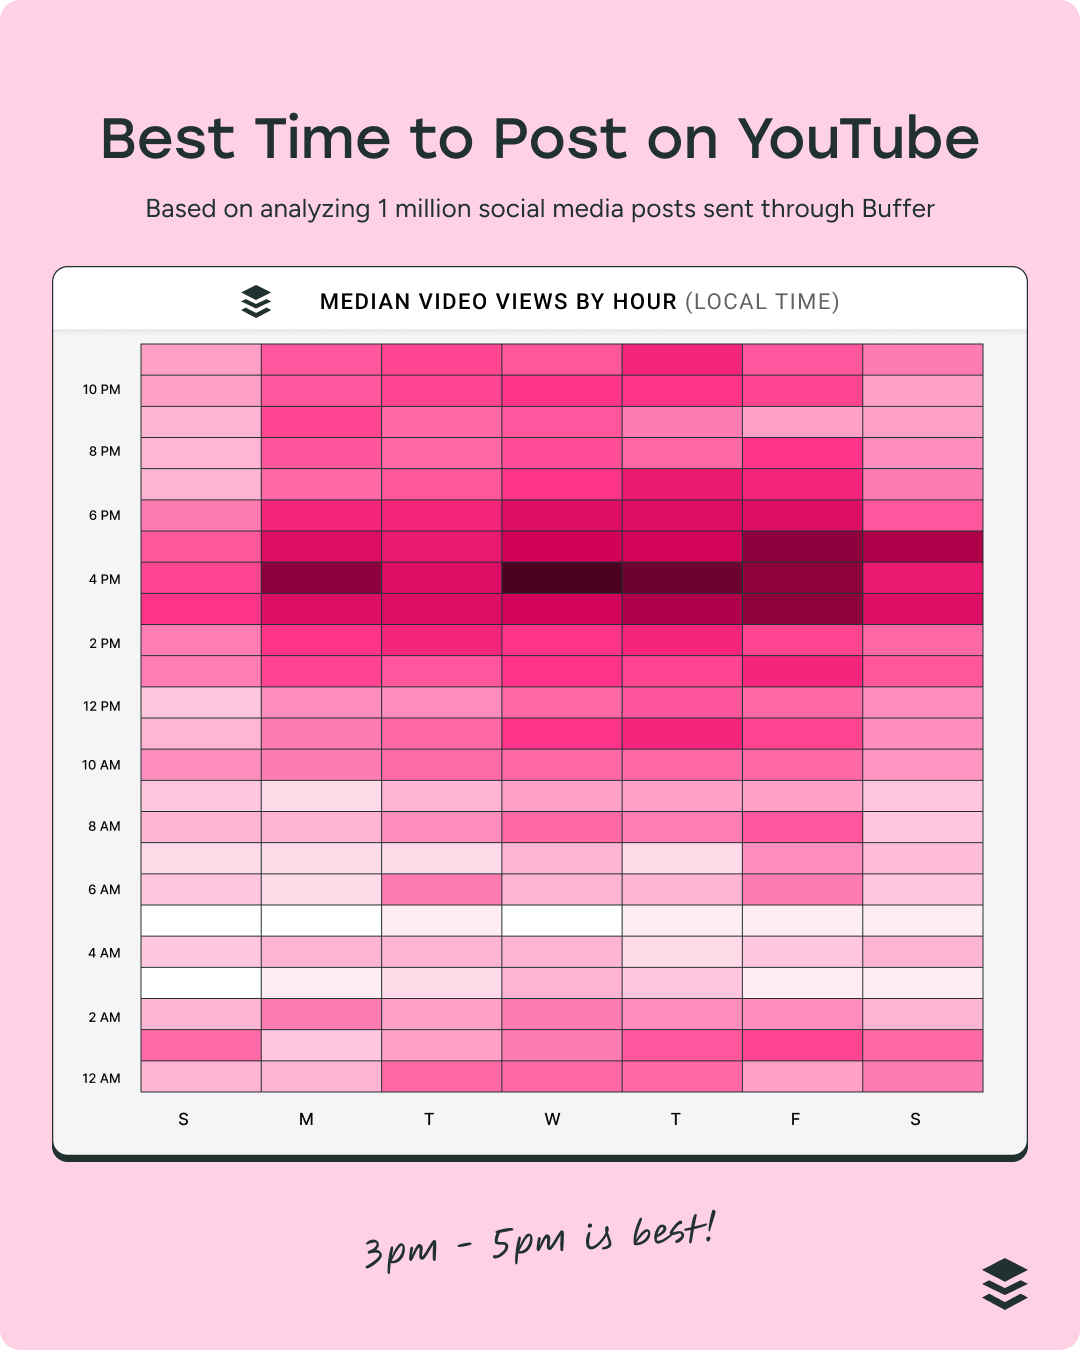
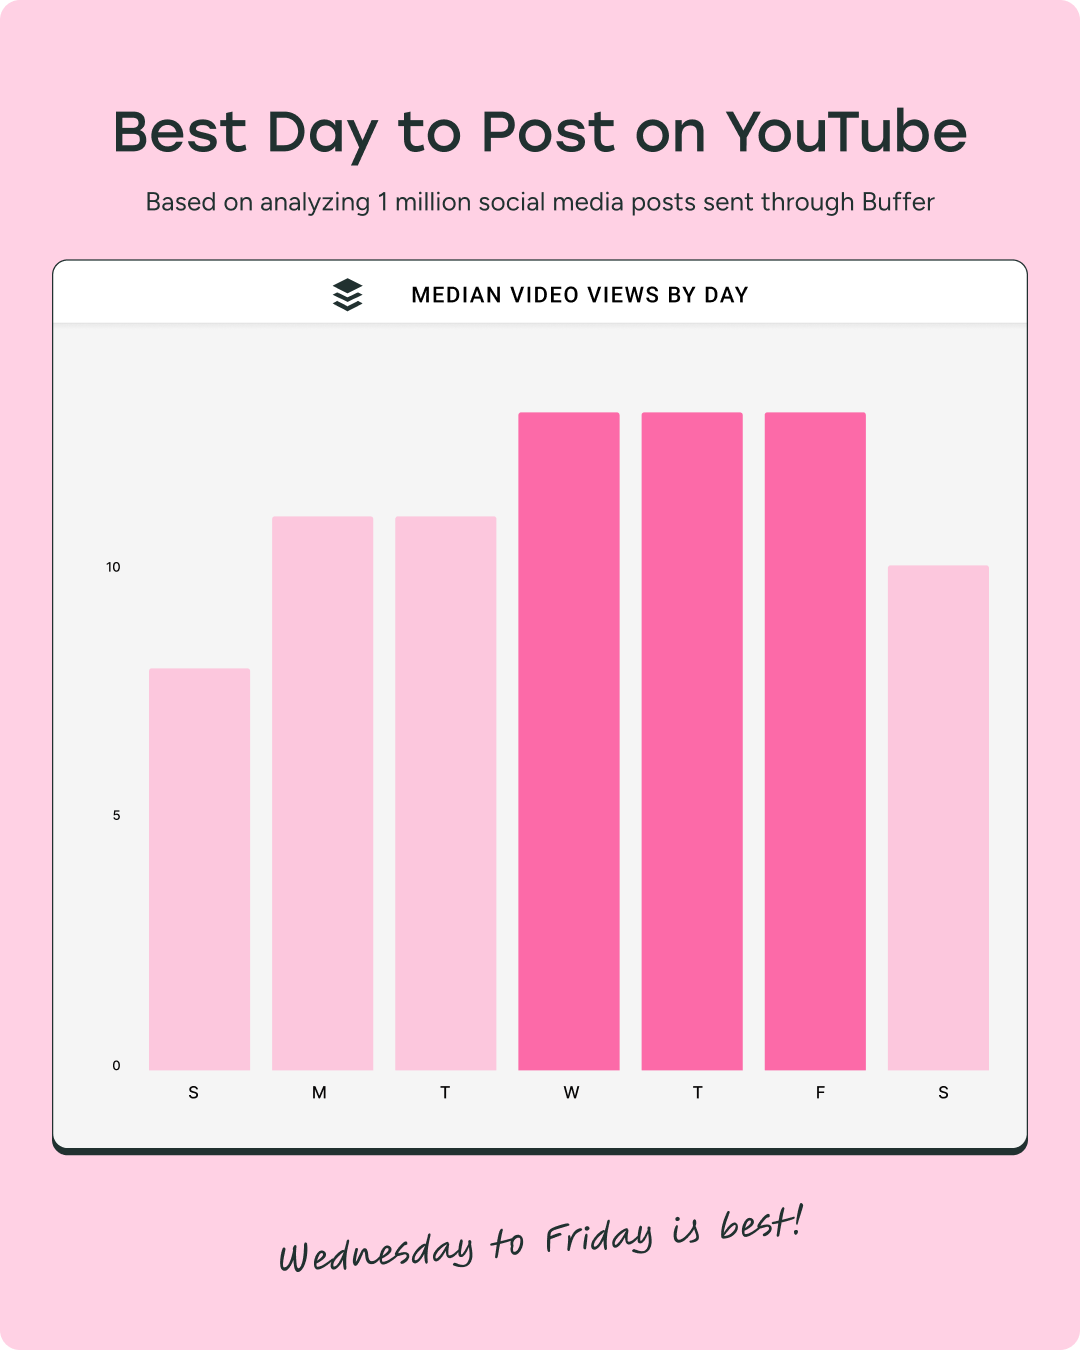
Best time to post on YouTube
The best time to post YouTube Shorts is between 3–5 p.m., especially on Wednesdays, Thursdays, and Fridays. Posting ahead of peak watch hours boosts initial reach and retention.
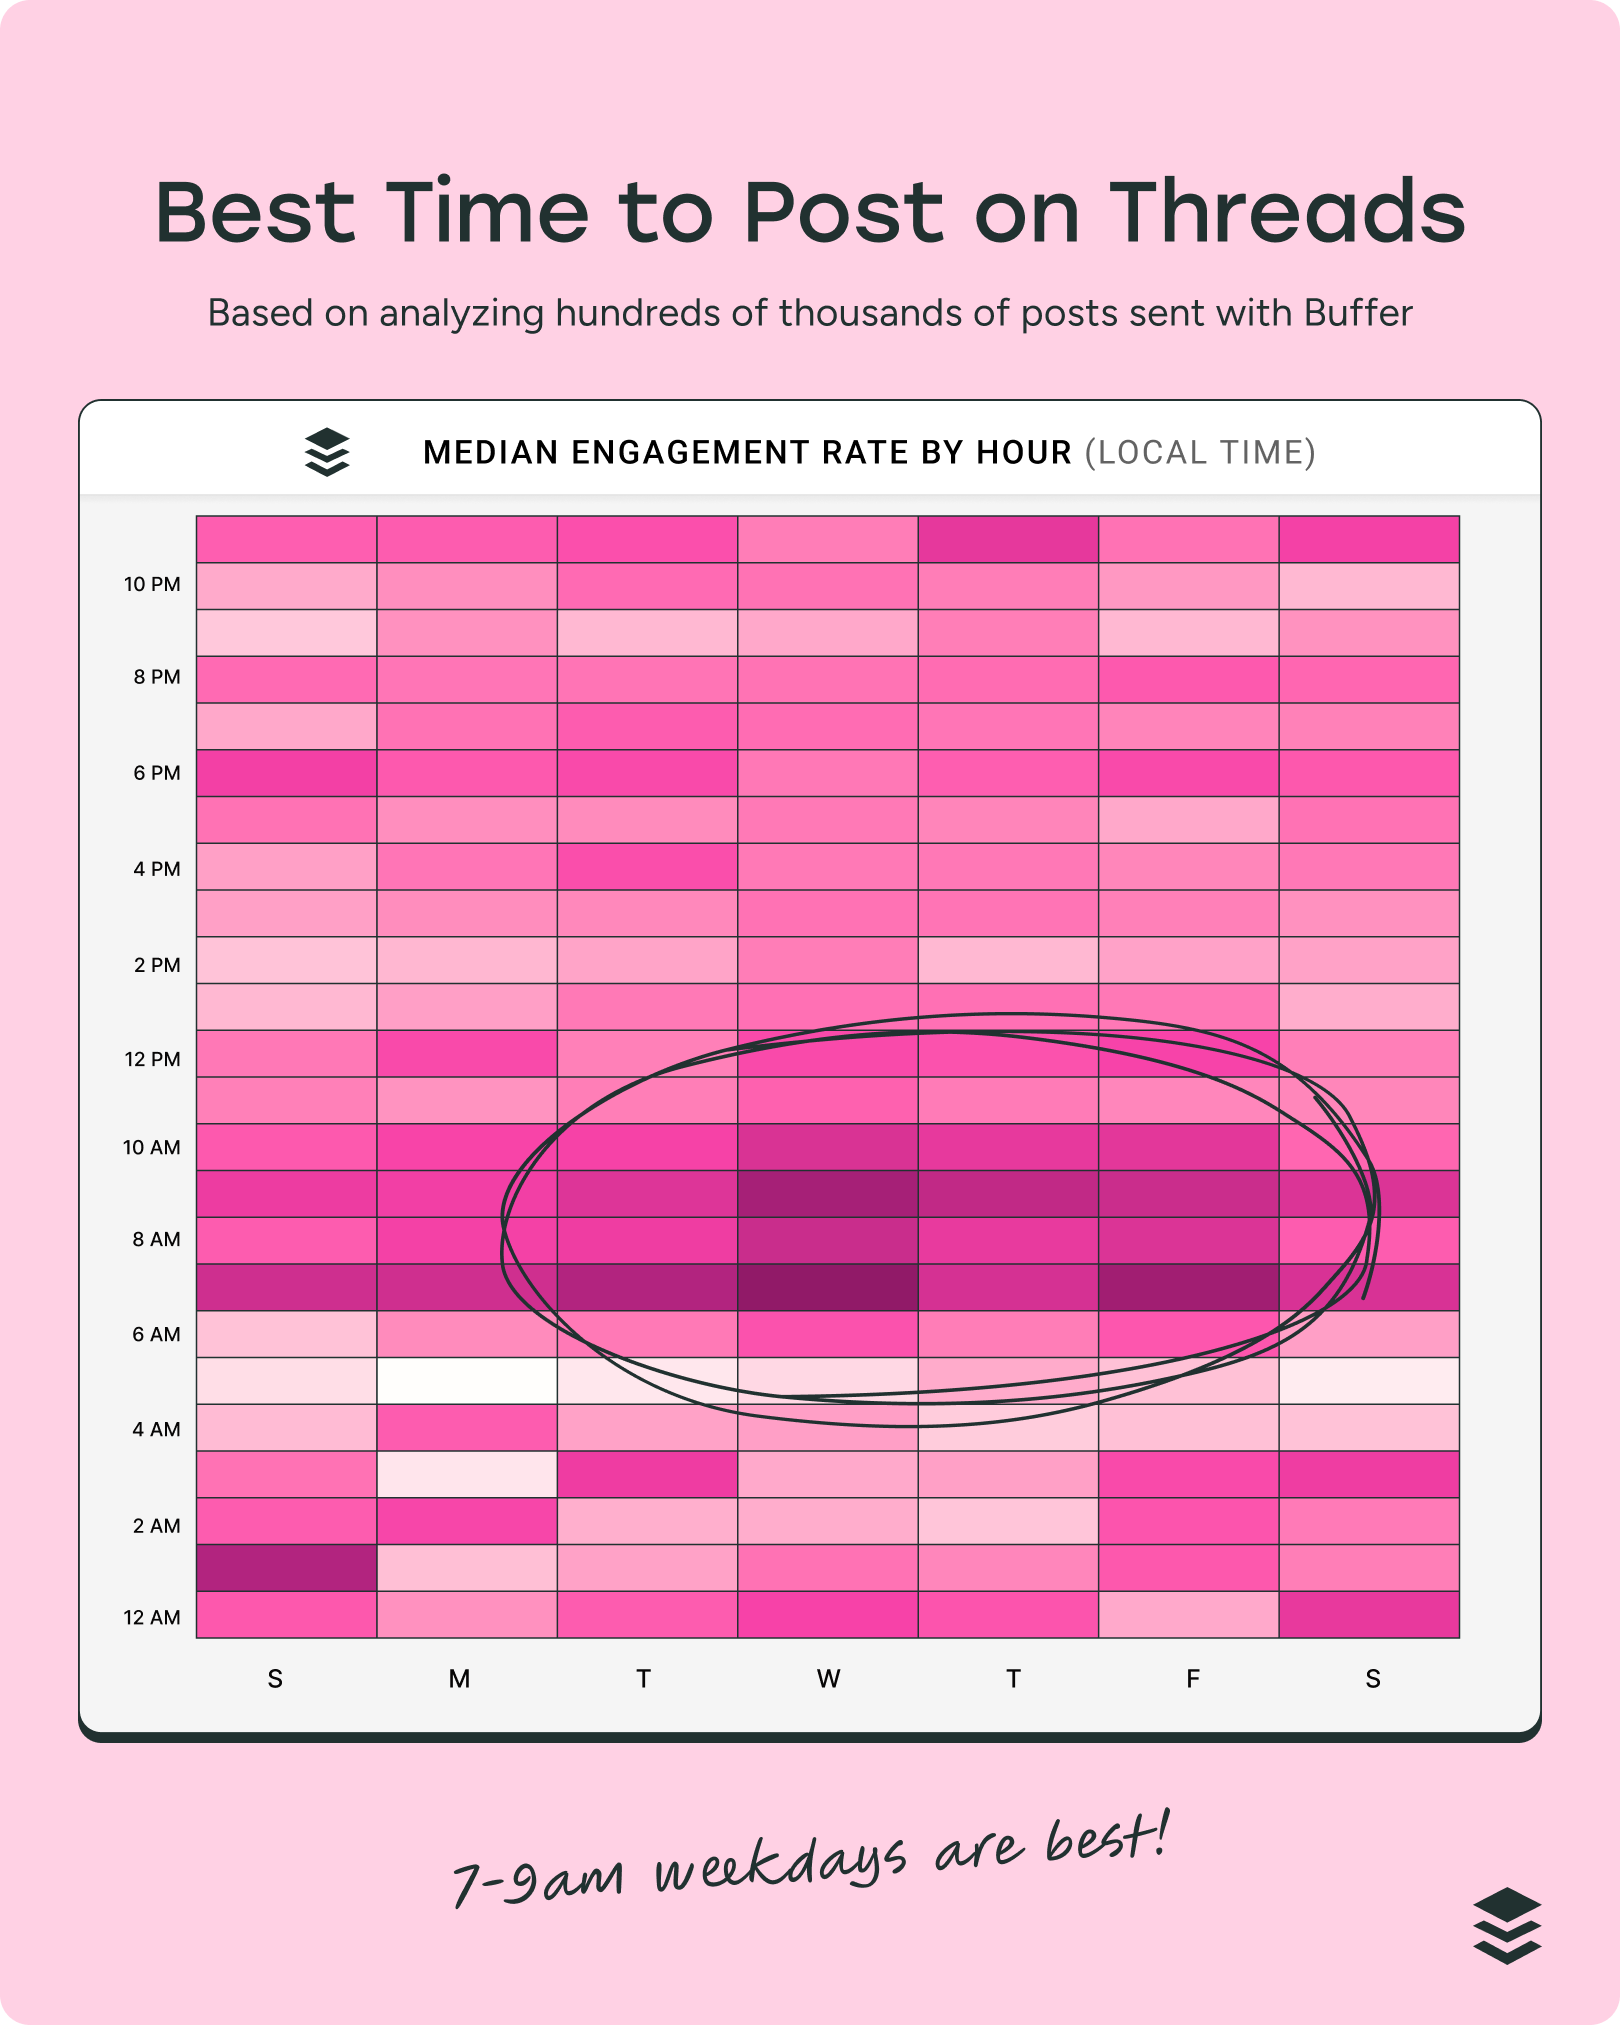
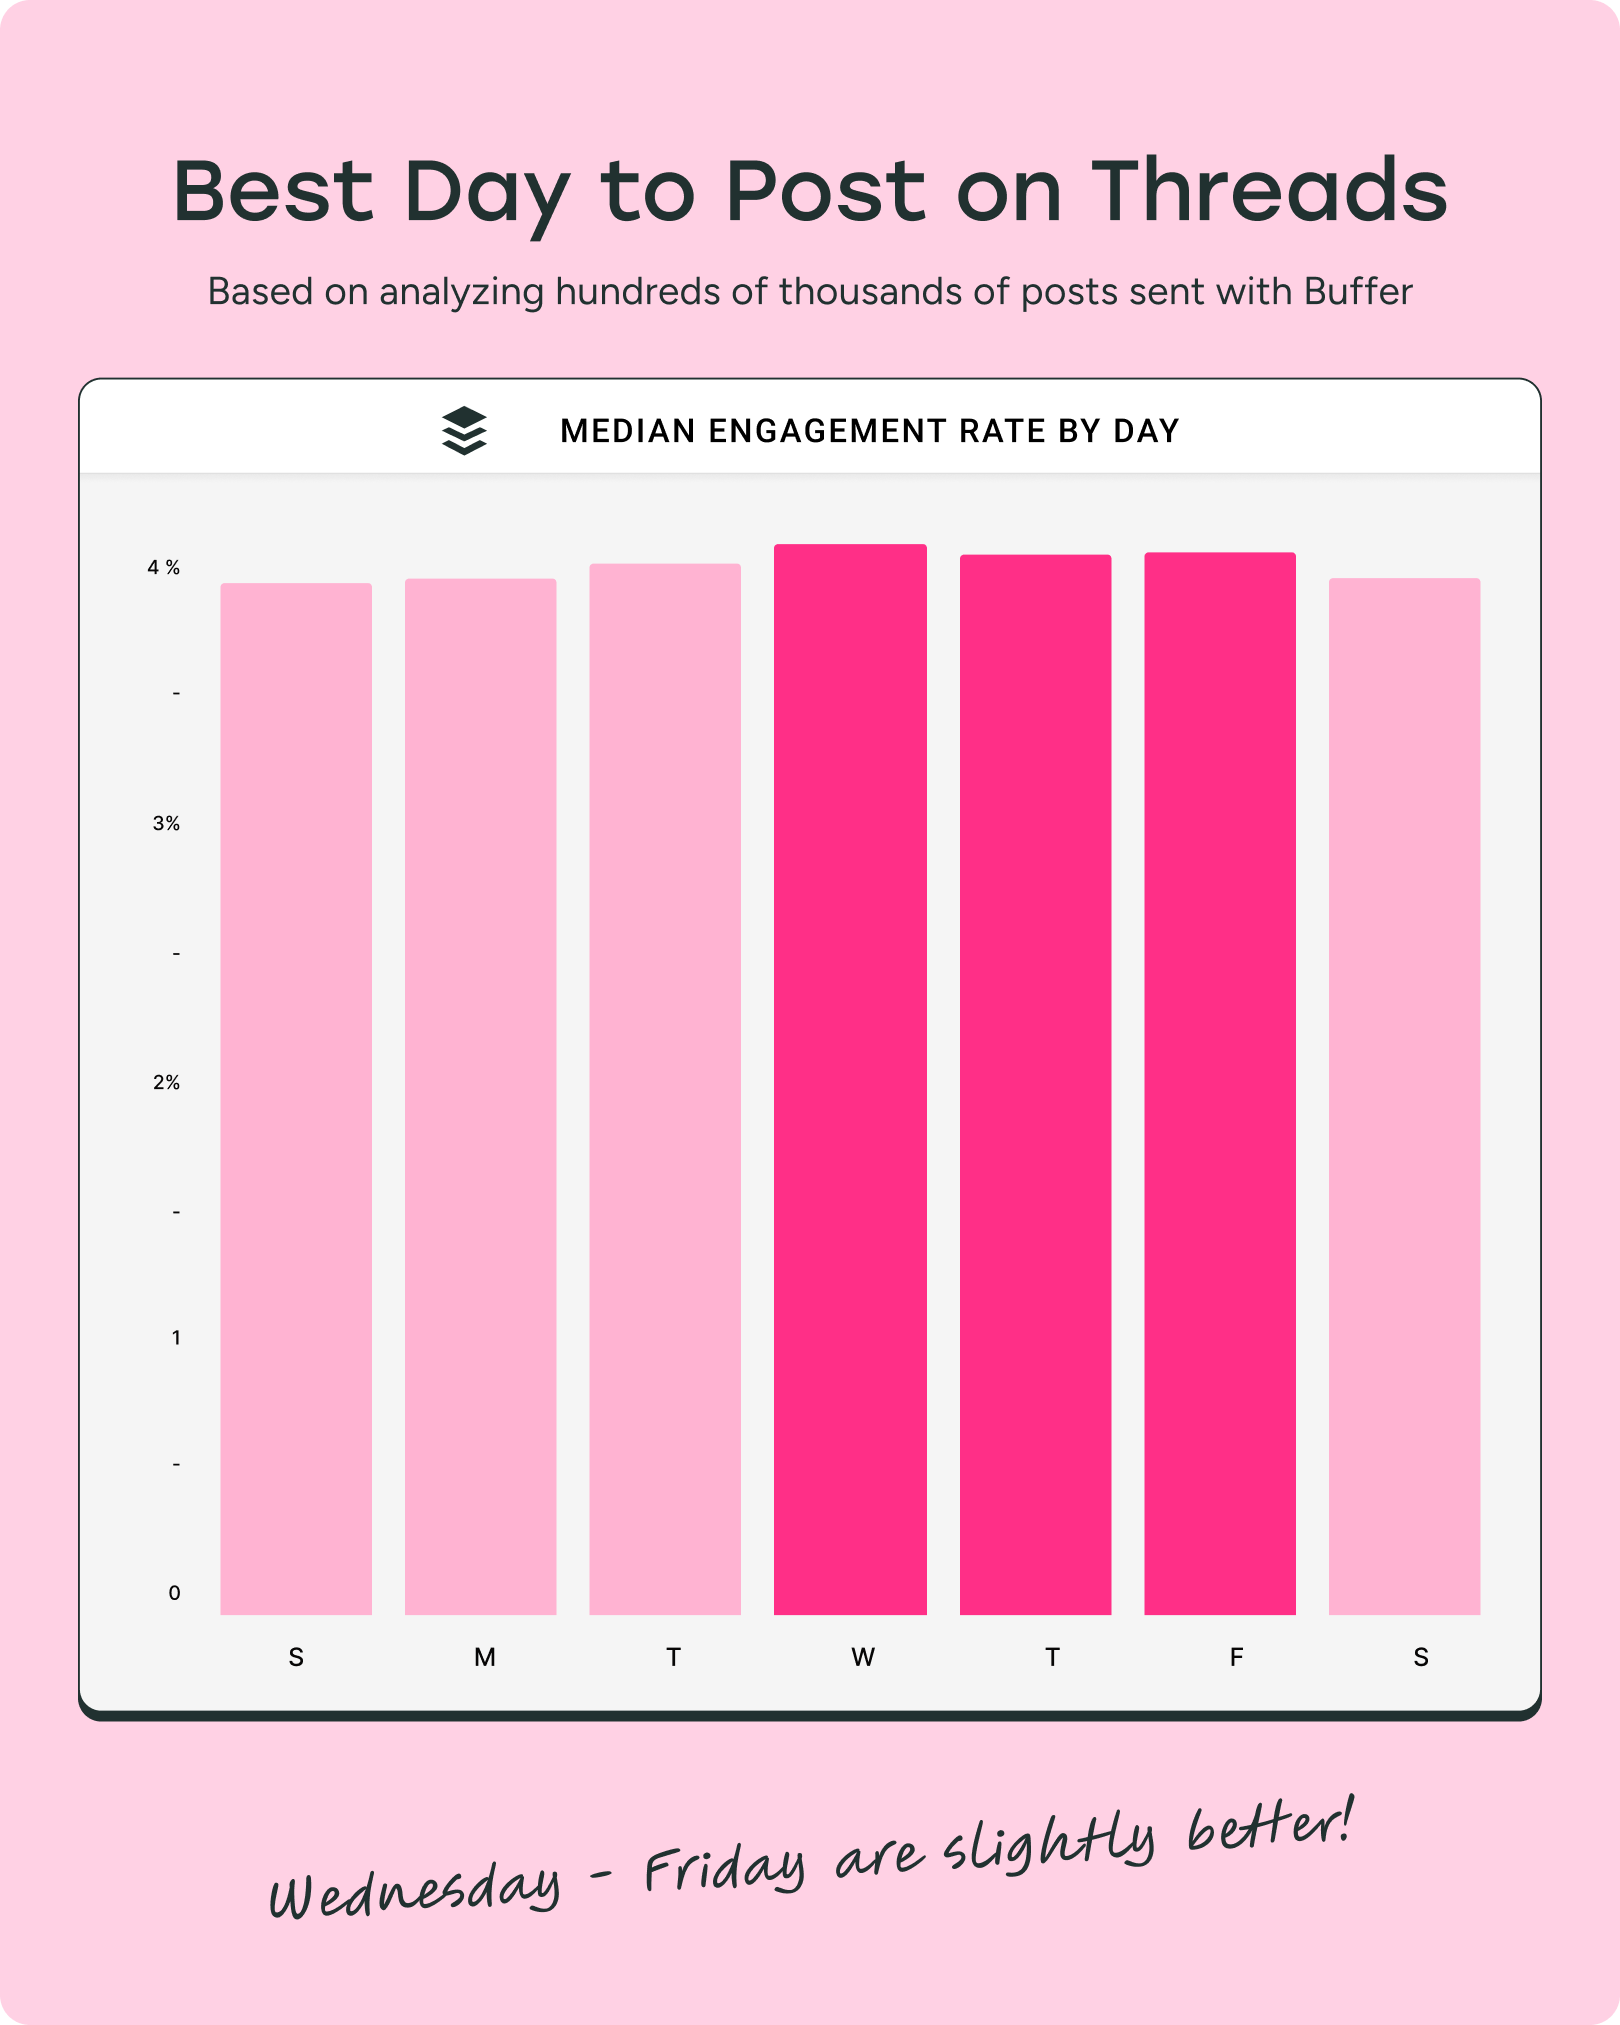
Best time to post on Threads
Threads sees strong engagement between 7–9 a.m., with an interesting spike on Sundays at 1 a.m. If you're experimenting with early-morning or overnight content, Threads is worth testing.
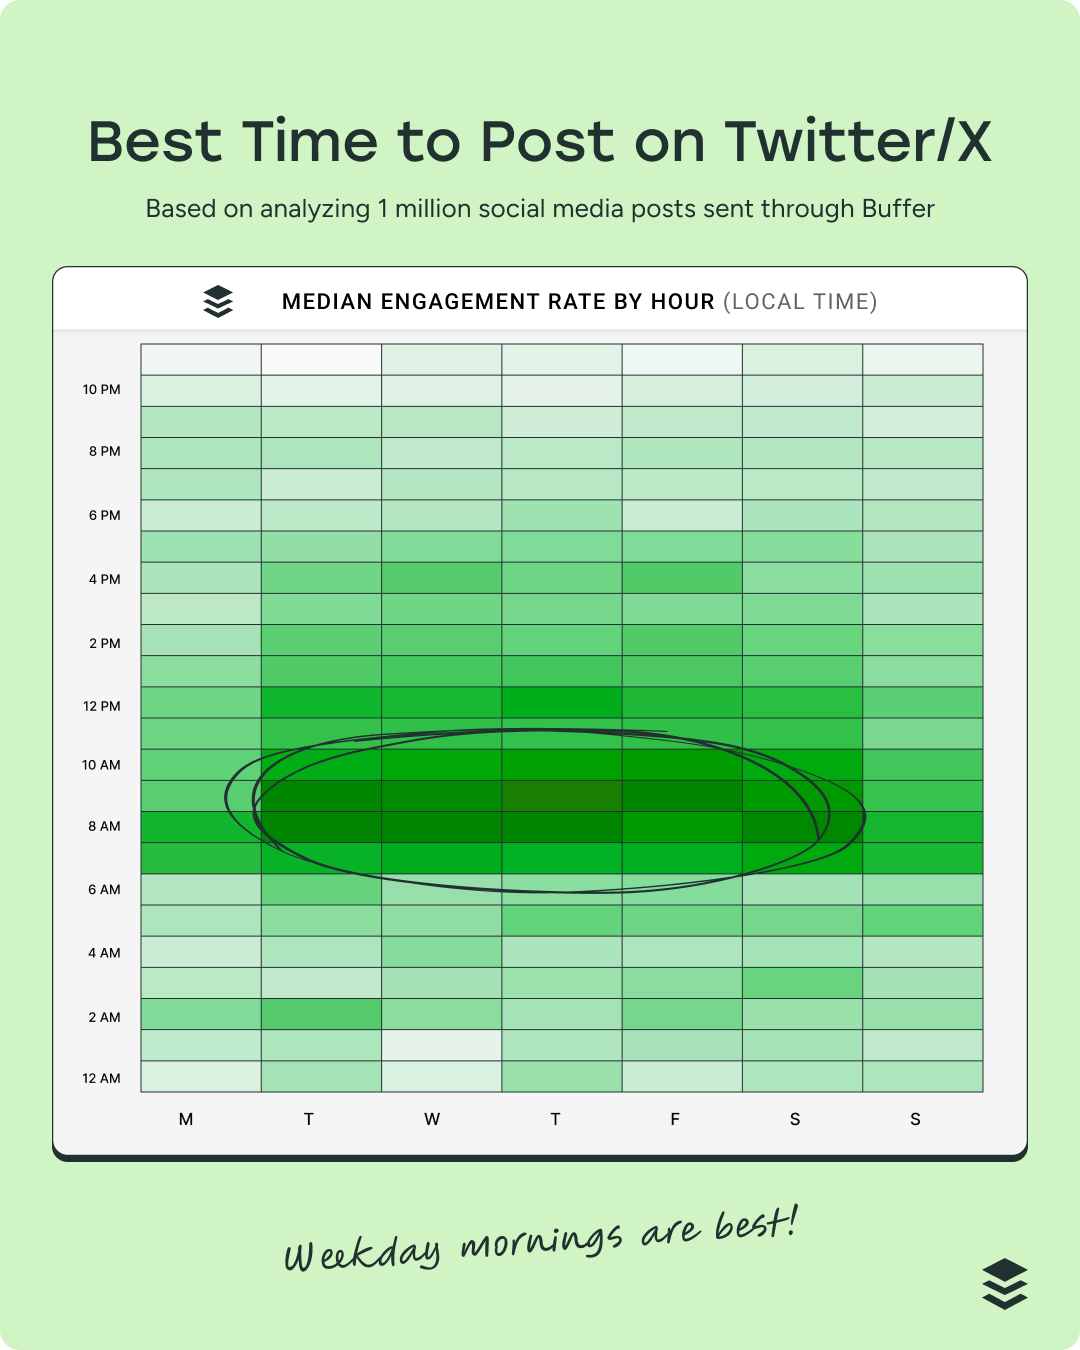
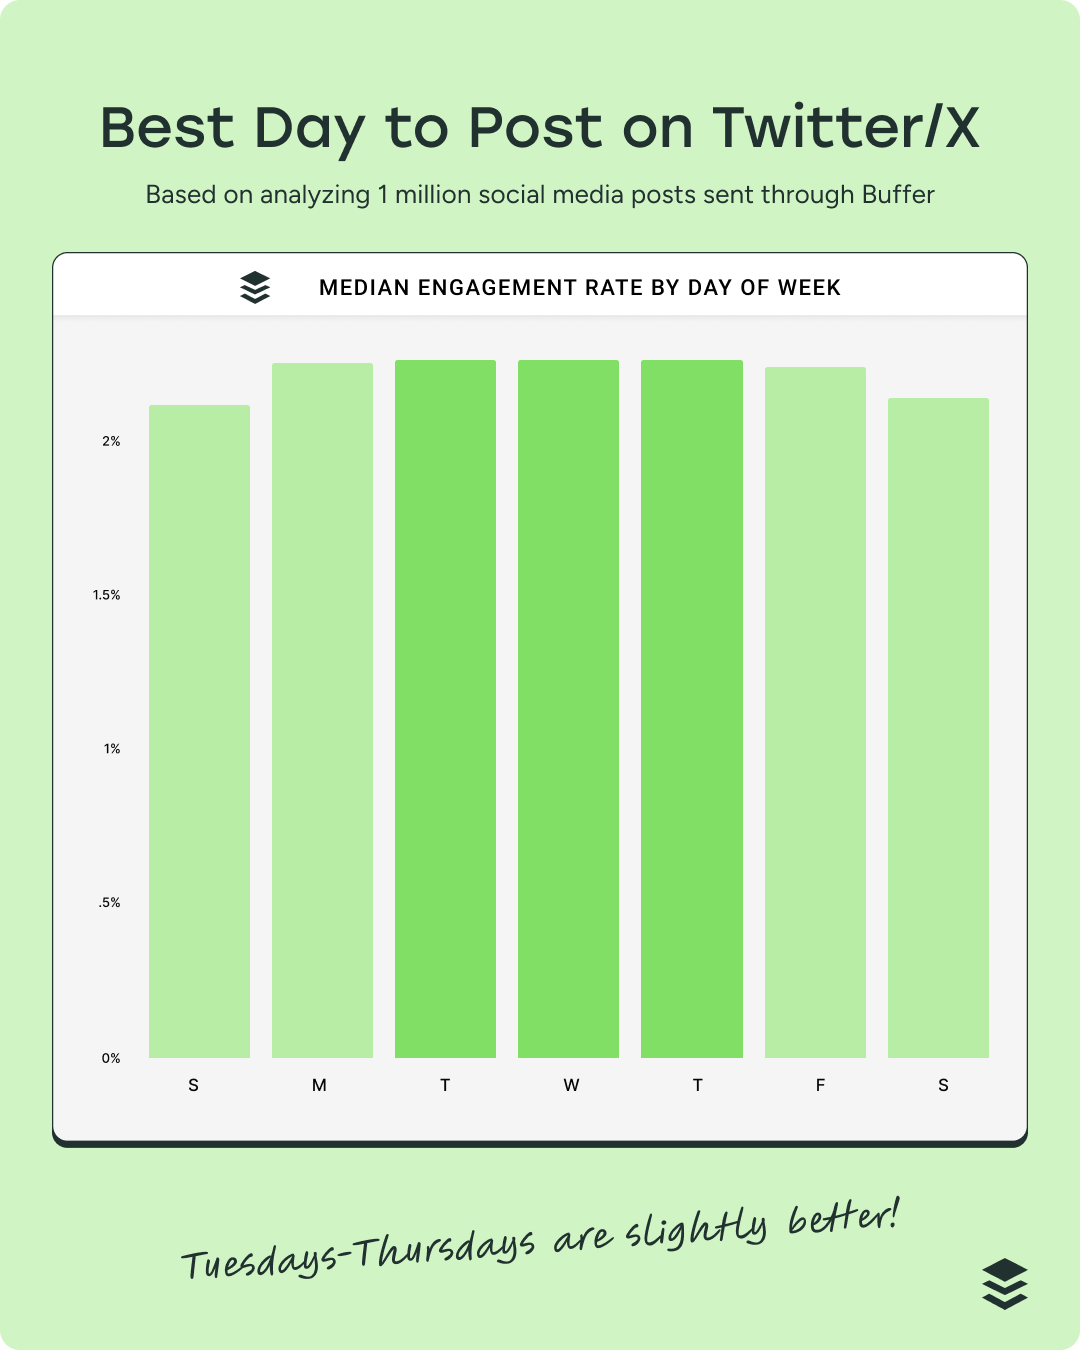
Best time to post on X (formerly Twitter)
The ideal posting window on X is 8–10 a.m., with Wednesdays and Tuesdays seeing the highest engagement. Timely, text-driven posts tend to perform best during these early-day moments.
📌 What does the data mean for you?
- There’s no one-size-fits-all time — each platform shows its own rhythm. Audience habits vary, and midday or evening spikes can differ by platform.
- Weekdays win — weekends generally underperform across all platforms.
- Early to mid-mornings and mid-afternoons to early evenings are prime posting windows — aligning with routines like commutes, breaks, and winding down.
- Use these times as benchmarks — but don’t skip testing. Your unique audience may respond differently, and your own data is the best source of truth for reveal your best times.
More data coming soon
We’re always testing and publishing new reports based on real platform activity. Keep an eye on the latest findings to stay updated on our latest updates.
Try Buffer for free
200,000+ creators, small businesses, and marketers use Buffer to grow their audiences every month.