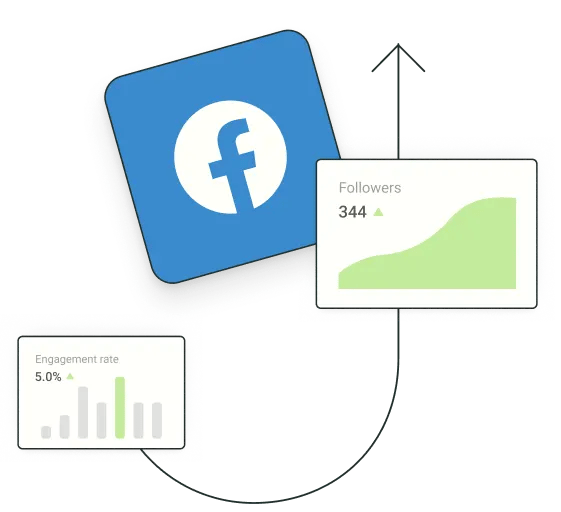
Average Facebook follower growth rate All
The average number of followers gained during the month relative to the previous month.
See how your content compares to over 200,000 other creators and teams. We’ve analyzed millions of organic posts to help you make smarter, data-driven decisions to grow your audience and increase engagement on Facebook.
We calculate our benchmarks using aggregated data from over 52 million posts from 213,000 active Facebook accounts, which have generated more than 6.9 billion engagements.
Last updated July 5, 2026
Filtering benchmark data to show accounts with a similar size to yours will provide a more accurate comparison of your content performance.
The rate at which your Facebook following grows is a good indicator of whether your content is resonating with your audience. Growth below the average suggests you might need to rethink your content strategy.
The average number of followers gained during the month relative to the previous month.

You don’t need a big budget to build a big audience. Use these smart strategies to get more followers on Facebook, starting today.
How often are creators posting each month, and how does consistency impact Facebook growth? If your posting frequency is at or below the average and you’re not seeing strong results, try increasing your cadence to boost reach, engagement, and followers.
How many times Facebook creators post within a given month, broken down by how quickly their follower counts are growing.
A massive analysis of more than 100,000 Buffer users revealed just how much posting consistently can boost engagement per post.
Every click, comment, reaction, and share counts. Facebook’s algorithm views engagement as proof that your content is resonating. More engagement leads to wider reach and, in turn, better chances of growing your audience.
Select chart type
The median number of clicks, comments, reactions, and shares on all Facebook post types, including those with video, links, images or only text.

In this article, learn how you can join the ranks of these Facebook-famous brands and increase engagement on Facebook.
The wider your reach, the more opportunities you have to build an audience. Strong reach means Facebook’s algorithms are actively surfacing your content.
Select chart type
The median number of unique users reached by all Facebook post types, including those with video, links, images or only text.

Is there a secret to getting your content seen by as many people as possible? Here’s everything we know about how the Facebook algorithm works and how you can get your content the reach it deserves.
A benchmark is a standard that you can measure your own performance against. At Buffer, we’ve analyzed the performance of millions of organic Facebook posts and accounts to find the average and median performance (benchmarks) for various follower tiers for important metrics like follower growth, engagement rate, and posting frequency. Our goal is to help you on your own Facebook journey by letting you see how others are doing.
Buffer measures engagement by counting the number of clicks, comments, reactions, and shares a Facebook post receives.
Our benchmarks are derived by analyzing post performance data from over 52 million Facebook posts created by more than 213,000 distinct Facebook accounts connected through Buffer.
Our data is updated with new benchmarks each month so you can be sure you have the latest numbers to compare against. Learn more about our research and analysis methodology for uncovering social media insights.
All Buffer accounts contribute to Benchmarks, as outlined in our Terms of Service, excluding internal test accounts and churned accounts whose data has been deleted. However, the data is fully anonymized and aggregated to ensure the privacy of all our users.
Buffer anonymizes all data before calculating Benchmarks. This usage of account data is accepted within Buffer’s Terms of Service.
We use medians for reach and engagement metrics because these tend to have high variance, meaning a few outliers can skew the results. Medians give a more accurate picture of what a typical account experiences on Facebook.
For follower growth, the data showed less variance, so we use averages to better reflect overall trends.