
Instagram Grid Preview Launched + New Signup Experiment Results


Weekly active Awesome + Individual plan users
175,751 +13%
Weekly active
Buffer for Business users
4,905 +6.8%
Buffer for Business
Monthly Recurring Revenue
$534,828 +2.1%
Social updates sent by
Buffer for Business
users
4,247,699 +11.7%
Users starting
Buffer for Business
trials
7,581 +23%
Converted
Buffer for Business
trials
314 +6.4%
Users starting
Awesome trials
50,579 +36%
Converted
Awesome trials
1,591 +7%
Product: Instagram Grid Preview launched, composer improvements in the works
Update by Suprasanna Mishra
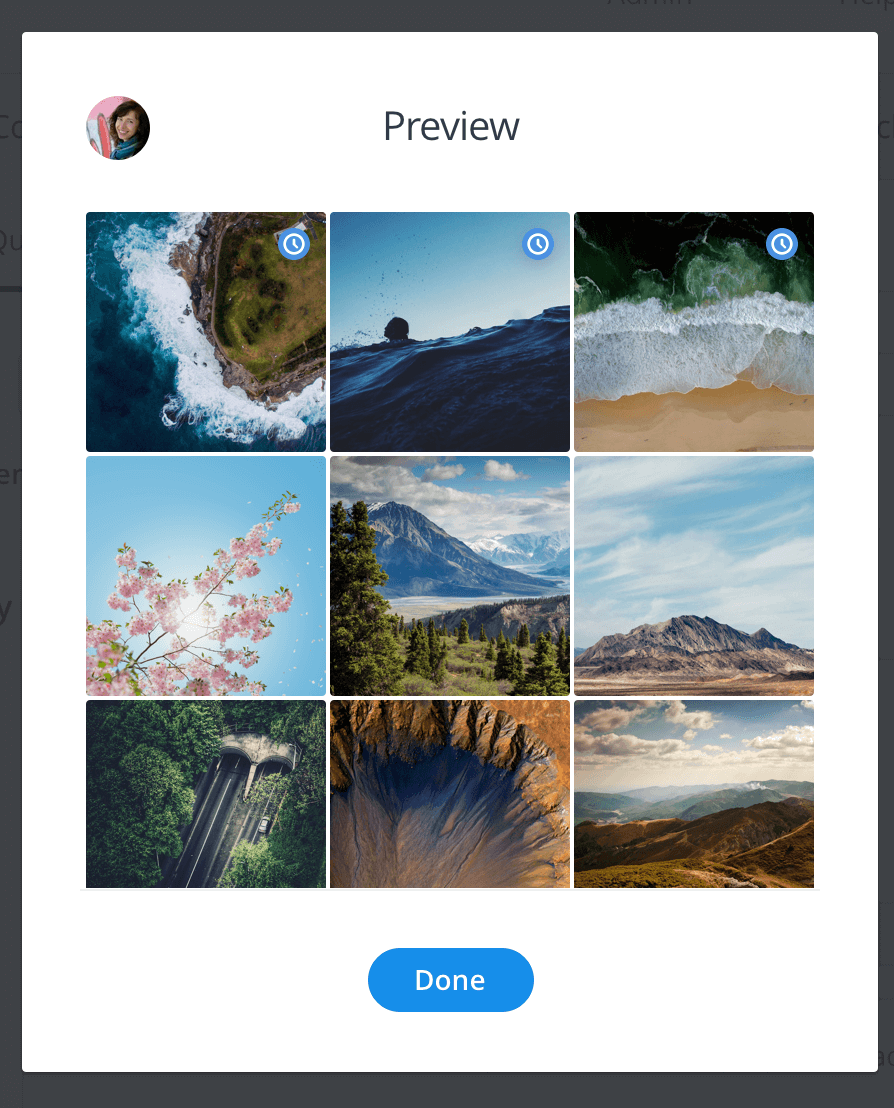
We kicked off January with a bang, launching Instagram Grid Preview for Buffer for Business customers!
If you visit an Instagram profile on the web, you will see a “Preview” button that lets you launch a window to see your past and upcoming Instagram posts all in one place. Then you can rearrange as you’d like in your queue until you get the look you want!
On the extension side, we completely redid our Firefox extension this month to be in line with changes from Firefox. It’s working great!
We also continued working on our new composer experience for the extension — improving our desktop experience for all users. We’ve added a few thousand more users to the current version and so far, so good! In January, we brought over the Power Scheduler to the new composer, started working on a feature to show image dimensions when you’re picking an image for your post and improved the initial loading experience. We’re getting really excited about the feedback and data we’re seeing and can’t wait to get this out there for everyone in the coming months!
We’ve kicked off our design work to bring this same new experience to the Buffer dashboard as well. Our vision is to eventually have all the new functionality everywhere you use Buffer.
Speaking of the Buffer web dashboard, we’ve now added support for uploading multiple images per post for Facebook. We also fixed up a few confusing flows around changing your password and added some clarity around timezone settings.
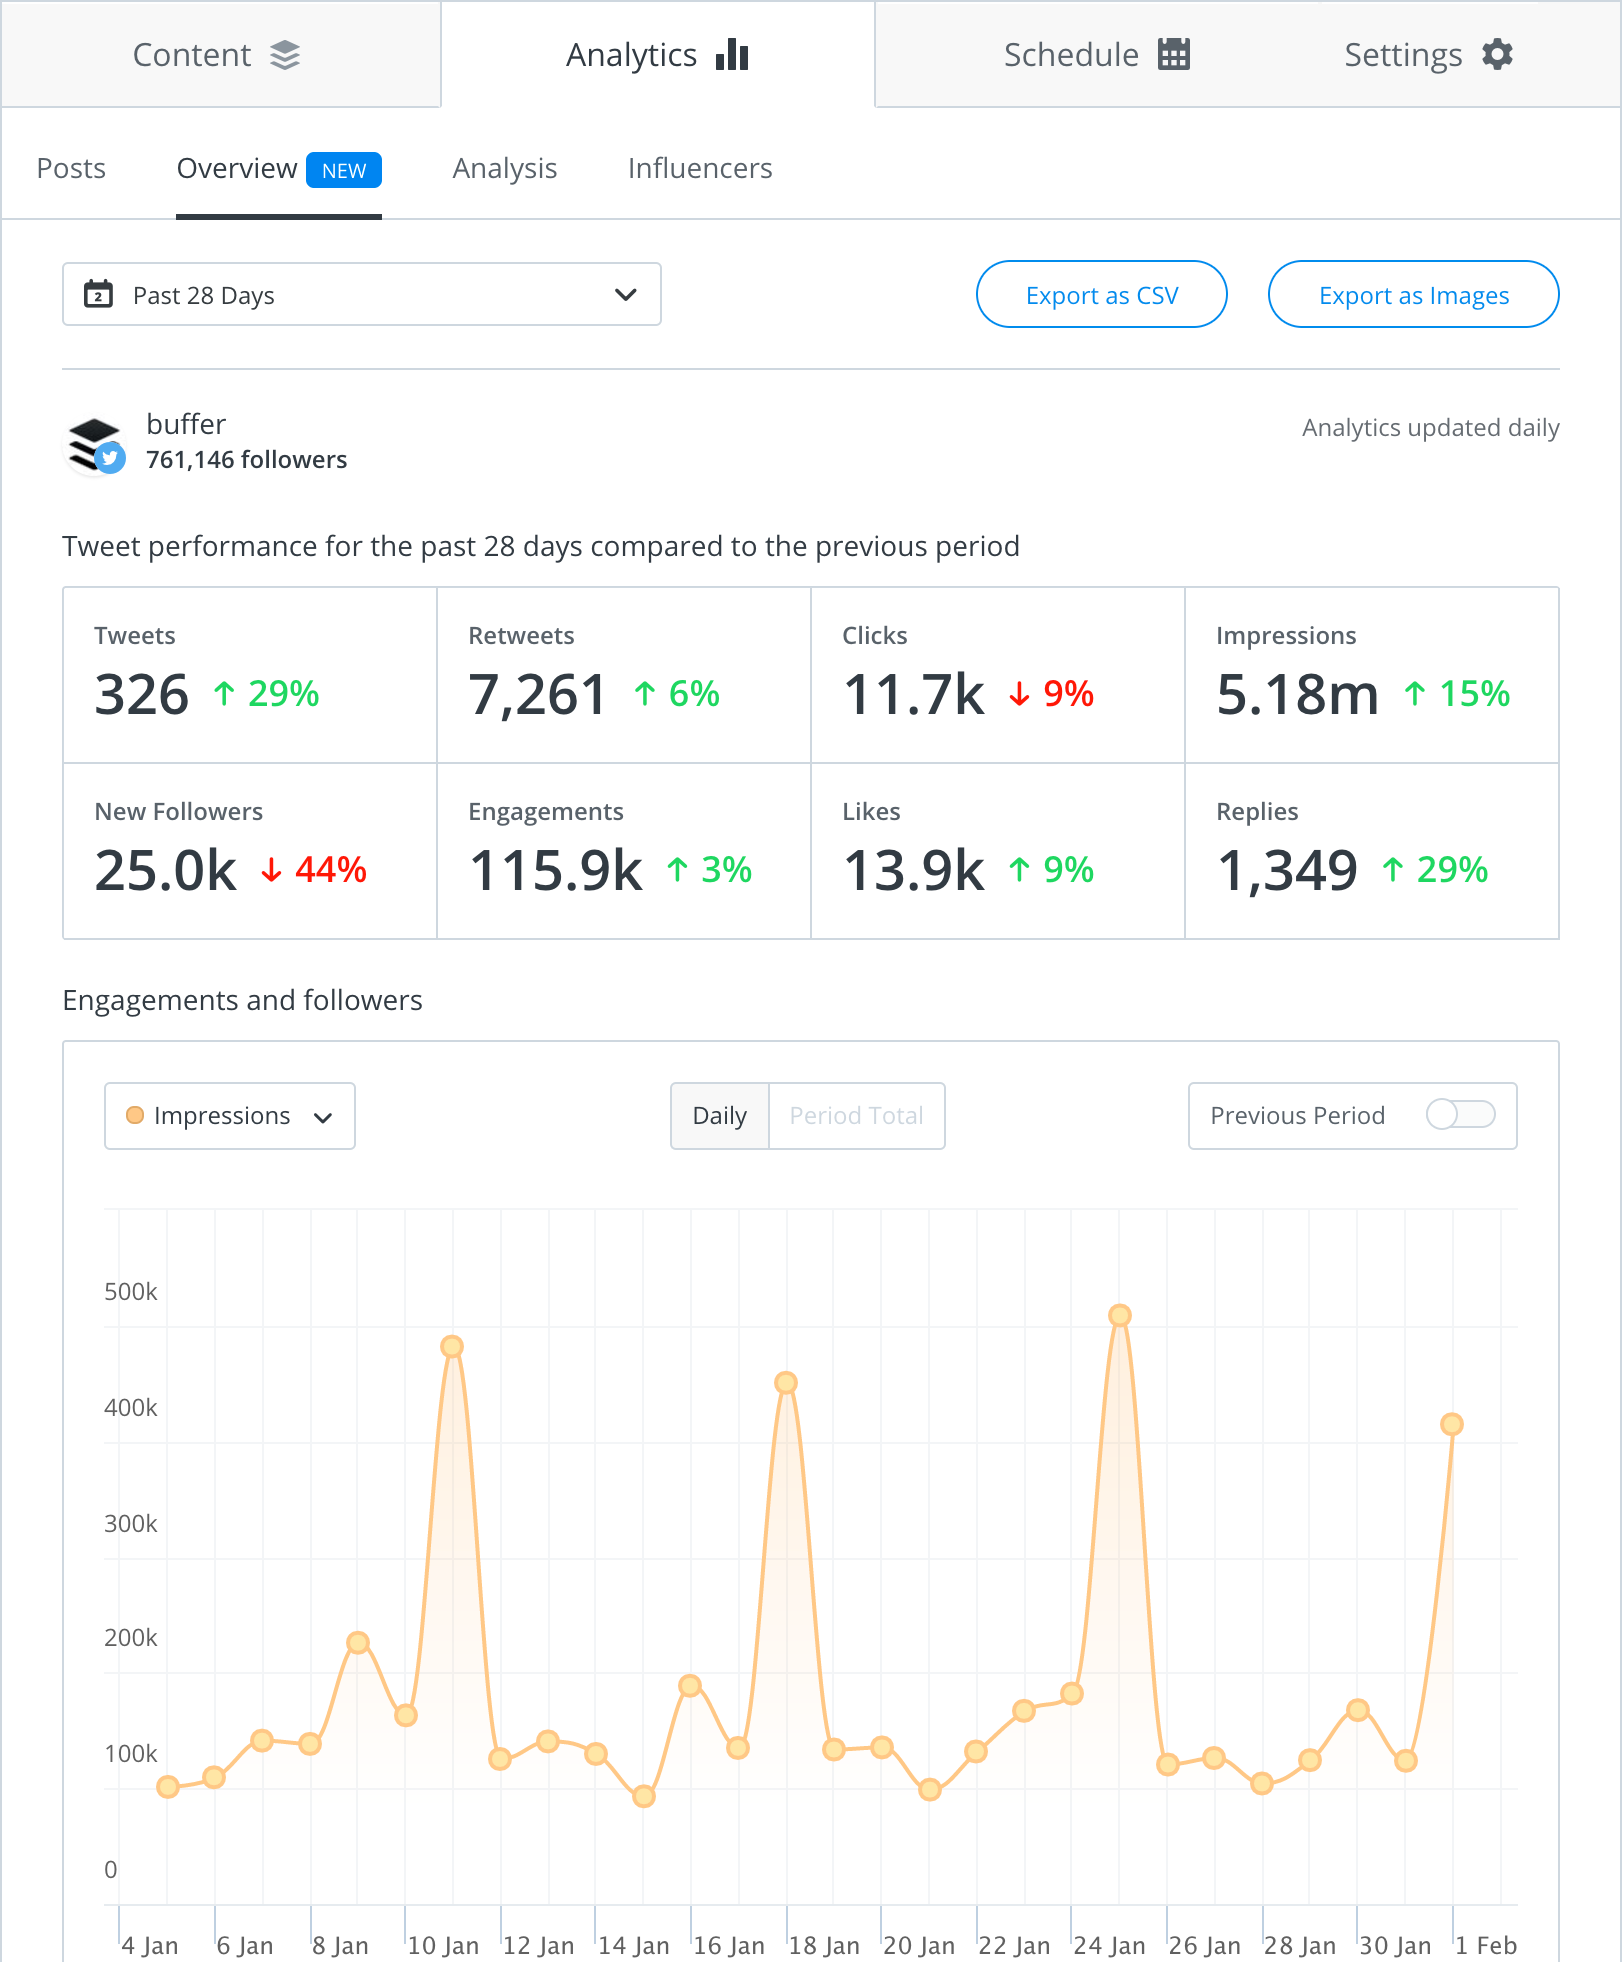
Buffer for Business: Rolling out Twitter Analytics
Update by Tom Redman
We’ve started rolling out new Twitter Overview Analytics, which is much more in-depth than our prior dashboard! As we’re using a new backend technology to collect and process the data for this new overview section, we’re only able to collect data going forward and thus leaving the older Analysis section available for the next several months for historical data.
Eventually, once we’ve collected several months worth of data in the new system, we’ll sunset the Analysis tab. We’ll be sure to give plenty of notice before that happens, and I’m confident that the Overview analytics will quickly become the solution of choice for most reports.
While we continue to rollout these new Twitter Analytics, the talented James Morris and I are starting on product design for the Facebook Overview Analytics. We’re well underway and I’m excited to share more as we create it!
We’re realizing some really strong momentum with the new Collaboration Tool for larger teams to better work together for their social media posting. Two more engineers are pitching in to help us accelerate to the finish line. Steve and Harrison are joining forces with Melissa to help us deliver on the first half of the project we’re affectionately dubbing “Phase 1”. Part of what we’re doing now is setting ourselves up for success in the following phases of the project, which will rely heavily on the technical architecture that’s being developed as part of this phase. We’re getting to the point where we’ll be performing several product reviews in the coming weeks, so keep an eye out for more on this one!
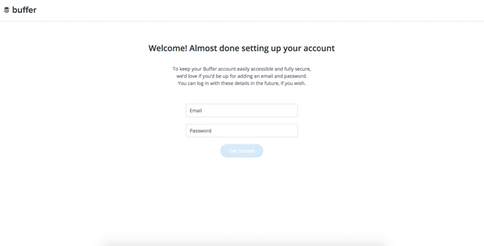
Growth: New sign-up flow shows higher activation
Update by Maxime Berthelot
In an effort to improve our onboarding, we’re experimenting with asking every new customer to provide an email (it’s part of the new flow we put into place last month!)
This way, new customers will have uninterrupted access to their dashboard when they reach it for the first time (which works best with an email/password combination.)
After a month of this new flow, 30,000 users have been involved in this experiment, with roughly 14,500 users in our test group.
- Control Group: 65% of newly signed-up users added their email (which was our goal!)
- Test Group: 85% of newly signed–up users added their email
So how did these users’ experiences differ once they got into Buffer?
Generally, an activated user scheduled at least 3 posts in her first day. Our global activation metric is around 20%, so anything above that would mean we’ve made some great progress to give the user a better, more engaging experience.
- Control group daily activation rate: : 19%
- Test group daily activation rate: 24% ?
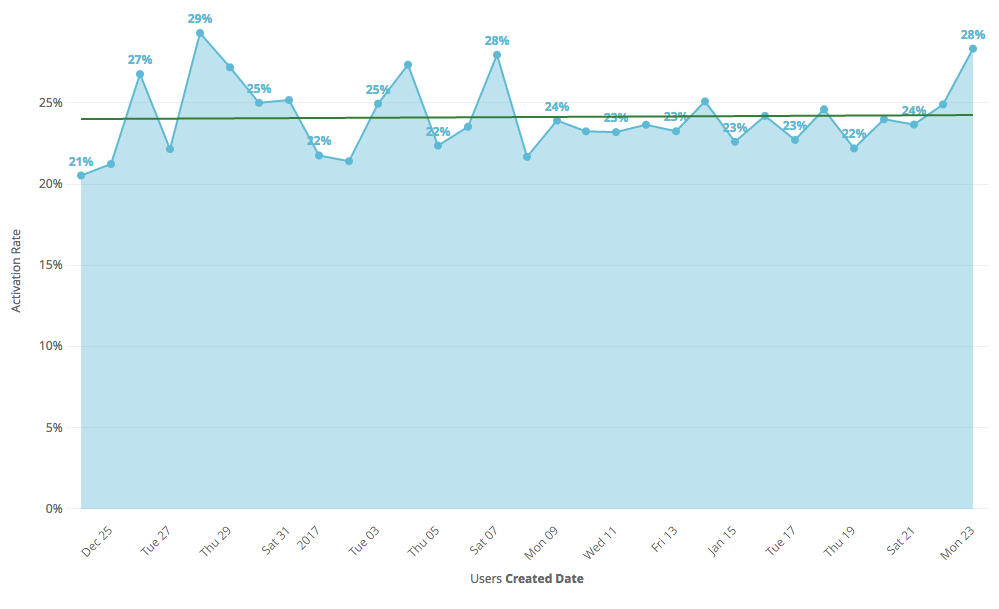
As a next step, we’re keen to move onto the next experiment to improve the signup process! More to come!
Over to you
Is there anything you’d like to learn more about? We’d love to hear from you in the comments!
Check out other reports from January:
Try Buffer for free
180,000+ creators, small businesses, and marketers use Buffer to grow their audiences every month.
Related Articles

Note: This is the quarterly update sent to Buffer shareholders, with a bit of added information for context. We share these updates transparently as a part of our ‘default to transparency ’ value. See all of our revenue on our public revenue dashboard and see all of our reports and updates here . It's been quite the y

Editor’s Note: Thanks for checking out this post! We’ve released our updated 2021 pay analysis here. You can’t improve something if you don’t know that it needs to be improved. That was very true for us four years ago when we first started looking into equal pay at Buffer. We have long used a salary formula to determine all of our salaries – the same role in the same part of the world receives the same salary. That m

Ever since the world got turned upside down by COVID-19, it’s been “business as unusual” for everyone – Buffer included. I sent this update out to Buffer’s investors one week ago. I hesitated on whether to share it more widely, as I know a lot of companies have been impacted more severely in these times. That said, I believe it makes sense to lean into our company value of transparency, since there may be some companies this could help, and it shows Buffer customers that we will be around beyon