More doesn’t necessarily mean better. Think emails in your inbox, glitter on a Mother’s Day card, hot sauce… That applies to social media metrics, too.
You might be surprised to hear it.
The more information you have, the better you can tailor your social media strategy, right? Well, not exactly. Not all social media metrics are created equal, and which ones to focus on comes down to your specific social media goals.
You might be testing a new format, tracking audience growth, or trying to understand how people interact with your posts. And while it’s tempting to track everything, more data doesn’t always mean more clarity.
Metrics are most helpful when they guide your next move — whether that’s adjusting your content, switching up your posting schedule, or even thinking up new products.
In this guide, I’ll walk you through 12 social media metrics that are especially worth a look at in 2025, when they’re most helpful, and how you can use what you learn to support your social media marketing goals.
What are social media metrics?
Social media metrics are the numbers you look at to see how your content is performing against your social media goals.
Any time you check how many people liked a post, clicked a link, or followed your account, you’re working with social media metrics. Each one tells its own story about your content’s reach and impact.
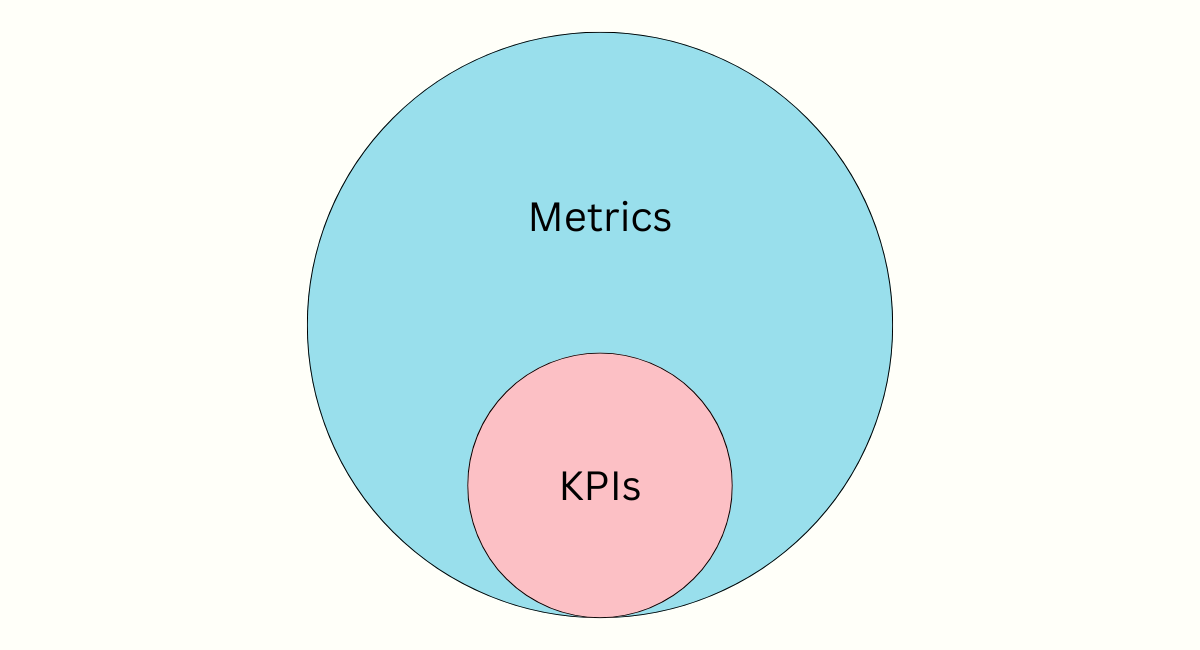
You may hear people refer to them as “social media KPIs” or key performance indicators. They sound similar, but they aren’t exactly the same.
Metrics include every single thing you can measure on your social media channels.
KPIs are the specific metrics you’ve chosen to track towards your goals.
Let’s look at the key metrics that deserve your attention.
Social media metrics that show what’s landing
Some metrics help you get a better sense of how people are responding to your content. When you track these specific signals, you start to see clear patterns in what your audience enjoys and comes back for.
1. Engagement rate
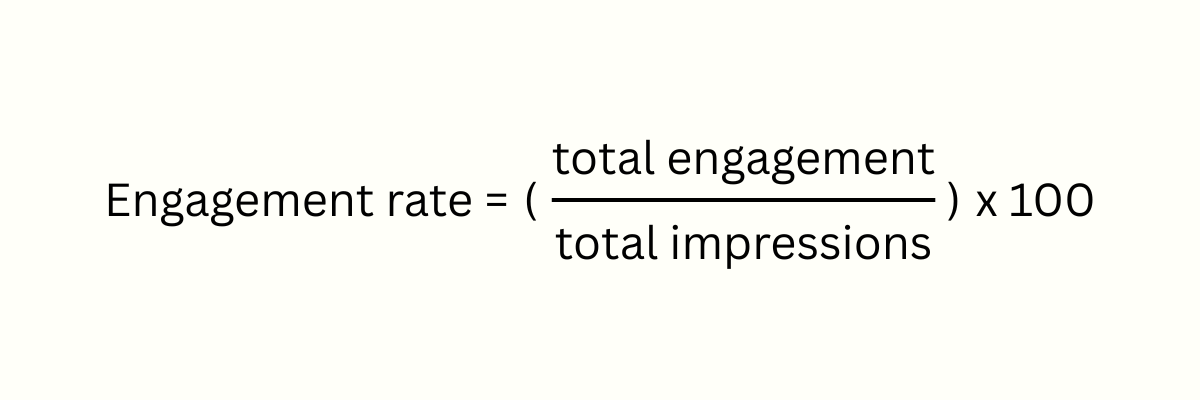
Engagement rate tells you how much your audience is interacting with your content — not just seeing it, but actively responding to it.
Things like likes, comments, shares, or saves all count towards engagement rate. It’s a quick way to understand whether your content is catching people’s attention and prompting them to respond.
Engagement rate is expressed as a percentage you can calculate with this formula:
Freelance social media marketer Rebecca Broad uses this metric as a gut check while creating content. “Keeping engagement rate in mind means I constantly assess visuals and copy and ask ‘why would anyone care?’” says Rebecca.
“Why would someone who sees this post stop scrolling, and spend precious time and energy engaging with it?” It’s a perspective that can help you keep your audience at the center of every creative decision.
You can track engagement rate:
- for a single post
- across a campaign
- over time on a platform
Each view gives you slightly different insights — from how well a specific piece of content landed to how your audience is engaging week over week.
Post engagement rate
Post engagement rate shows you which posts are making people stop and react — not just scroll by.
This type of social media engagement also tells the algorithm your content is worth sharing more widely, though they’re often weighted slightly differently on each platform. For example, shares (especially in DMs) are a strong signal to the Instagram algorithm. Meaningful comments carry weight on LinkedIn, especially when they get a conversation going.
Track this metric when:
- you're experimenting with new content formats
- you're promoting a message you want to stand out
- you want to keep a general eye on what your audience responds to
How to use post engagement metrics
When you see a spike in engagement, don’t stop at the number — figure out what’s behind it. Was the post tied to a trending topic? Did you ask a question that got people talking? Did the visual pop in the feed?
Those are the kinds of clues that can guide what you post next. And if something really clicks, look for ways to repurpose it elsewhere — Rebecca often reworks strong LinkedIn posts into blog CTAs (calls to action).
On the flip side, if engagement is low, that’s your cue to experiment. Change up the format, try a different tone, or shift your focus and see what sticks.
Campaign engagement rate
When you want to know how an entire social media campaign is landing — messaging, post timing, and creatives — campaign engagement rate gives you the full picture.
Because campaigns often span multiple formats and run over several days, this metric can reveal patterns you may not spot while looking at individual social media posts alone.
Track this metric when:
- you're launching a new product or service
- you're running a seasonal promotion (Black Friday + Cyber Monday, anyone?)
- you're raising awareness on a topic
How to use campaign engagement metrics
For brands, campaign engagement rate is a helpful way to adjust your approach mid-campaign. If engagement’s low, you might rethink your next post or shift your ad spend. It’s also a practical way to test influencer or creator partnerships before making bigger commitments in future campaigns.
Creators can include strong campaign engagement rates in pitches and media kits. A solid campaign engagement rate shows brands that you won’t just get them in front of people — you’ll get people talking, following, and maybe even buying. For a brand looking for its next partner, that kind of result stands out.
Platform engagement rate
Platform engagement rate gives you a broader view of how your content is performing across an entire social media platform. When you track this over time, you’ll start to see whether your audience is still responding or if engagement is beginning to dip.
Track this metric when:
- you’re evaluating whether your overall social strategy is working or needs a shift
- you want to know if the platform is still worth your time, or if your focus might be better placed elsewhere
How to use platform engagement metrics
If engagement is steady or trending up, it’s a sign that the platform is worth continued time and effort.
If it starts to fall, it could mean your content needs a refresh, your posting rhythm needs tweaking, or your audience is moving elsewhere — and it might be worth following them.
2. Average video watch time
Average watch time (sometimes called average view duration) is the number of seconds people spend watching your video.
It’s one of the clearest video performance metrics — a higher average watch time means viewers are sticking around for longer. It matters even more on platforms like Instagram and TikTok, where watch time influences what gets recommended or shown to more people.
Depending on the platform, you might be able to track average watch time for your full library or just individual videos. YouTube gives you both; Instagram Reels focuses on video-by-video performance.
Track this metric when:
- you’re experimenting with different video lengths or formats
- you’re comparing video content performance across platforms
- you want to see which topics or styles keep people watching
How to use video engagement metrics
A longer average suggests your content is working — whether it’s the pacing, the topic, or how the video opens. Use that insight to guide what you create next.
If people are dropping off early, take a closer look at your hook, story structure, or visual pacing. Small adjustments can make a big difference in how long people stay.
Social media metrics for tracking your content’s visibility
Content can’t make an impact if no one’s seeing it. Visibility and awareness metrics help you understand how often your posts are being shown, and how far they’re reaching.
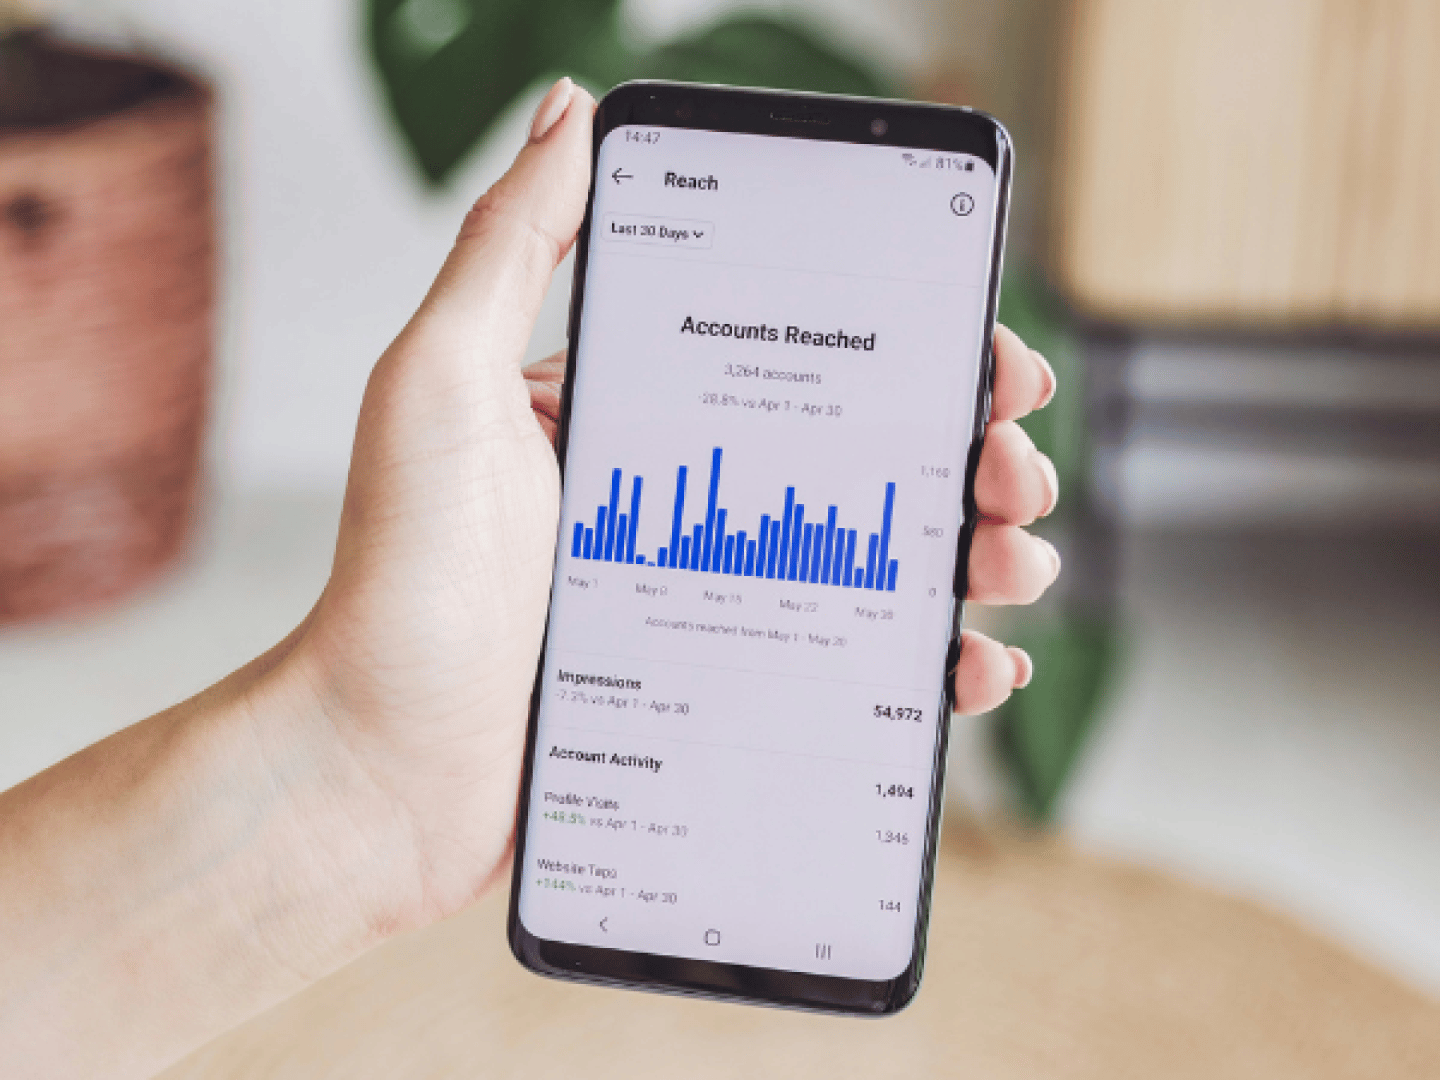
1. Reach
Reach tells you how many different people saw your post or ad. Each person is counted once, whether they saw that post one time or five times.
If a post has a reach of 15,000, that means 15,000 different people saw it.
It’s one of the key metrics that Hailley Griffis, Head of Communications and Content at Buffer, tracks. “Different communities and social networks will engage differently, but if you are reaching an increased number of people, then you’re doing something right,” says Hailley.
Reach helps you compare what formats, topics, or platforms are getting seen the most.
Track reach when:
- you’re testing different formats to see which ones grab more attention
- you want to understand which topics or messages your audience cares most about
- you want to see if posting at different times or on different days helps you reach more people
- you’re reviewing which platforms your audience is most active on
How to use reach
Just like you did with engagement rate, start by checking which posts had the highest reach, then dig into the context. Was it the topic? The timing? Did someone share it and extend your audience?
Hailley reviews her reach every couple of weeks to find these patterns and make small adjustments that add up over time.
One thing she’s noticed: showing up regularly makes a difference. “My reach continues to increase on Threads the more I stay consistent,” says Hailley.
“I’ve spotted the same pattern for other creators too. While my Threads engagement is still growing, I’ve also seen increases in overall reach in the last few months of maintaining consistency.”
2. Impressions
Impressions count how many times your content is shown on someone’s screen, even if it’s to the same person more than once.
For example, say someone taps through to an Instagram post from your stories and then also sees the post in their feed the next time they open the app. This counts as two impressions, even though it’s the same person.
It’s easy to confuse impressions with reach, but they measure different things. Reach tracks how many unique people saw your posts. Impressions count all views, including repeat ones.
For Meryoli Arias, Head of Social Media at Glide, impressions are a north star metric. “As a social media marketer, my main focus is top-of-mind relevance. And the amount of times my message and brand is in front of X amount of people (impressions) helps me with that,” she says.
Track impressions when:
- you’re testing or comparing content formats
- you’re checking if the algorithm is showing people your posts
- you’re measuring overall brand awareness
Just keep in mind: a post can rack up thousands — even millions — of impressions without leading to more followers or engagement, or meeting your business objectives.
“I had a viral post that hit 2 million impressions. Something that took me two minutes to create was being appreciated by so many people,” says Meryoli. But despite its success, the post didn't do much to boost any of Meryoli's business goals, like increase click-throughs or sign-ups.
“I learned that virality is not and should never be the goal of social media. A good tap in the shoulder for the ego does not equal business success.”
How to use impressions
Look at which formats, topics, or post styles get the most impressions, then tweak things like hashtags, posting schedule, or content collaborations to build on what’s working.
If your impressions start to slide, it may be time to revisit your content formats, test a new posting rhythm, or experiment with topics your audience hasn’t seen from you in a while.
Social media metrics for understanding your audience
Audience metrics give you a sense of who’s following along and how that community is growing or changing. They help you see who’s in the proverbial room, so you know who to talk to in your content.
1. Follower growth
Follower growth tracks how many new people are choosing to follow your account over time. It’s one of the most visible social media metrics, and often one of the first numbers people look at when trying to measure progress.
For Meryoli, it’s another north star metric. She uses follower growth to see whether her content is reaching new people and growing her audience — a sign that it’s drawing attention and building momentum.
Track this metric when:
- you want to see if your content or campaigns are reaching fresh eyes
- you're measuring the impact of a recent launch, collaboration, or experiment
- you're setting goals for overall brand awareness or community growth
How to use follower growth
Follower growth can be a helpful KPI, but it’s most meaningful when paired with metrics like engagement and conversions. A rising follower count on its own doesn’t say much about whether those followers are taking action. That’s why it’s sometimes called a “vanity metric” — it reflects potential reach, not impact.
Use it as a signal, not the final measure of social media success. If your follower count is going up but comments, likes, or clicks aren’t, it might be time to adjust your content or CTAs to better engage your followers or reach the right audience.
2. Audience demographics
Audience demographics show you what kinds of people make up your audience — details like age, gender, and location.
It’s a simple way to check whether you’re attracting your target audience. You can use that information to create more content for the people already following you and adjust your social media strategy if you need to reach someone else.
Track this metric when:
- you want to know if you’re attracting your target audience
- you're considering a shift in content style or topics and want to check fit
- you're preparing a brand or investor pitch or media kit that needs audience proof
How to use demographics
Brands can use this data to shape social media content for different groups. That might mean changing tone or visuals, adjusting timing, or running targeted ads based on who’s most likely to respond.
If you’re a creator, demographic data can strengthen your pitch to brands. When you show that your audience lines up with who they’re trying to reach, you become a much more appealing partner.
Social media metrics for learning how people feel about your brand
Understanding if — and how — people talk about your brand can help you see what’s working and where there’s room to improve. Social media monitoring and listening tools make it easy to track those conversations and see how people feel.
1. Brand mentions
Brand mentions measure how often your brand name pops up in posts, captions, or comments, whether someone tags your @handle or just types your name. Not every mention comes with a tag, so if you’re just relying on notifications, you’re likely missing pieces of the bigger conversation.
You can keep tabs on your brand name, key hashtags, and any phrases associated with you across different social media platforms. There’s no fancy formula here — it’s simply the total count of how many times you’re mentioned across the time you’re checking for.
Track this metric when:
- you want to measure brand awareness across multiple platforms
- you want to catch early signals from campaigns, partnerships, or product launches
- you’re keeping an eye out for potential issues before they escalate
How to use brand mentions
Brand mentions can show patterns in who’s talking about you and what gets them sharing. Maybe a campaign hashtag takes off, or you notice more chatter after a launch or big announcement. This data helps you fine-tune your ad targeting, spot potential brand advocates, and even connect with super fans who are already cheering you on.
Brand mentions also play a key role in tracking brand sentiment (coming up next), which digs into the mood and emotion behind those conversations.
2. Brand sentiment
Brand sentiment measures how people feel about your brand, content, or product — whether their comments and posts are mostly positive, negative, or somewhere in between.
While mentions tell you how often your brand comes up in conversation, sentiment reveals what’s actually being said and how people feel.
Reading through comments and mentions yourself gives you a sense of sentiment, but this gets tricky as your audience grows. Sentiment analysis tools can help by reviewing those mentions automatically and tagging the tone behind each one.
For example, “This candle smells incredible and lasts for days” would register as positive. A comment like, “This package took ages to arrive and came damaged” would lean negative.
Track it when:
- you’re checking reactions to a product launch, seasonal campaign, or new collaboration
- you’re seeing a spike in mentions and want to understand what’s causing them
- you’re exploring ways to turn positive sentiment into testimonials or social proof
How to use brand sentiment
For brands, check sentiment on specific campaigns to see if you’ve nailed it — or if there’s something you need to adjust. Are customers complaining about shipping times? Check if the issue is with the carrier or internal logistics. Are they unhappy that you’re non-responsive? A tool like Buffer’s engagement features can help you stay on top of comments.
For creators, sentiment can help you spot which products or resources are really hitting home. Combine that with metrics like sales or click-through rates (more on this below) to figure out what to offer next. Are people loving your habit tracking template? A goals template might be a natural next step.
Social media metrics for tracking business outcomes
If you’re deciding where to invest time or budget, business outcome metrics can point you in the right direction. They help you see how your content is driving results like growing your audience, increasing website traffic, or making better use of your ad spend.
1. Click-through rate (CTR)
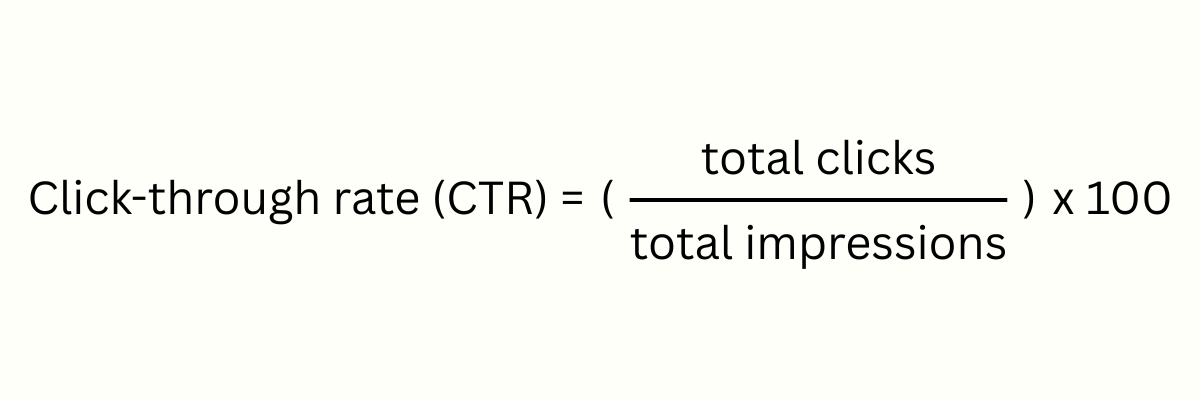
Click-through rate measures how often people click on a link after seeing your post or ad. If you’re sharing a link to your latest blog article, product, or signup page, CTR reveals how effective your post is at turning an impression into a visit.
CTR is expressed as a percentage you can calculate with this formula:
Most major social media platforms — including Facebook, LinkedIn, X/Twitter, Threads, and Bluesky — support clickable links in posts. Instagram is a little different: you can’t add links to regular posts, but you can add them to stories with link stickers.
If you use a trackable link — known as a UTM — you can find out exactly how many people landed on your site from a specific post. Rebecca tracks CTR for posts that send people off a social media platform to understand what’s catching people’s attention and prompting them to click.
CTR isn’t a conversion metric — it won’t tell you if someone actually bought those earrings or joined your course. But it’s a strong sign your content is drawing people one step closer to your business objectives.
Track this metric when:
- you want to direct people a product page, landing page, or signup form
- you’re checking whether your ad spend is leading to site visits
- you want to compare how different CTAs or headlines perform
How to use click-through rate
A high CTR is a good sign that your copy, images, or CTA are piquing your target audience’s interest. If CTR isn’t where you hoped, that’s your cue to try something new: tweak your message, refresh your visuals, or experiment with different CTAs to see what gets people clicking.
Brands can use CTR to spot which ads or posts are compelling enough to get people to click through. If a product drop post isn’t driving many clicks, consider changing up the copy or shifting your targeting for the next round.
Creators can use a strong CTR as a powerful talking point in brand pitches — it proves you can send real traffic, not just rack up views. If CTR drops, see it as a nudge to switch up your post structure, test new formats, or experiment with fresh ways to encourage clicks.
2. Cost-per-click (CPC)
Cost-per-click — or CPC — is an ad-specific metric that tells you how much it costs you for each click on your ad. It’s a useful way to keep tabs on how your ads are performing when your goal is to bring people to a specific page.
Because CPC measures cost, this is one social media metric where a higher number isn’t always a good thing. A lower CPC, on the other hand, means you’re paying less each time someone clicks.
CPC is a core paid social metric and is easy to calculate:
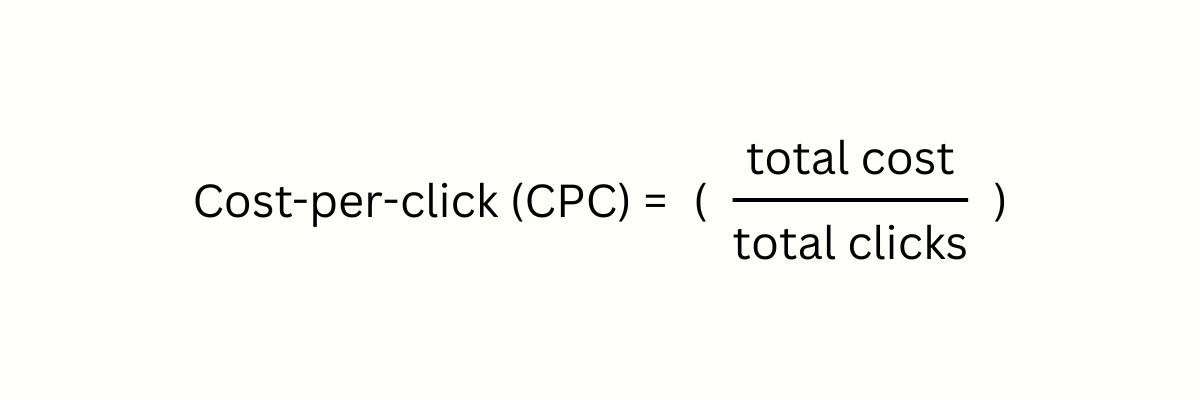
You can calculate CPC for individual ads or look at it over an entire campaign.
If you spent $50 on an ad that received 100 clicks, your CPC for the ad would be 50 cents — $50/100.
If you spent $500 dollars on a campaign that received 2,000 clicks, your CPC for the campaign would be 25 cents — $500/2,000.
Track this metric when:
- you’re running ads to drive traffic to a site, store, or signup page
- you want to compare CPC across social media channels to see where your budget goes further
- you’re testing ad variations to see which one drives more clicks for less
How to use cost-per-click
Start by looking at the range of CPC across your ads. If one version costs more to get a click, look at the difference in copy, visuals, or CTA — did one include a clear benefit? Was it shorter, more specific, or better matched to the audience? Use this information to adjust new ads in the campaign.
Compare CPC by platform, too. If one consistently gives you lower costs, consider shifting more of your ad spend there or repurposing what worked in the creative or copy on other channels.
3. Return on ad spend (ROAS)
Return on ad spend (ROAS) measures how much you earn for every dollar spent on ads. It’s one of the clearest ways to check whether your paid campaigns are turning clicks into income.
While CPC measures how much your ads cost you, ROAS measures how much your ads earn you.
Here’s how to calculate it:
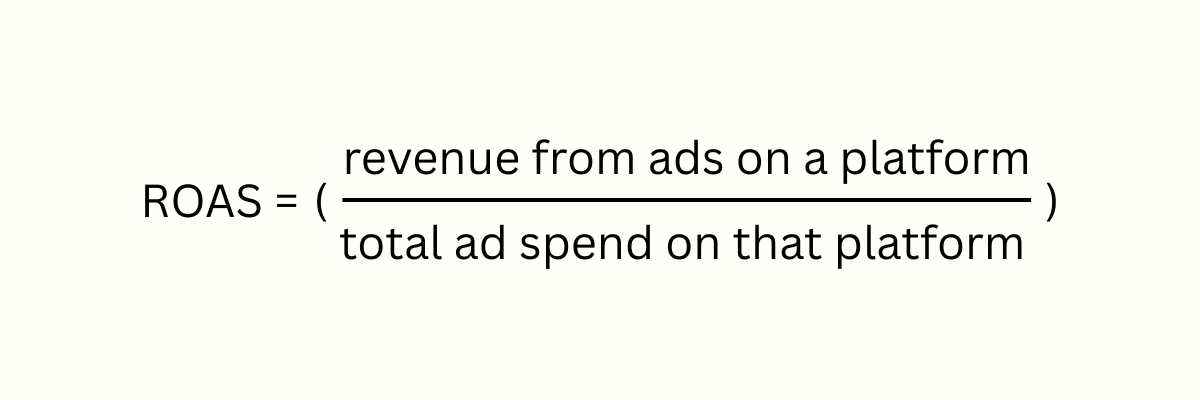
So, if you made $5,000 from a Facebook campaign and spent $1,000 on ads, your ROAS would be 500%.
Digital marketing consultant Laura Holyer considers ROAS (and revenue) one of the top paid social media metrics to track.
It’s a platform-specific metric, and both the revenue and the ad spend data come from the same place — usually the social media platform’s own tracking tools. That means your numbers can be affected by things like cookie restrictions or missing conversion data.
That’s why, says Laura, you should take the numbers “with a pinch of salt” if they’re coming from the platform itself. “Then we look at Blended ROAS figures as one of the top metrics,” she says.
Instead of looking at each platform in isolation, Blended ROAS looks at the bigger picture: how much total revenue you’re earning across all channels — organic social media, Google searches, email newsletters, paid ads — compared to what you’re spending on advertising.
Here’s the formula for Blended ROAS:
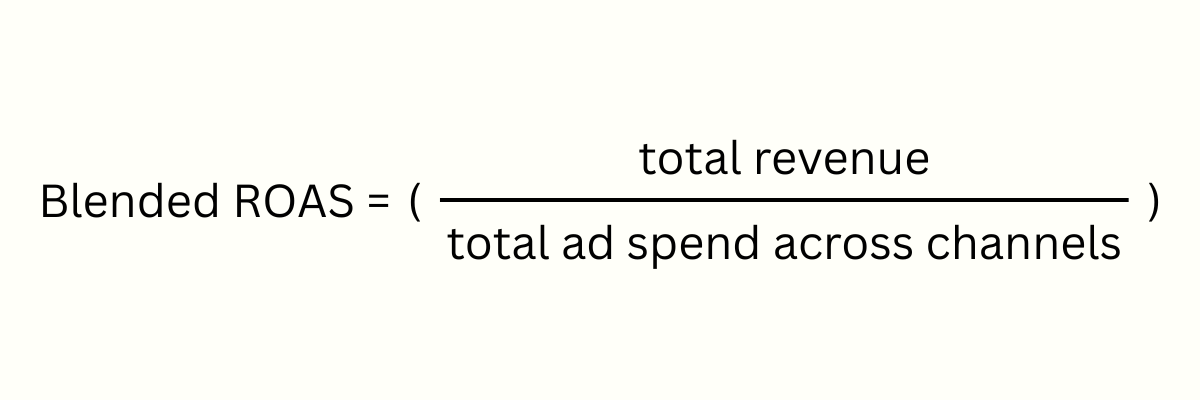
If your business brings in $8,000 overall after spending $1,000 on ads across all channels, your Blended ROAS is 800%.
Track this metric when:
- you want to measure whether your ad spend is converting into sales
- you’re comparing which channels are bringing in the most return
- you’re trying to decide where to shift budget or prioritize spend
How to use return on ad spend
Use ROAS to spot which campaigns are bringing in sales and which ones might need a change in direction — whether that’s updating the offer, tweaking the creative, or rethinking the channel.
Laura points out that the impact of a campaign also shows up in ways other than revenue. If you’re running a brand awareness campaign, you might not see sales right away — but you might notice more people searching for your brand. These kinds of shifts show that your campaigns are working, even if it takes people a little longer to act.
How to track your social media metrics
Once you know which metrics to pay attention to, the next step is figuring out how to track them. Most platforms offer built-in analytics tools, but there are also third-party options that may offer a more complete view.
Platform native insights
Most social media platforms come with built-in analytics, so you can keep an eye on key metrics without ever leaving the app.
What you’ll see (and how much detail you get) depends on the platform, and sometimes on your account type, but nearly all of them cover the basics: impressions, reach, engagement, follower growth, and demographic data.
LinkedIn analytics offers these metrics at both the post and account level.
Instagram creator and business accounts go even deeper with their analytics. The data breaks down:
- impressions and engagements from followers vs. non-followers
- percentage of impressions by content (and audience) type
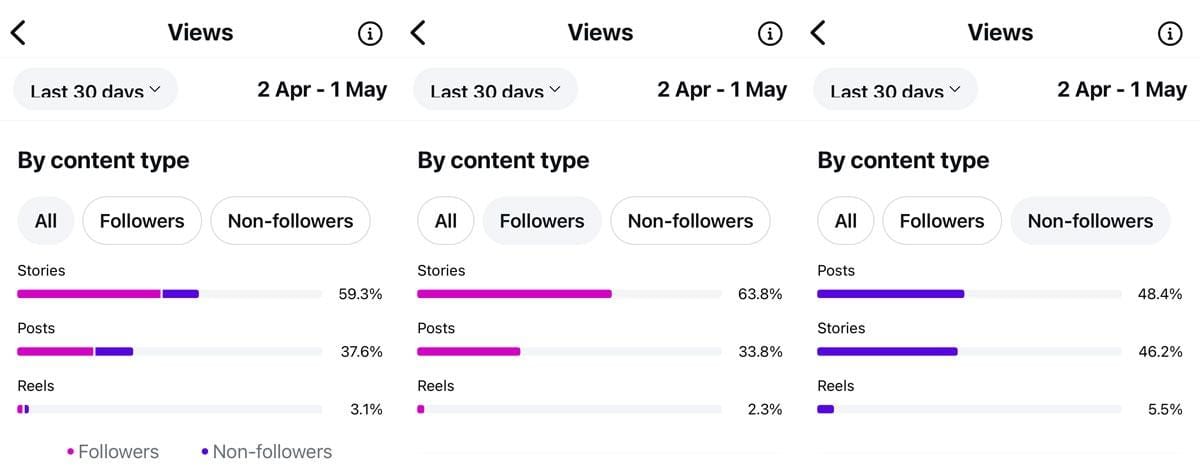
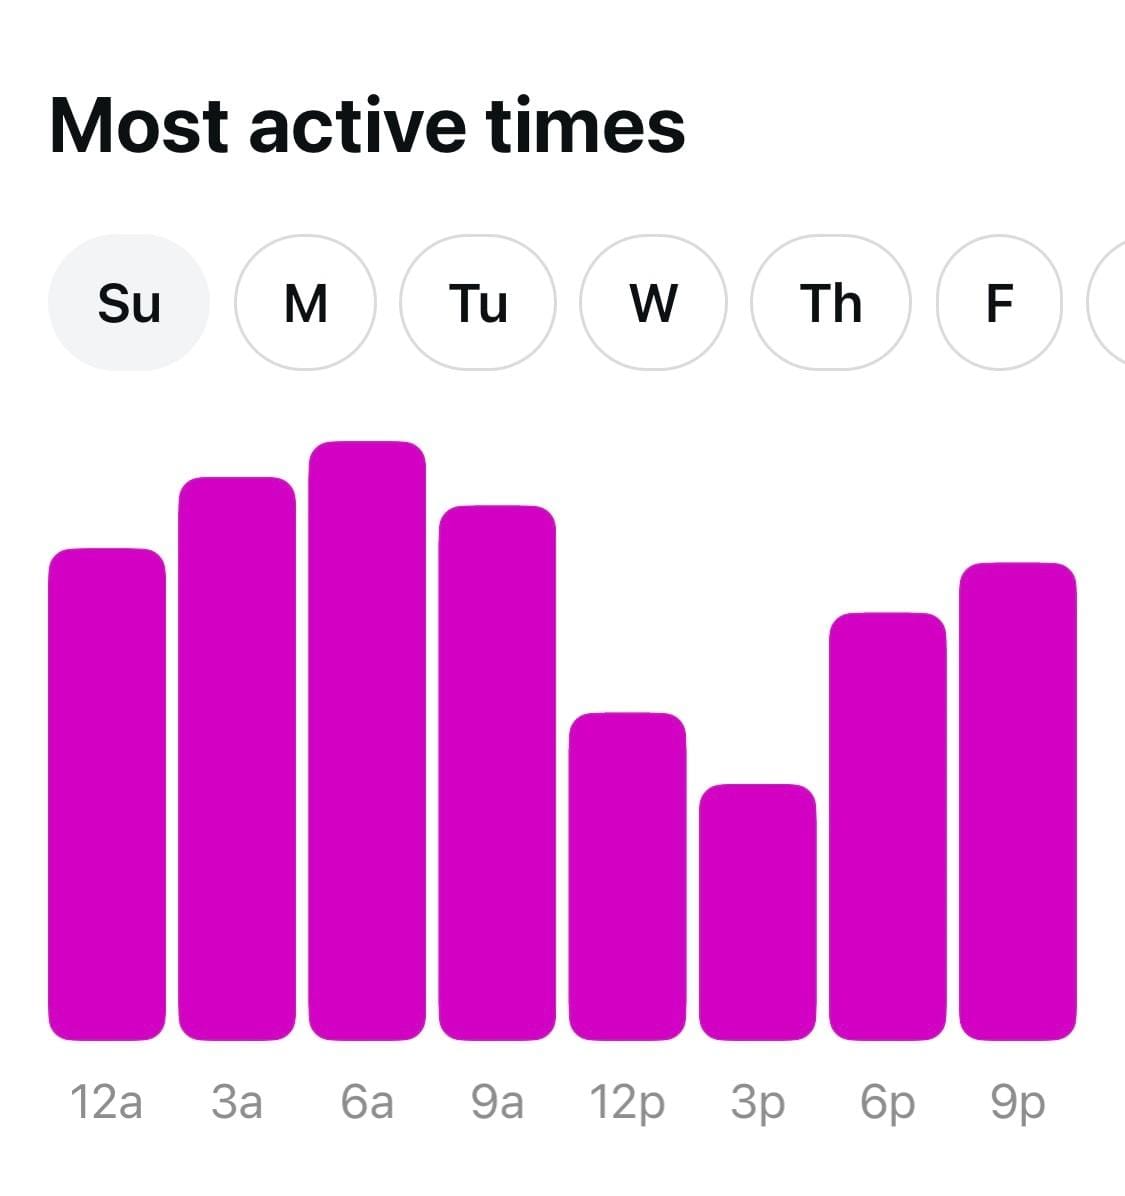
You also get data about when your audience is most active each day of the week.
X/Twitter analytics are only available to premium users. These detailed metrics include both tweet- and account-level impressions, engagement, link clicks, and follower growth. Link clicks are an important metric here, since tweets directly support clickable links. Free users still get access to basic insights at the tweet level.
Facebook, TikTok, and YouTube all have built-in metrics you can use to measure your social media performance on those channels.
It’s always helpful to see all those metrics right where you create and post, but there are a few limitations — network-specific metrics tools only show you what’s happening on that one platform.
If you’re sharing content on more than one social channel (and chances are, you are), these built-in dashboards aren’t going to give you the whole story. Third-party social media analytics tools come in handy if you’d like to zoom out for a birds-eye view and see how all your channels stack up together.
For a more complete view of your social media efforts, you might want to explore third-party analytics tools.
Social media analytics tools
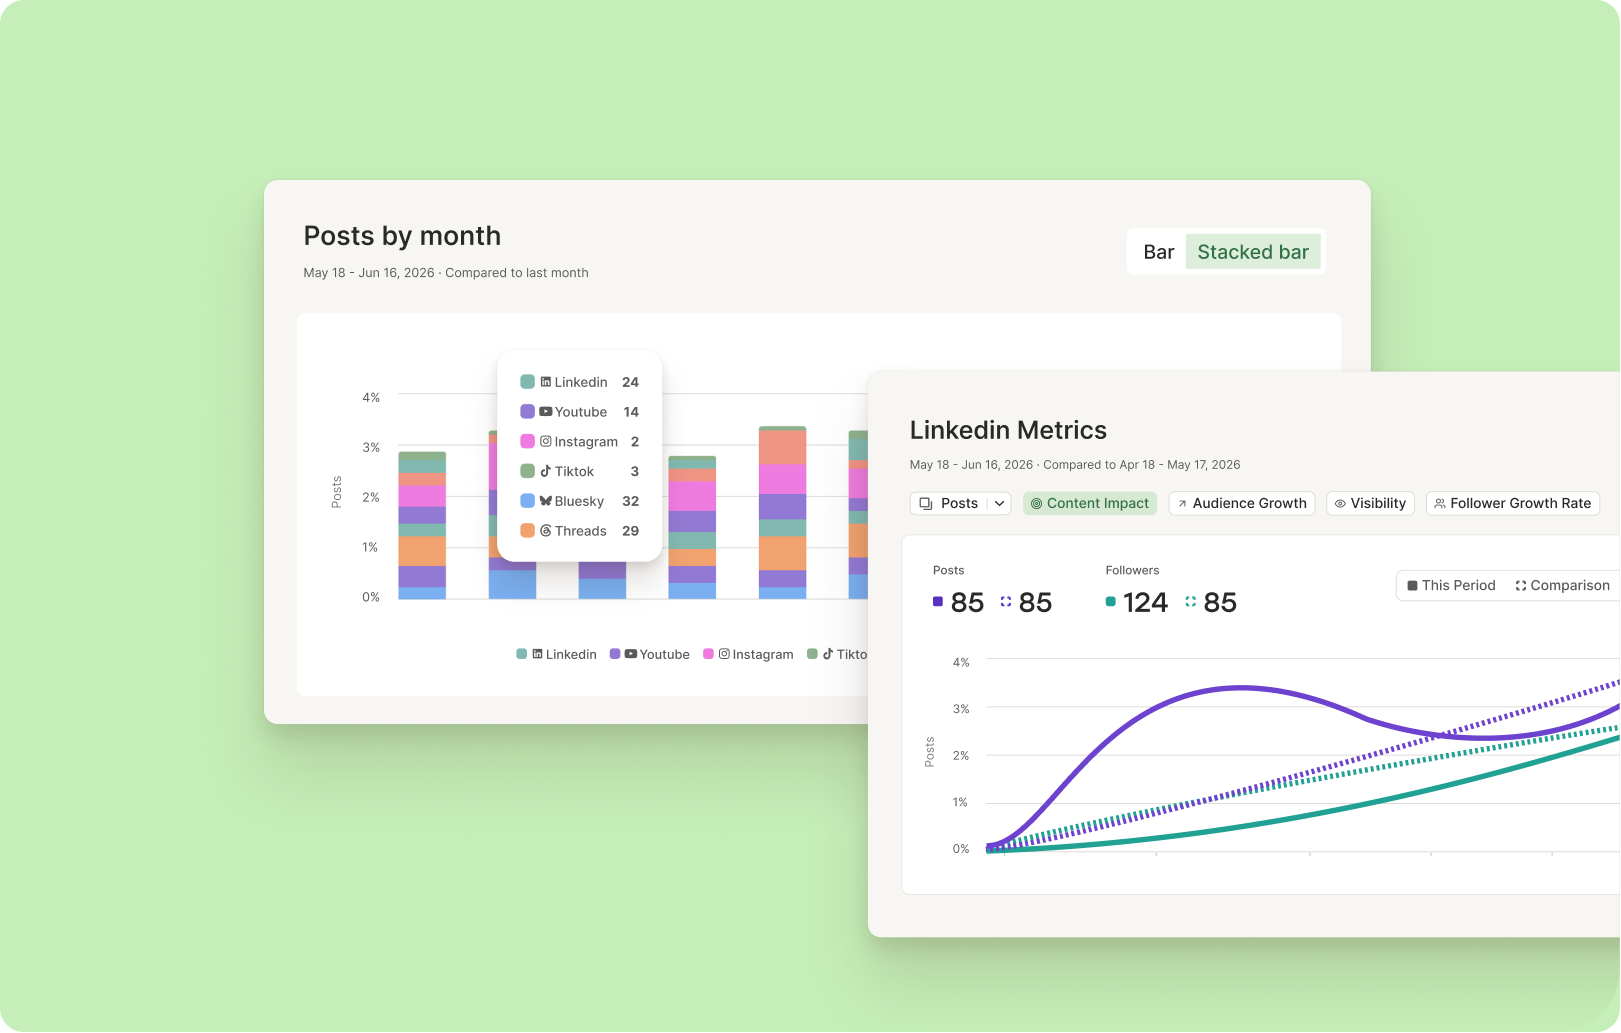
While platform-native metrics are helpful, social media analytics tools give you a more complete picture of your performance — especially if you’re working across multiple platforms. Here’s why they might be worth considering.
If you manage several social media accounts, third-party analytics tools save you bouncing back and forth between apps. You can bring all your numbers together in a single dashboard and get a look at how your social media efforts stack up across every platform you use.
Some tools — like Buffer — offer both metrics and personalized insights. Think:
- which day of the week your posts do best
- what types of content get the most engagement
- how many times a day you might want to post for the best results
Tracking mentions and sentiment is another big win. While native tools are often limited to basic social media metrics, many third-party platforms help you keep tabs on these brand metrics.
And if you’re putting together reports for your team or clients, these tools make that job a lot simpler. Most offer customizable reporting features so you can create reports that match your specific social media KPIs.
Buffer’s Insights help you with detailed, personalized metrics and takeaways that help you achieve and measure social media success — you’ll even get recommendations on what to do next, based on your data.
Sign up today to test it out for free. 🥳
Try Buffer for free
200,000+ creators, small businesses, and marketers use Buffer to grow their audiences every month.