Key stats:
Buffer signups
1,697 +33%
Buffer for Business trials
266 -2%
Social blog sessions
1,164,934 +14%
Email subscribers
100,819 +1%
NPS
57 -1%
What are some of the metrics that guide the goals for your marketing team?
Leads, signups, conversion rate, and traffic all seem to be popular ones. Some folks might be interested in social media reach or email subscribers.
These all sound great to focus on and would be fun to chase. (They’ve certainly been on our radar in months past.)
We’re in the midst of taking a slightly different route at Buffer, exploring what it might look like to focus our marketing efforts on a product-specific number: Net Promoter Score (NPS).
I’d love to share more about what this looks like and what we’ve learned so far this quarter in exploring NPS as a key metric for the marketing team. In addition, we’ve been up to some neat things on the blog and with our team structure. I’m excited to share it all. Hope you enjoy! Feel free to AMA (ask me anything) in the comments.
What is NPS? “The one number you need to grow”
NPS began with Andy Taylor, the CEO of Enterprise Rent-A-Car, who came up with a simple, two-question customer survey that clearly showed the health of his various Enterprise Rent-A-Car offices. Further research by the team at Harvard Business Review confirmed the accuracy and success behind this metric, and they took things one step further, simplifying the survey to a single question.
How likely are you to recommend [product] to a friend or colleague?
(Answers are given on a scale of 0-10 with zero being “not likely” and 10 being “very likely.”)
Here’s an example from Groove’s NPS survey.
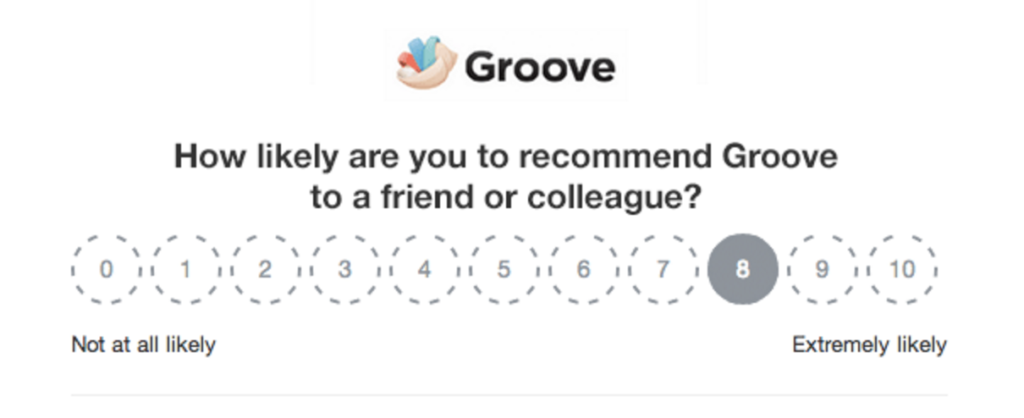
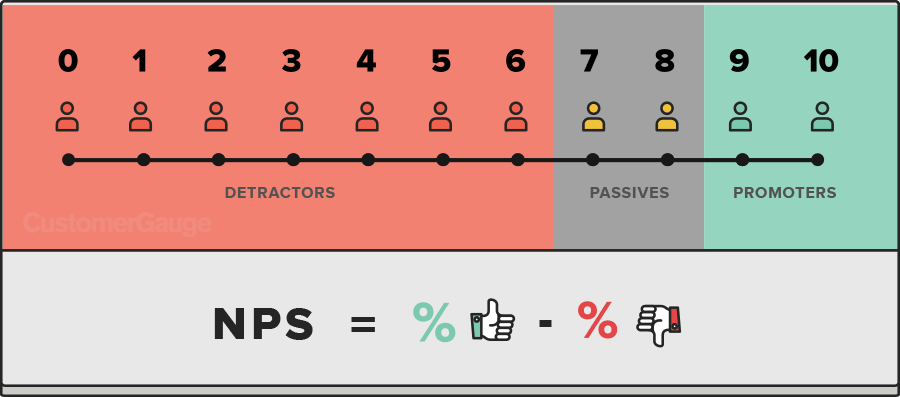
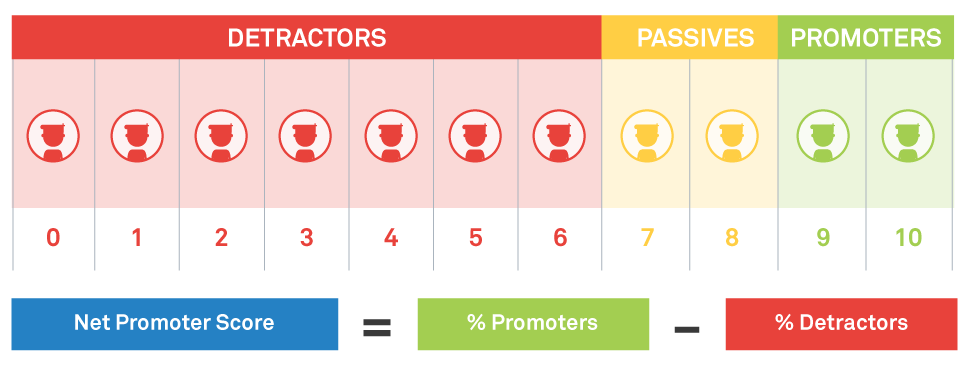
Responses are divided into three different buckets: Promoters (score 9-10), Passives (7-8), and Detractors (0-6). In the final calculation, Passives are dropped, and you subtract the percentage of Detractors from the percentage of Promoters to arrive at NPS.
Here’s a neat graphic from CustomerGauge:
Here’s a neat graphic from Team Leader:
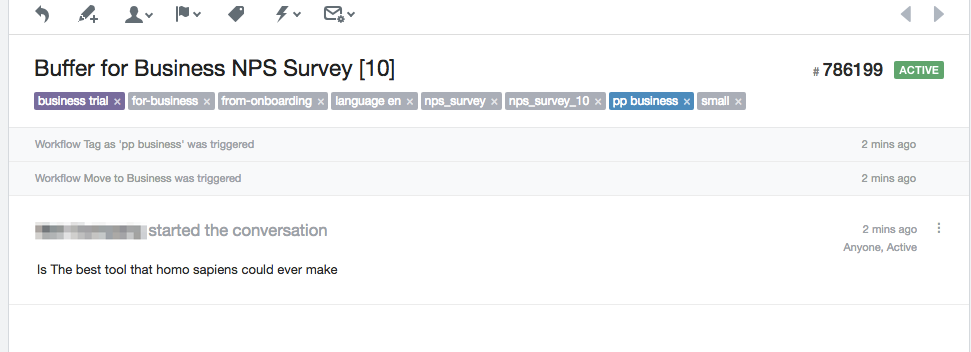
We show this question within the Buffer dashboard. It might pop up while you’re filling your queue or customizing your schedule. Then after a customer submits a response, they receive a follow-up question: “What is the most important reason for your score?”
The score combined with the feedback provides a neat mix of qualitative and quantitative data for us to sift through and learn from. Here’s a fun one, for instance:
So what does all this have to do with marketing?
Good question!
I’ll admit, we’re far from the first to consider tying NPS so closely with marketing. One team we take a lot of inspiration from is the marketing team at Slack, led by CMO Bill Macaitas. He believes NPS to be the most important metric for everyone he oversees — a group that includes marketing, sales, and customer success. In a feature at Mashable, Bill explained a bit more about his thinking with NPS:
Customer experience and growth should not be viewed as competing forces or a zero sum game. A great customer experience will yield happy customers who recommend you more. Additionally, word of mouth recommendations are usually the best converting lead sources.
Marketing has a huge role in that experience and is often one of the first touch points that a customer has with your brand. It is critical that they have a great first experience.
In another interview, he went into greater detail. The Optimizely blog took some notes.
Bill is not fully satisfied if someone signs up for Slack. He is not fully satisfied is someone becomes a paying customer. Their bar is will someone recommend Slack? “And that’s a much higher bar.”
Holistically focusing on NPS and CSAT (customer satisfaction) are long-term metrics, leading indicators of long-term growth. Leads, opportunities are short-term metrics.
We aspire to be customer-focused to a similar extent: wholly, foundationally, with our hair on fire to see our customers succeed.
And so we arrived at NPS.
From a Buffer perspective, this idea has fit really well with how we’ve historically approached content. For years now, we’ve been interested in delivering a great experience for everyone who interacts with our brand.
We feel responsible for every online interaction someone has with our brand.
We feel responsible for every online interaction someone has with our brand.
And furthermore, we feel that every online interaction feeds into the NPS score.
If a customer interacts with us on Twitter, reads a handful of blog posts, watches a Facebook Live session, then hops into their Buffer dashboard to take the NPS survey, our marketing efforts are going to have an impact.
Even those days, weeks, months before someone joins Buffer as a customer, we feel that the experience someone has with our content will plant a seed in that person’s mind of what kind of brand Buffer is and what level of confidence they can have in our product.
MailChimp has this neat way of explaining why they do so much brand marketing. They want to create a bias for MailChimp so that when someone is ready to choose an email marketing platform, MailChimp will be top of mind.
It’s similar for what we hope to achieve at Buffer. We want to deliver the absolute best experiences with our blog, our social media, our videos, our swag — everything! — so that these experiences create a bias for Buffer and create trust and joy with the Buffer brand.
That’s the high-level, hypothetical stuff at least. (How does it sound to you?)
Now for the specifics.
We’ve not fully turned over all our metrics to be NPS-driven. You can peek at our marketing OKRs here to see how they are still mostly, traditionally focused on traffic and leads.
But what we have kicked off is some deep exploration into what an NPS push might look like in the final months of the year. This exploration involves tracking NPS closely, both the quantitative and qualitative results, and putting together cohort analyses on the effect of marketing on NPS.
Here’s what we found so far:
- NPS for customers who signed up after viewing any Buffer blog post: 68
- NPS for customers who signed up direct from the Buffer blog: 67
- Customers who have opted in to our product newsletters: 60
- Users who have opted out of our product newsletters: 49
- Users who subscribe to our MailChimp emails: 64
- NPS for customers who have subscribed to the Actionable Strategies email course: 69
- NPS by referral channel (how people came to sign up for Buffer): see image below

One of the takeaways we’ve had from this is that email marketing might not be as strong of a channel as we had previously thought (I’ve been on the edge of pushing more resources in this direction, though now I might take a step back). And content like the Actionable Strategies email course seems to really resonate with people.
Beyond tracking and analyzing NPS, we’ve also found NPS to be an inspiring source of products and ideas for us this quarter. Here are just a small handful of things we’ve been able to think about:
- Offer a referral program to Promoters
- Mine the qualitative results to find content gaps
- Starting a customer evangelism program aimed at Promoters
And (maybe as a sign that we have too much NPS on the mind) :) we’ve even found the score seeping into other areas of marketing and Buffer.
- On the Buffer Social blog (“Would you recommend the Buffer Social blog to a friend?”) — 89 score
- After our in-person meetups and events (“Would you recommend this event?”)
- The app we built internally for our Buffer retreat in Hawaii (“Would you recommend this app?”)
- Our very team!
It’s been a really fun time being so NPS-focused these past couple months. In terms of next steps, we’re going to revisit all our NPS learnings from this quarter when we set our plan for Q4 — and we might just find ourselves diving even deeper into NPS!
What has your experience been like with NPS? I know I’ve got a lot to learn on the topic. I’d love any of your stories or articles!
(HT to Wootric for the NPS scores. If you’re keen to track NPS for your product, they’re a great solution.)
August’s highlights from Buffer marketing
1. Going from 1.1 million blog visits to 1.3 million
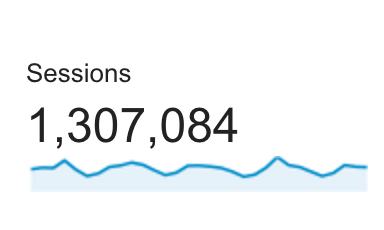
Since the start of the year, we’ve been eager to grow Buffer Social blog sessions from 1.1 million to … well, anything higher. To be honest, things felt a bit stuck.
Until this month.
Huge credit to our social blog editor and lead writer Ash for cracking the code and finding some keys to growth on the blog. This was the number just last weekend. (It’s for the previous 30 days.)
???
We did it! And we’re excited to reach for the next milestone.
As is often the case with numbers like these, it wasn’t the impact of any one particular thing that drove us to 1.3 million sessions. We think it was the combination of several:
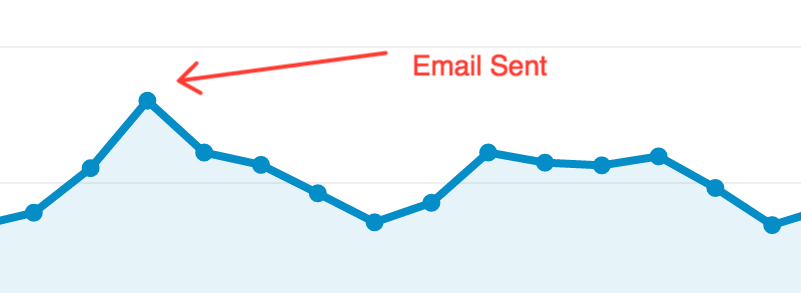
We’ve been emailing our main Buffer customer list once every three weeks with a new blog post.
We’re lucky to have a list of 1.4 million customers whom we can email on occasion. Typically we send new blog posts to just our blog subscribers. Now, we send the big ones to customers, too, when we feel they’re relevant.
We’ve been revisiting past blog posts to update them with new info and publish dates.
This historic optimization (something that other sites like HubSpot and Sprout Social have done successfully) has been a great boost to the search traffic on these pages.
Here’s one of those posts:

We’ve been writing more long-form, big huge guides on social media topics.
In the past few weeks, we’ve published a huge Instagram marketing guide and one for Facebook ads. In the coming weeks, we’re hoping to publish about content curation and coding for marketers.
The Complete, Always-Updated Guide to Facebook Advertising
Sidenote: How to measure just some of your blog traffic
At one point in the past few weeks, I was about ready to kick off a significant brainstorm to solve our blog traffic challenge. Then our co-founder Leo reminded me about the type of content we have on our blog.
The majority of our traffic is to our social media content.
A significant percentage is also to our lifehacking content, which we published lots of a couple years ago and have pivoted away from since.
What if … the traffic to our lifehacking content was dipping while the social media content was on the rise? What if I was getting flustered for nothing?
There was only one way to find out. Into Google Analytics I went!
Within Google Analytics, you can set custom segments that filter the data just the way you want. So I set about adding segments just for lifehacking content and just for social media content. Here’s what one looks like:
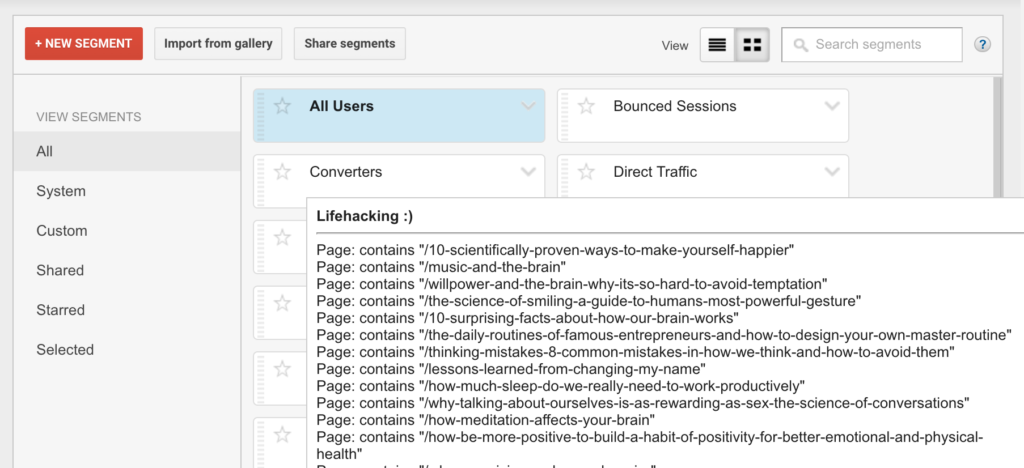
Turns out the lifehacking content represented 10 percent of our traffic and was down about 20,000 sessions year-over-year — a small number in the grand scheme of things but still a number I was grateful to know.
2. Marketing team gets an engineer
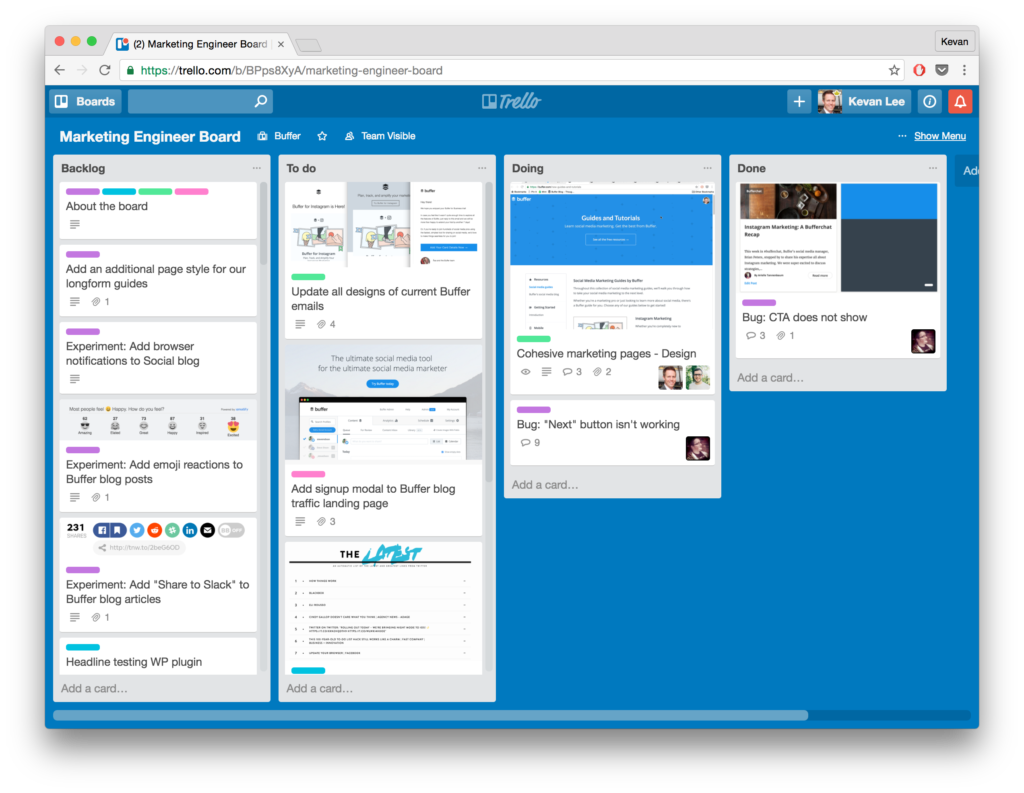
Late in August, we were so happy to welcome Steve, a Buffer engineer, to our marketing team as our full-time marketing engineer!
Steve joined Buffer as a designer and has worked on successful projects like the social media calendar and the Buffer style guide. Lately as Steve has embraced a generalist role and developed more of his skills and interests, he’s taken on loads of responsibilities as an engineer, working with the Buffer product and growth teams. Now, his next transition is to join us on the marketing side to lead all of our engineering projects and experiments.
We’ve already got quite the Trello board going for him.
3. Weekly brainstorm
One of our OKRs this quarter was a simple (and fun) one: meet together once-a-week to brainstorm.
Brainstorming is one of the oft-spoken-about challenges of remote work. When you’re not bumping into each other in the hallways with ad hoc conversations, the opportunities for brainstorming are limited.
So we hoped to create some of our own.
We meet every Friday for 30 minutes to just bounce off ideas and seek feedback on some fun stuff we’re thinking about, working on, or dreaming toward. It’s been great to connect in a more laidback fashion toward the end of the week (our weekly standup is on Mondays).
Looking ahead to September
We have a few big things planned for Buffer marketing in August. Here’s a sneak peek:
- Launching a social media podcast!
- Partnering with bit.ly for a social media webinar
- Working on a new marketing project — a mini-product that I’m excited to share about next month
What can we share that would be helpful for you?
If you have any questions at all about our marketing plans or projects, I’d be so happy to chat with you here in the comments. Feel free to share any thoughts or questions, and I’ll jump right in!
Check out more reports from August 2016:
Try Buffer for free
190,000+ creators, small businesses, and marketers use Buffer to grow their audiences every month.


