

Buffer Engineering Report
August 2016
Key stats
Requests for buffer.com
68.3m
Avg. response for buffer.com
220ms
Requests for api.bufferapp.com
944m
Avg. response for api.bufferapp.com
88.1 ms
Bugs & Quality
- 2 S1 (severity 1) bug reports – 2 closed 100% (In July: 9 S1 Bug reports – 6 closed 66%)
- 24 S2 (severity 2) reports – 17 Closed 71% (In July: 38 S2 reports – 23 Closed 61%)
Welcome to this month’s engineering and innovation report! I’m happy to share we’ve been making steady progress on key fronts at Buffer. Really excited to share the highlights with you all.
The TL;DR
- We’re excited to welcome our newest Android Developer! We’ve also moved a few team members around after closing our Buffercelerator product, Rocket.
- After some downtime on Friday, August 19th, we discussed the “5 Whys” to find the root cause and we’ve instituted several changes because of our findings.
- Our data team adjusted our monthly recurring revenue model and it has given us a lot more confidence in our accuracy.
- This new model came as a result of two intensive “Hackdays,” where the data team focused exclusively on a single project for 48 hours. More results and reflections below!
Team Updates: Teammate moves, new career path framework
We’re excited that Joe has accepted our offer to join the team full-time as an Android developer! He’s already done some incredible things at Buffer; check his great work on our Android Style guide.
Two other team changes happened this month as well. Rocket, our first Buffercelerator project, has decided to not continue.
- This means that Phil has joined us on the main Buffer product again. He’ll working with the Growth team to help push out experiments and optimize the value for our users.
- Steve, who was also an engineer (previously product designer) in the Growth team, has joined the product engineering team and also help out on engineering tasks for the marketing team.
In August, we were pumped to see Katie move into a new role as an engineering manager. She’s already had a huge influence p on the management side. Niel, Katie and Sunil now hold regular weekly syncs to ensure we build a great engineering team and processes.
New Buffer engineering career path framework
One of the key challenges of our current salary formula is the ambiguity of experience levels. It is often tough to decide how and where to place people in these levels. This leads to ambiguity in how engineers can grow in their careers and what this means for their professional development and salary. There’s also huge potential that this leads to bias and pay inequity.
It felt like a key time for us to address this challenge head on.
Katie and Niel, getting advice from team members, industry influencers and outside companies, have been working on this for the past month and aim to have this rolled out to the team in September. Excited to share more on this soon.
A “5 Whys” on our system-wide downtime
On August 19, we experienced the largest system-wide outage of the Buffer application in over a year. An engineer merged a pull request that had an unindexed database query in a critical path. This wasn’t deployed, which is usual development protocol. Another team member deployed to buffer.com many hours later. We experienced database slowness and customers started seeing Mongo errors on buffer.com.
Reverts solved the problem, though figuring out the root cause took a few hours to pin down. Although the original pull request had gone through a code review, it was not specifically reviewed by someone who could take a look at possible performance implications. The fact that we have many developers working on a system with a single point of failure is a key motivating factor for our efforts to move Buffer to a service oriented architecture.
When we have down time or any serious occurrence at Buffer, we don’t point fingers but instead try to look at it as an opportunity to improve. We use a process called the 5 Whys. This allows us to pinpoint process changes to prevent these things from happening again.
Our end conclusion was that there seems to be inconsistent education around working with databases at scale and constructing proper database indexes.
Since this discovery, we’ve worked to put more visibility on this for the team, as well as make sure that we improve our pull request and code review flows to bring in the right people to review core changes.
A few team members are trying to push our visibility/process even further with apps like Danger. We’ve also added much more fine-grained monitoring and alerting of database stats using Datadog so that team members will have a clearer picture of what part of the system is failing.
Service oriented architecture update
The push to move Buffer to a more service oriented architecture (SOA) has gone really well this month. We now have around 20 docker containers running in production on Kubernetes 1.3. These services handle 1.49 million requests per week.
We’ve recently standardized our logging framework for these services, so that when developers build services, they won’t have to re-invent the wheel. Steven led the charge here using a sidecar container approach with Fluentd, AWS Kinesis and Elasticsearch. It’s currently working at 12k records/hour, this will increase quite a bit over the next few months.
The next challenge on the SOA front will be to figure out how to share and synchronize data across different separate services. We built a proof-of-concept service which uses AWS Kinesis to stream data of Buffer button counts to a separate service. We’ll likely explore this more in September and experiment with how we want to scale data and stream processing/PubSub with tools like Apache Kafka and AWS Kinesis.
Improved monitoring and alerting
As Buffer has grown, our systems have become a lot more complex, with many separate databases, servers and services.
We’ve signed on to Datadog for fully monitoring our infrastructure this month. Before Datadog, we relied on AWS Cloudwatch and New Relic. We were really happy with what Datadog provides, making it much easier to dig in any specific metrics across the entirety of Buffer services. We’ve set up monitoring on database performance, instance health, service latency, and much more. We also now use ElastAlert to alert on Elasticsearch log events.
We’re excited to keep the SOA momentum high going into September. Tigran is busy moving workers that process analytics data from our legacy system to Kubernetes. We’re starting with a small percentage, but hope to move fast and be running 50+ of these workers in containers within a couple weeks.
We’re also working on a project to break down our widgets infrastructure. We hope to move our video.buffer.com service and eventually Buffer buttons away from dedicated servers and on to the Kubernetes cluster.
Improved ‘on-the-hour’ posting times
Earlier this month Colin noticed a trend of increased delays for users posting to social networks on the hour. We typically see spikes here as many users prefer to post status updates specifically on the hour, like 8 am sharp.
This triggered us to rework our broadcaster service workers (the logic that posts status updates to services like Facebook/Twitter) to be on dedicated instances instead of shared with other workers.
Here you can see for posts due at 8 am, we’d have ~1,200 posts broadcasted with a delay of 90 seconds or more.
August 3rd 2016:
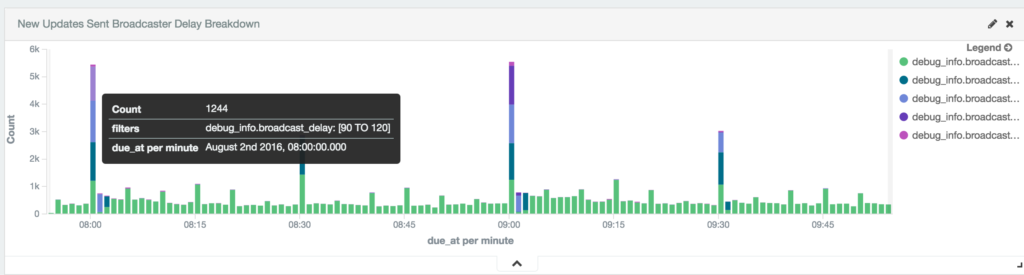
Our customers expect posts to go out at the time specified, so this was unacceptable. You can also see further delay on posts specified after the hour, like 8:01–8:02am.
After re-working our broadcasters infrastructure here’s how things look today:
August 29th 2016:
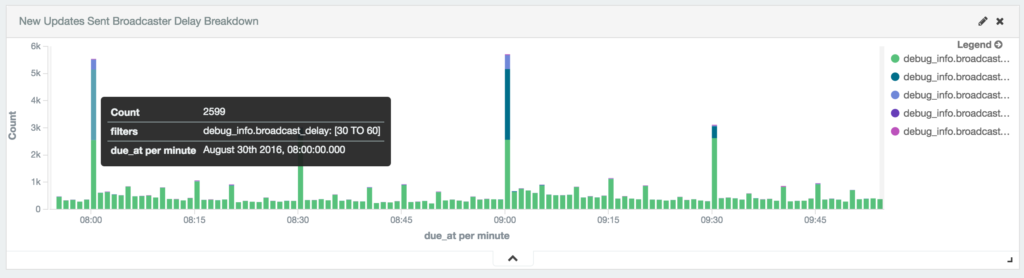
Now 95% of updates are sent out to services immediately, within the minute specified. We still see about 5% take longer than 60 seconds, so we’ll look to improve this further. (This oftentimes can be due to an post that has a large image or video attached.)
Mobile: Speedier iOS; Android style guide
Update by Andy Yates
iOS: Speed update; preparing for ‘dark mode’
With iOS 10 around the corner, most of our iOS attention has shifted to getting things ready for all of the new features and UI adjustments that brings.
We also wanted to speed up some of our most-used screens: Buffer and Analytics tables. With so many different elements possible in each cell, it’s always been a challenge to keep things scrolling at 60 frames-per-second. We were often seeing slowness and frame drops, especially with more complicated update cells.
Facebook open-sourced a neat little project they use to keep things scrolling smoothly called AsyncDisplayKit. It’s been implemented into Pinterest and 4,500+ other apps on the App Store – and now Buffer!
This video shows the current queue that’s live in the App Store on the left, with the newly recoded version on the right. You’ll notice less skipped frames along with less scroll indicator jumping with iOS calculating the cell heights.
Along with these changes we’ve had the chance to do some future-proofing to allow our updates to display in grids, which will be useful for some upcoming explorations for including Instagram grid views.
We’ve also spent a bit of time improving how we style the app. Wit rumors about Dark Mode coming to iOS with the introduction of the iPhone 7, we want to make sure we’re in a good position to introduce something very quickly. If it doesn’t get introduced, we’ll join some excellent apps on the store which have introduced dark modes like Tweetbot, Twitter etc.
Android: New coding patterns; upgraded testing
With more hands on Android now, we can start making our whole development process more future proof.
Both our Composer and Queue are ripe for some new ideas and improvements. We are introducing to both a Reactive Coding Style through RxJava, which should helps us simplify the complex logic.
Together with RxJava we are introducing a coding pattern called MVP – Model View Presenter. This will decouple dependencies and help make everything more reliable, solve bugs we currently have and also make it much easier in the future to just jump in and see whats happening in a certain part of the app.
We’ve also improved the whole process of testing and building our app. Together with our new Android Style guide, we’ve worked a lot to improve our Jenkins deployment workflow. Jenkins will check every pull request for styling and run a suite of tests. If all is green, Jenkins builds an apk to use for Quality Analysis later on.
We also introduced a Open Source Plugin called “Danger” to our workflows. This helps us keep a great coding culture inside our repos. It warns us in case pull requests get too big, or if a certain pull request has no assignee yet. The rules can basically go as far as you wish.
Example of 2 simples rules:
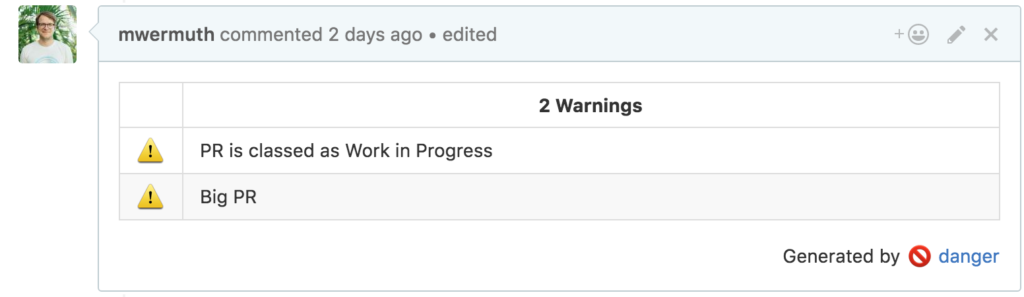
As a last step, all release builds will run Espresso Tests on different devices through the device farm from Firebase. These are automated tests to click through the app following a script we write for each part and see if all is still functioning.
Data: Hackdays, new MRR model
Update by Michael Erasmus
New MRR model increases confidence
The data analytics team has been focused on providing support to the Product, Happiness and Marketing teams, improving models, data tools and dashboards as well as experimenting with ways to spur creativity and innovation using data.
We’ve mostly finished up auditing all revenue data for accuracy and building out new MRR movement models. Through auditing, we realized we were missing Stripe Event data, which has caused us to consistently overreport MRR by around 25k.
After switching to a new data pipeline set up by the systems team, we have a lot more confidence in the MRR numbers.
In addition we’ve built a new MRR movement model that can help us break overall MRR changes down into its components, such as new business, upgrades/downgrades, churn, etc, segmented by plan.
We’ve already found this to be super helpful. Recently we noticed a slight uptick in MRR and were able to attribute the effects to an experiment on the growth team.
We also brought in new, super accurate revenue forecasts. With this, we can get a good sense of where MRR will be at a certain date in the future within a range of confidence intervals, as well as predict when we will hit a certain amount in MRR.
Marketing data and dashboards, improved GA tracking
We’ve recently renewed our focus on marketing and data. We’ve improved some of the dashboards and metrics used by the marketing team, such as metrics around the effect of marketing on trial starts, how our content marketing affected visits and signups, as well as starting work on a greater marketing funnel.
We made some improvements in our Google Analytics tracking in order to make use of funnels and make better data decisions.
Finally, we started some work on measuring and analyzing some of our community work, such as tracking customers whom we’ve sent swag to.
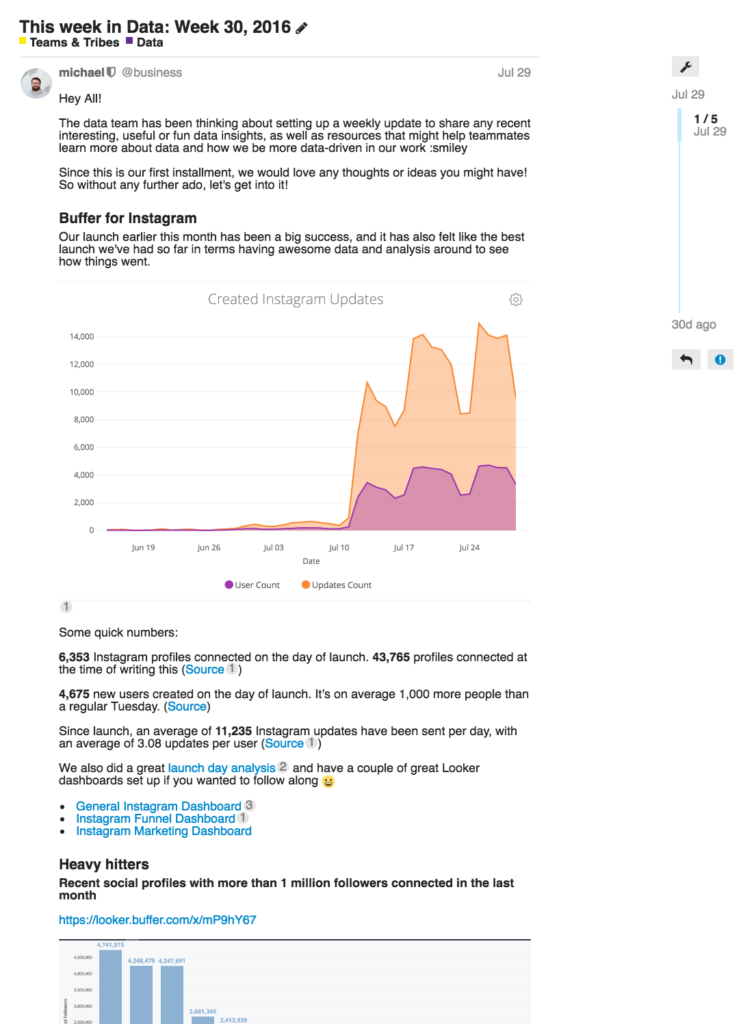
Innovation and Education: “This Week in Data”
This month, we started a weekly discourse (our version of email) sent to the whole company: This week in data. The idea is to share interesting knowledge and useful learnings from data with the rest of the team.
We also had our first set of Hackdays, in which we blocked off two days to work on anything we wanted and team up however we choose.
We ended up having a ton of fun and completed some amazing mini-projects, some of which have already been valuable for our day-to-day work.
Hackdays were rewarding and fulfilling — there was an awesome energy and camaraderie. We were all amazed by how much we could accomplish in a short period of time.
We would definitely try this again, perhaps even once a quarter. It was cool to see how a hackathon could work in a distributed team (perhaps you’ll see this as a blog post soon!)
Data models and tools
We’ve continued building more powerful and robust tools to scale out our data analysis, as well as better models on of our data. We have completed work to host our internal data analysis framework; dataparrot to run on our Kubernetes cluster, and make it easy to deploy using jenkins.
This means that an analyst can take any ad-hoc data analysis or data modeling job, and run it on as a job, on a scheduled basis as new data flows in.
Over to you
As you can see, a lot happens nowadays at Buffer in just one month. We’re really happy with how August went, and we hope to keep the momentum high going into September.
Is there anything you’d love to learn more about? Anything we could share more of? We’d love to hear from you in the comments!
Check out more reports from August 2016:
Try Buffer for free
200,000+ creators, small businesses, and marketers use Buffer to grow their audiences every month.


