
What an interesting month May was for Buffer content marketing! We did a lot of learning, brainstorming and evaluating this month (in addition to writing a lot of content!) As a result, some of these metrics may look different when we do this report next month. But I’m getting ahead of myself. Let’s take a dive into the numbers!

Buffer’s social media blog
Our biggest content “hit” this month was 53+ Free Image Sources For Your Blog and Social Media Posts, followed by The Big List of The 61 Best Social Media Tools for Small Business. Seems like readers really like giant resource lists! Even with those heavy hitters, traffic declined this month while email subscribers and conversions rose.
May stats for the Buffer blog
- 679,021 unique visitors (-6.9% from last month)
- 908,658 total visits (-5.5%)
- 1,154,690 pageviews (-3.2%)
- 1864 conversions (+16.2% from last month)
- 23,629 total email subscribers (+6%)
- 16 total posts published (-4 from last month)
- 13 in-house posts: 11 from Kevan and 2 from me, Courtney
- 3 guest posts: from Noah Kagan, Ed Hallen and Jon Salm
Below is our traffic graph from May. Since our numbers slid some this month, I thought a month-over-month comparison might help us visualize any changes going on (May is in blue; April in yellow). Looks pretty solid; no major declines to speak of.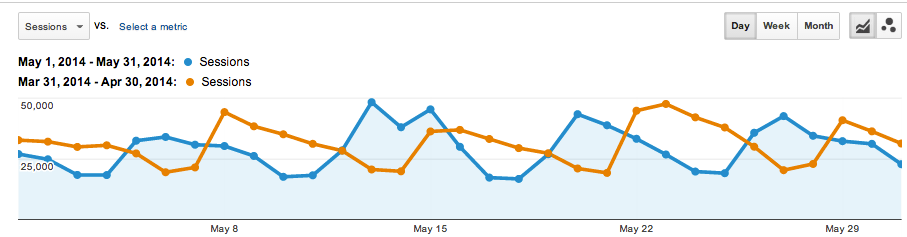
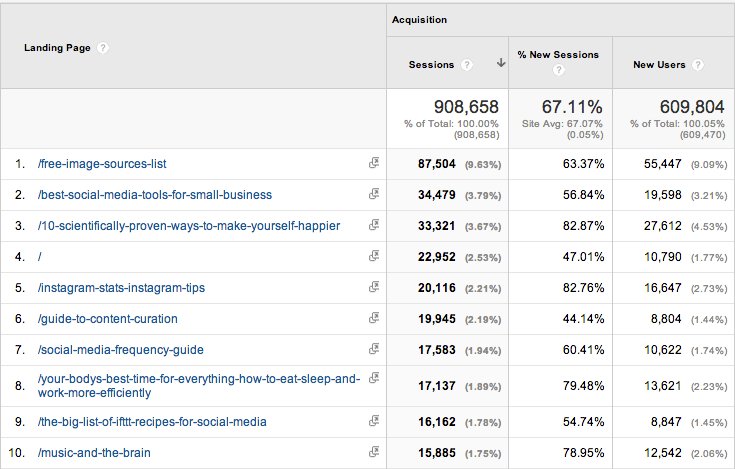
May’s 10 most popular social media blog posts
4 out of our overall Top 10 this month are new for May (they’re marked with an asterisk).
- *
- *
- *
- *
You can see how many views each of these top posts received by looking below at our Top Content page in Google Analytics.
Top referral sources
When we look at our referral sources for the month of May, we get a bit of a clearer picture into the drop in traffic. We see the usual suspects—organic, direct and social—but Twitter traffic has taken a hit as compared to April. It’s down 16% month-over-month, while organic traffic is down about 5% (Could that be the result of Google’s Panda 4.0 algorithm?).
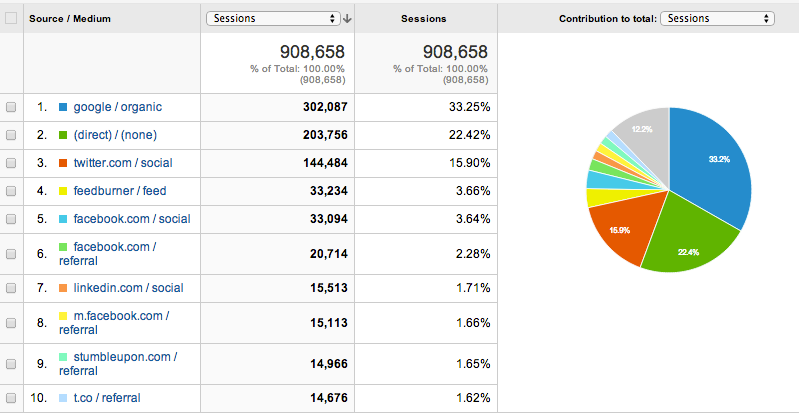
Here’s a look at April’s referral traffic for quick comparison.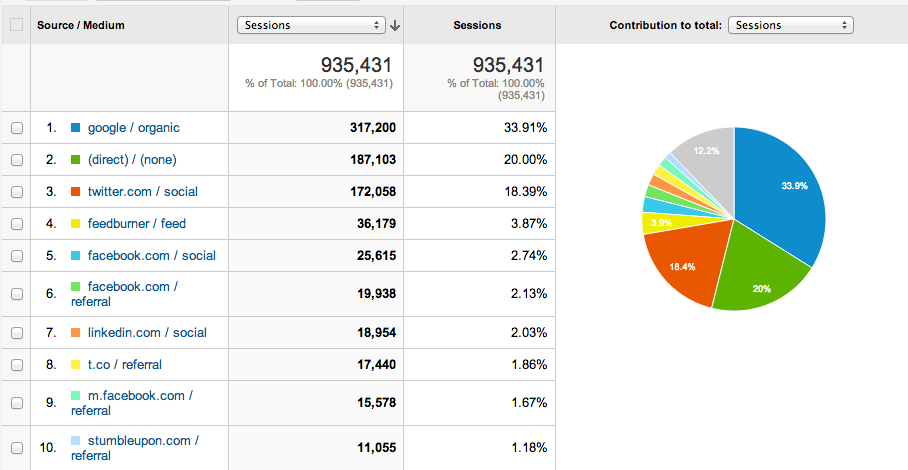
I’m not entirely sure why we saw such a Twitter decline this month, but I have a theory. Our posting schedule didn’t change very much, but we are spending more time tweeting about things other than the content on the social media blog—for example, our awesome Pinterest account, our growing collection of useful YouTube videos, our cool new stickers from Stickermule and, oh yeah, our other blog. These posts might be diverting the traffic we would normally have been focusing on the social media blog.
Quick summary of the Open blog
Speaking of that “other blog,” Buffer Open saw increasing numbers month-over-month for May. We got a little overzealous in our haste to hire more awesome engineers and stacked the back end of the month with a lot of engineering content—perhaps a bit too much for our audience (sorry about that, y’all!). The traffic graph tells the tale. We’ve got a neat course correction I’m excited about to get us back on track without losing those great engineering posts :)
May stats for the Open blog
- 53169 unique visitors (+23.1% from last month)
- 71,140 total visits (+26.1% from last month)
- 94,899 pageviews (+18.7% from last month)
- 19 total posts published (-4 from last month)
- 1,050 email subscribers (+15.8% from last month)
Here’s our traffic graph from May: 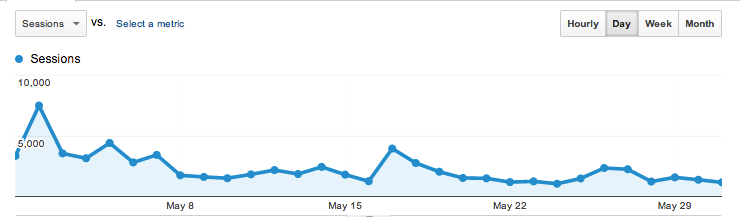
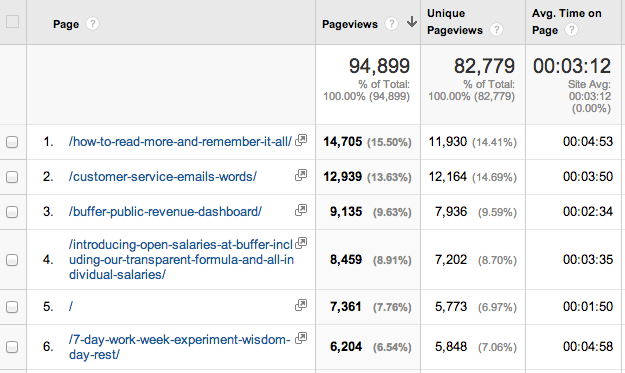
May’s top five Open blog posts
2. The Power of Every Word: Why I Stopped Using “Actually” and “But” In My Customer Service Emails
4. Introducing Open Salaries at Buffer: Our Transparent Formula and All Individual Salaries
5. The 7-Day Work Week Experiment – And the Wisdom of The Day of Rest
You can see how many views each of these top posts received by looking below at our Top Content page in Google Analytics.
Media syndication stats
- 25 total posts syndicated: (+4 from
)
- Sources: Time, The Next Web, Fast Company, Huffington Post, Inc., Business Insider, Social Media Today, PR Daily, Search Engine Journal, Lifehacker, Visual.ly
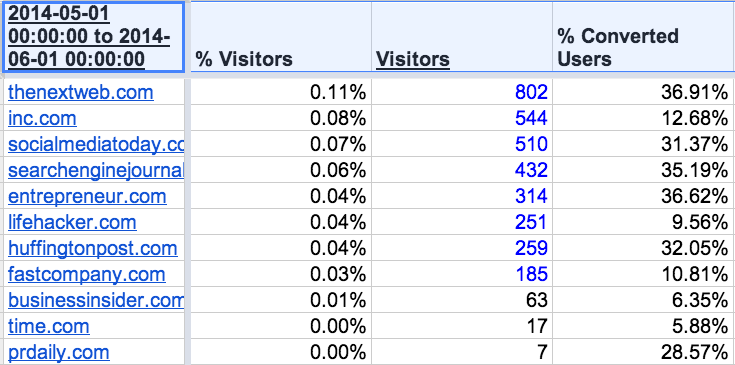
Here’s a breakdown of how many visitors (and what percentage conversion) syndication efforts brought to the blog in May.
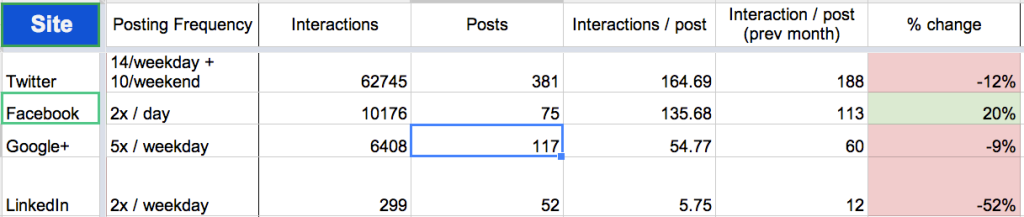
Social stats
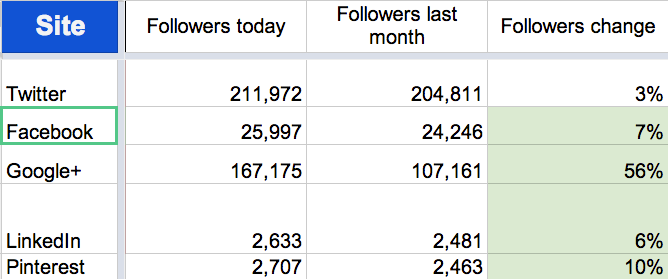
While our followers grew on all social networks this month, our interactions were down for every network except Facebook. It would be great to dig into Facebook and figure out what we’re doing right there and if there are any insights we can extrapolate to our conversations on other networks.
Followers
Interactions
Thoughts and outlook
Redefining the metrics that matter
We spent some time this month thinking “big thoughts” about what role Buffer’s blogs should play in our overall journey. First and foremost, we want all our content to be consistent useful for our audience. We’d love to get to introduce everyone to how Buffer can benefit their social media efforts, but that’s a secondary goal.
With that in mind, our next question was: Is traffic the best way to measure whether we’re effectively reaching out goal? We don’t believe it is, so we’ll be emphasizing it less as a metric and focusing more on growing email subscribers as our main metric. We might also look at growing metrics like time on page and returning visitors, as those could be cues that we’re providing the value we always hope to.
More focus for the Open blog
For the Open blog, we asked a different question: “What do you want to see on this blog?”
With content on customer support, engineering, Buffer news, productivity and more, we wondered if we were taking on a few too many topics. A quick Qualaroo survey placed on the blog for a few days showed us pretty clearly what folks want to read:
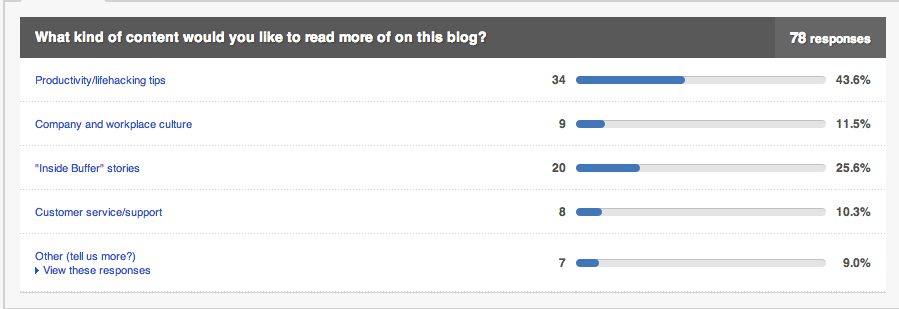
It feels great to get a little more focused here. We’ve got lots of lifehacking and productivity content in the works, and we’ll be showing you more peeks inside the Buffer culture as well.
Engineering content gets its own home
Although it may not be the right fit for the Open blog, we didn’t want to lose all the awesome engineering content our Buffer engineers produce. So we’ll be opening up yet another blog! Or, rather, re-opening it. Buffer Overflow is the new place to find everything development-related and we have tons of good stuff coming up there!
More original visuals
One last thing I’m really excited about: In May, Crafters got serious about visual content and launched a new initiative to create at least one original visual to accompany each post on the Social Media blog. We’re not professional designers by any means, but with a little help from Canva and other visual tools, we’re making progress! You can see lots of these images on our Pinterest page.
What other marketing insights would you find helpful for me to share here? Are there any questions about our blogs, our team, or our social media marketing that we can answer? Share them in the comments, I’d love to keep the conversation going.
Try Buffer for free
200,000+ creators, small businesses, and marketers use Buffer to grow their audiences every month.


