February was a month of big transitions for the Buffer blog. Our overall traffic decreased 8% compared to January (read on for our theory as to why) as Leo trained the new girl (that’s me!), Belle cut back on her posting schedule as she works on her own start-up and we worked on expanding the team further – more on that in a minute.
Let’s take a look at the details!
Quick summary
In February, we had 600,630 unique visitors (down 8% from January). There were 794,884 total visits, resulting in 1,005,169 page views. We had a total of 1,019 conversions resulting from the blog in February.
Traffic stats
- 600,630 Unique visitors (-8% from Jan)
- 794,884 Total visits
- 1,005,169 Pageviews
- 22 total posts published (+2 from Jan)
- 21 in-house posts: 10 from Belle, 9 from Courtney and 2 from Joel
- 1 guest post: from James Clear
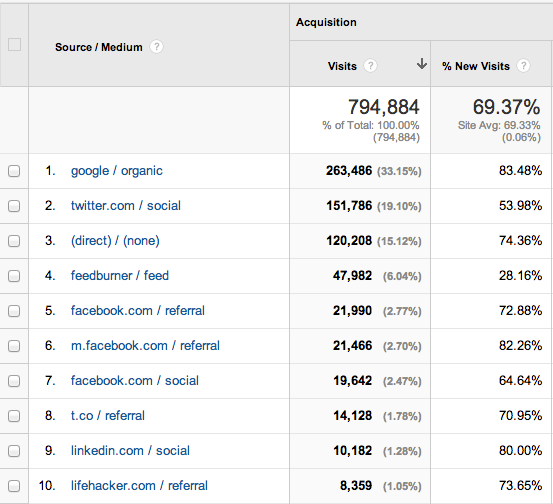
- Top 3 referral sites: Twitter (165,914 visits), Facebook (63,098 visits) and Feedburner (47,982)
- Email subscribers: 1,664 new subscribers (4.7% list growth from 18,497 in January)
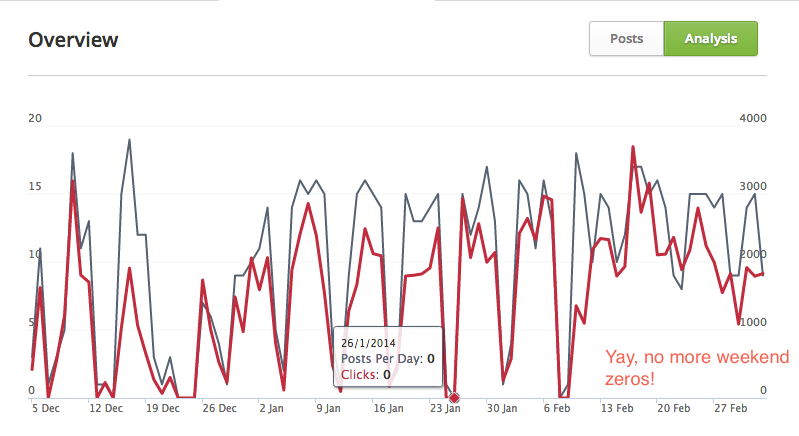
Here’s our traffic graph from February:

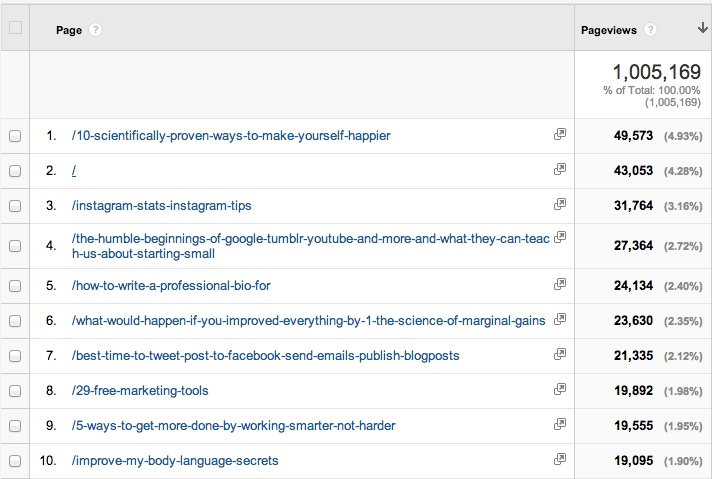
February’s 10 most popular posts
A perfectly even mix of social media/marketing posts and lifehacking/productivity posts cracked the top 10 for this month. Catch up on any of them here:
-
-
- 10 Simple Things You Can Do Today That Will Make You Happier, Backed By Science
- 8 Surprising New Instagram Statistics to Get the Most out of the Picture Social Network
- The first version of Google, Facebook, YouTube and more (and what they can teach us about starting small)
- How to Write a Professional Bio For Twitter, LinkedIn, Facebook & Google+
- What Would Happen If You improved Everything by 1%: The Science of Marginal Gains
- A scientific guide to posting Tweets, Facebook posts, Emails and Blog posts at the best time
- 29 Free Internet Tools To Improve Your Marketing Starting Today
- 5 Unusual Ways to Start Working Smarter, Not Harder, Backed by Science
- The secrets of body language: why you should never cross your arms again
- Why Facebook is blue: The science of colors in marketing
-
And check out how many pageviews each of the top 10 had in our Top Content page in Google Analytics:

Top referral sites
What were the sources that brought the blog the most visits? A good mix of search and social sources, with a nice bump from Lifehacker rounding out the top 10.

Top republishing sources
-
-
- 13 total posts republished: (-4 from Jan)
- Sources: The Next Web, Lifehacker, Fast Company, Huffington Post, Inc., Business Insider, Search Engine Journal
-
1. Lifehacker
Traffic: 8359
Conversions: pending
Conversion rate: pending
2. Fast Company
Traffic: 2093
Conversions: 181
Conversion rate: 8.7%
3. The Next Web
Traffic: 1310
Conversions: 354
Conversion rate: 27%
4. Inc.
Traffic: 991
Conversions: 177
Conversion rate: 17.9%
Thoughts and outlook:
Why unique traffic was down
We wanted to get to the bottom of why our unique visits were down for the month, and we theorized that the short month of February was the reason. We did a quick experiment broadening the analytics period to March 3 in order to get a 31-day window more representative of a typical month. When we did that, we saw 656,447 uniques, which is a tiny bit of growth (.3%) from January’s 654,126 total.

New Crafters, new ideas
With Kevan starting his Buffer bootcamp in March (and me winding up mine), March should be another transitional month as we both learn the ropes and experiment with new ideas. We continue to refine our content mix, aiming for about a 70-30 ratio of social media-focused content to general lifehacking and productivity content. We definitely didn’t get there in February – it was more like 40-60.
More weekend posting
One simple change that we started on this month was to make sure to keep the Buffer queue full, even on the weekends. You can see a clear distinction in our analytics part of the way through the month when we made this change.

Definitely want to keep this experiment going!
Better sign-up tracking
Our Growth team is putting a ton of cool new things in place to help us track how the blog is doing as far as introducing new customers to Buffer, and I’m excited to tell you about the results of those changes soon. Right now, we can see the number of total conversions from the blog – that number includes anyone who signed up for any Buffer plan, free or paid – from the blog. It would be really great to
Making it easier to sign up from the Buffer blog
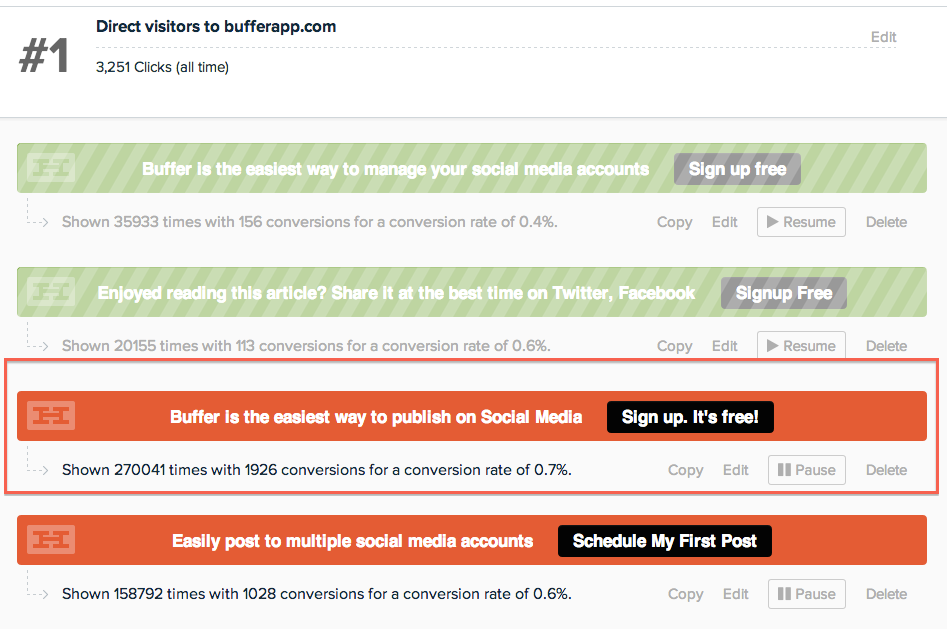
Finally, we’ve been doing some experiments to see if we can bring more new Buffer users over from the Buffer blog. You might have noticed the bar across the top of the blog now:

That’s the Hellobar, and we’ve been testing some different messages and colors to see which one resonates the most with our blog readers. You can see how we’re doing on that so far:

We’ll tell you more about that experiment as we get more data.
What did you think of the Buffer blog in February? Any standout posts or changes catch your eye? Let us know!
Try Buffer for free
190,000+ creators, small businesses, and marketers use Buffer to grow their audiences every month.


