
What Happened When We Prioritized Live Chat: Buffer’s October Happiness Report

Chief of Staff @ Buffer
We had fun getting back to our customers faster in October due to a renewed focus on our goals. As we were all back in our respective timezones, this was a bit easier than September.
October is usually the last “normal” month before the holidays kick off, so it felt great to focus fully on continuing to improve the customer experience during this time.
We also questioned some of our processes and put an experiment into place to learn a bit about how all of our support channels interact. Let’s dive in!
An experiment: How conversations spread among additional channels
One particularly fun and interesting experiment we embarked upon in October was a broader exploration into multiple support channels, and how they affect each other. Namely, we hypothesized that if we leaned into one channel, it would affect the volume of the others.
Spoiler alert: this was invalidated, and it invited us to ask ourselves some big questions about what that result means for us. As a bit of backstory, we’ve had a running joke in the Buffer Happiness team in which everything we say that we haven’t yet observed is followed by the phrase, “in theory!” So, we decided to actually put one of these theories to the test.
It can be hard to quantify “great customer service,” so we’ve often relied on our foundational belief that faster replies inherently result in happier folks who work with us. So, since we have the absolute fastest responses on live chat, we thought that it would be fun to lean into that tool and see what happened.
We prioritized live chat (through Olark) first, Twitter (through Sparkcentral) second, and email (through Help Scout) third, as those get fastest, middle, and slowest response times respectively. We theorized that more Olark conversations would result in fewer emails and tweets.
What we expected
Hypothetically, each live chat conversation would replace one email or tweet conversation. To look at replies instead of conversations, since we have an average of 1.3 replies per conversation, each additional 100 live chats would decrease total replies by 130.
Naturally, the math gets a bit fuzzy. Since no two consecutive months are exactly the same, it’s not a perfect comparison. However, we expected this to be the trend.
What we found instead
Our theory was invalidated! We had several hundreds more live chats, and still increased our email and Twitter conversations. Launches, bugs, and other “events” can of course influence this, but overall we believe that that wasn’t the sole cause of the numbers.
So what does that mean? For us, it means that by adding an additional support channel, we increase the total volume of conversations between Heroes and customers. It does not simply spread out the total conversations among all of the tools.
What an exciting conclusion! Though our theory was wrong, we feel that the results are even more interesting this way.
This means that as our team grows, we have the ability to reach even more customers by inviting conversation through additional touchpoints.
While we hope that customers can improve their social media presence and save time with Buffer without having to get in touch, we learn faster, fix bugs and improve the product faster, and understand our customers’ needs better the more we hear from them. We’re really lucky to have you all in this kind of supportive community.
Scaling back live chat for now
On the heels of this conclusion, a member of the Happiness team took on a new role at Buffer, and we started to learn more about which channels are the most valuable to customers. We learned that while total volume increased, most urgent questions were still coming in through email and Twitter. With the priority on the third tool, it was sometimes a bit of a scramble to do all three well.
So, somewhat ironically, we are now scaling back on live chat in order to focus on email and Twitter. We want to improve the experience of those two and not spread ourselves too thin as we look to hire to fill the empty spot.
(Speaking of which, we are looking to grow the team even beyond the now-empty spot, so if you’d like to help us provide great service to our community, we’d love to hear from you!)
How we did in October
Let’s hear from our email and Twitter teams. :)
Email update from Åsa
The month of October was very much a month of organizing and structuring our days to hit our goals. We started communicating a lot more and managed to turn around the longer response times from the first week of October. It was amazing to see how everyone shifted gears and increased their focus. Going back to reflecting and being more aware of individual goals also had a great impact on productivity!
Since our Happiness Engineer is focusing mostly on Buffer for Business right now, we pushed for increased “Hero help” to better tackle the tricky tickets as a team. We took extra time to sync about whether or not we could solve it before inviting a developer to take a look.
We hit our goals (and even exceeded them!)
Some more numbers:
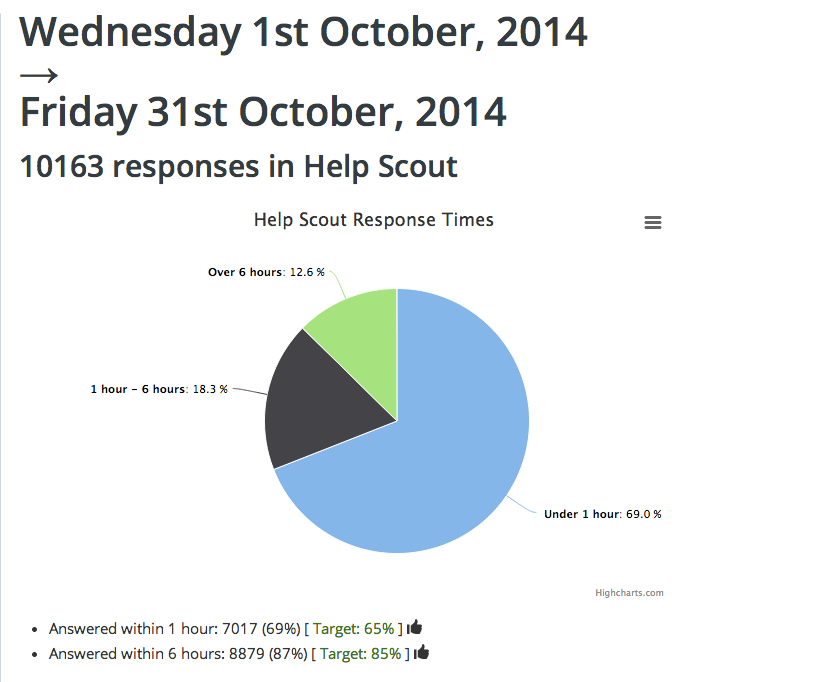
- We sent 10,163 responses in HelpScout (we sent 8,589 replies in September)
- We helped 4,342 customers (+19% from September)
- We sent on an average 337 replies per day (+18 from September)
- We had a total of 7,625 conversations with 5,977 customers
- The busiest time in the inbox is Thursdays 6-9 a.m. PST
Twitter update from Mary
This was a really exciting month. October had a bit more focus on response times and individual goals than the last few months. It seems like by having these conversations more frequently and making a few adjustments, we blew past our response times to hit the highest we’ve hit yet! This month ended with:
- Answered within 15 minutes: 6,454 (72%) [Target:63%]
- Answered within 1 hour: 7,760 (87%) [Target:83%]
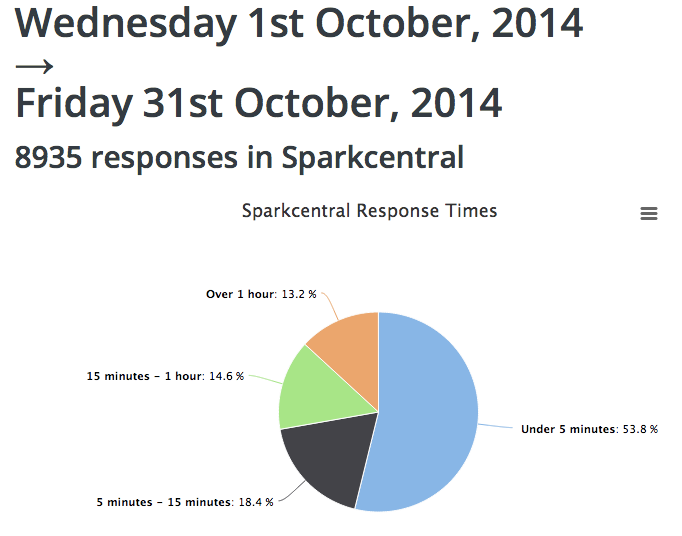
We also responded to 3,490 more tweets than we did in October. We started doing scheduled hours of time for each hero in Sparkcentral during week 41, and I think this helped for the “within 15 minutes” goal.
Another change we made during week 42 was to autoarchive any tweets that simply share a link from blog.bufferapp.com or open.bufferapp.com without any questions or comments for us.
We started doing this to prioritize the customers with questions/looking for support following timezone gaps and then slowly evolved to just leaving the auto-archive on. (Although we’re super grateful for all who share our content!)
Here’s a screenshot of the levels chart for the month:
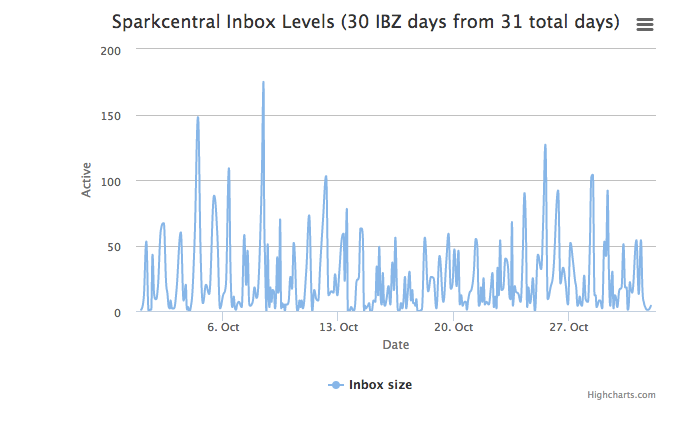
It seems the middle of the month, right when we introduced this, was possibly the most effective.
One thing I think is really awesome is that 20 different team members tweeted from @buffer throughout various delivering happiness and customer development days.
Over to you now!
One of my favorite things about compiling this report each month is hearing from other customer service folks to share stories, ask questions, or comment on our challenges or conclusions. I’d absolutely love to hear from you in the comments below or on Twitter!
Try Buffer for free
180,000+ creators, small businesses, and marketers use Buffer to grow their audiences every month.
Related Articles

Note: This is the quarterly update sent to Buffer shareholders, with a bit of added information for context. We share these updates transparently as a part of our ‘default to transparency ’ value. See all of our revenue on our public revenue dashboard and see all of our reports and updates here . It's been quite the y

Editor’s Note: Thanks for checking out this post! We’ve released our updated 2021 pay analysis here. You can’t improve something if you don’t know that it needs to be improved. That was very true for us four years ago when we first started looking into equal pay at Buffer. We have long used a salary formula to determine all of our salaries – the same role in the same part of the world receives the same salary. That m

Ever since the world got turned upside down by COVID-19, it’s been “business as unusual” for everyone – Buffer included. I sent this update out to Buffer’s investors one week ago. I hesitated on whether to share it more widely, as I know a lot of companies have been impacted more severely in these times. That said, I believe it makes sense to lean into our company value of transparency, since there may be some companies this could help, and it shows Buffer customers that we will be around beyon