

How do you really know if your likes, comments, and shares are “good enough”? It’s easy to stare at your own numbers in isolation and feel unsure. Sometimes, your social performance only makes sense when you can stack it up against businesses similar to yours.
In this article, I’ll walk you through the latest social media benchmarks across five major platforms, giving you a clear, grounded sense of where you stand and where you can grow.
I’ve used data from the following Buffer reports:
- Buffer’s best times to post on social media — which analyzed one million posts sent through Buffer
- Buffer’s Instagram benchmarks — calculated using aggregated data from over 27 million posts from 273k active Instagram accounts with over 13 billion engagements.
- Buffer’s Facebook benchmarks — calculated using aggregated data from over 52 million posts from 213k active Facebook accounts
- Buffer’s best content format on social platforms — based on an analysis of millions of social posts from multiple platforms
- Buffer’s guide to social media frequency — our data-backed recommendations on how often to post on each platform
- Buffer’s engagement rate data for eight social media platforms
⚠️ Before we get into the data: a caveat
“Good” looks different for everyone. Your brand might not need a massive audience to hit its goals. Maybe your content is highly localized, maybe you publish less often but with more depth, or maybe your audience behaves differently from industry norms — and that’s OK.
Social media benchmarks are not here to put you under pressure. Each study pulls data from different companies, niches, and posting volumes, so treat these numbers as a helpful guide, not a commandment. Use what serves your strategy, and leave the rest behind.
Jump to a section:
- What do social media industry benchmarks mean?
- Which social media metrics should you care about?
- Breaking down social media benchmarks by platform
- How to use social media benchmarks to your benefit
- So, how did your socials stack up against these social media benchmarks?
- More social media insights
- FAQ about social media benchmarks
What do social media industry benchmarks mean?
Social media benchmarks are a lever against which you can measure your own performance.
Comparing your social media performance to relevant benchmarks can help you:
- Set ambitious but achievable goals
- Report a 360-degree picture to leadership
- Pinpoint areas of growth
Which social media metrics should you care about?
The X-axis is your industry. Which metrics should you look for in the Y-axis? Here are four social media marketing metrics to keep an eye on:
1. Posting times
There’s no universal right time to post on social media, but there are certain times when you might get more engagement than others. Benchmark data helps you understand the best time to post based on patterns spotted from millions of posts.
2: Post type
Many social networks today have a ton of content formats — images, stories, carousels, videos, etc. Understanding which type of post works best for which platform helps you repurpose content efficiently and prioritize the best content types for your social media calendar.
3: Posting frequency
Posting frequency is the number of times you should post on a social media platform over a certain time period.
There’s an ideal post frequency for every network to get the most engagement, but it’s not always consistent across industries. Some niches might need to post more because their industry has a lot of competition on social media, while others might not need to be so strict with how often they post.
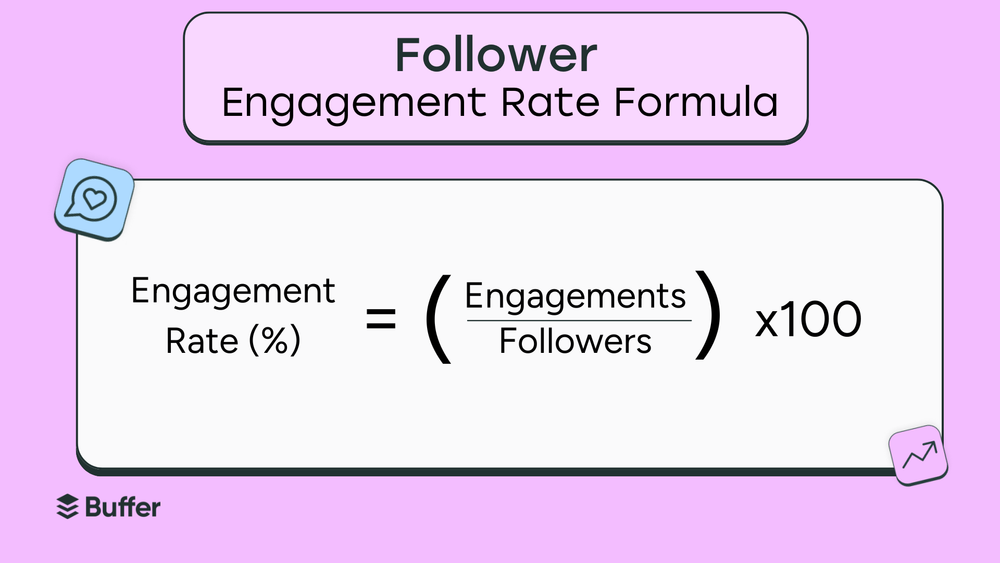
4: Engagement rate
Engagement rate is typically calculated as the total number of likes, comments, and shares divided by the total number of followers multiplied by 100.
Why should you care about social media engagement rate?
The number of interactions your posts receive determines whether your target audience resonates with your social media content. The higher the engagement rate, the more your followers like your social media posts.
⚠️ More caveats
I’ve shared four key metrics here, but the benchmark data you care about can vary depending on your social media goals.
For example, if your goal is to increase your follower count, you might also want to do a competitive analysis of follower growth in your industry. If your aim is to improve brand awareness, you might also want to monitor impressions and reach.
Breaking down social media benchmarks by platform
Here at Buffer, we’re always looking for ways to help you grow on social media. The good news is that we have plenty of information (and some seriously smart people) to provide data-driven insights that will help get you there.
I’ve collated some of the information for you to break down the social media benchmarks for five popular social media sites.
Social media benchmarks at a glance
Social media benchmarks for Facebook
Best time to post on Facebook
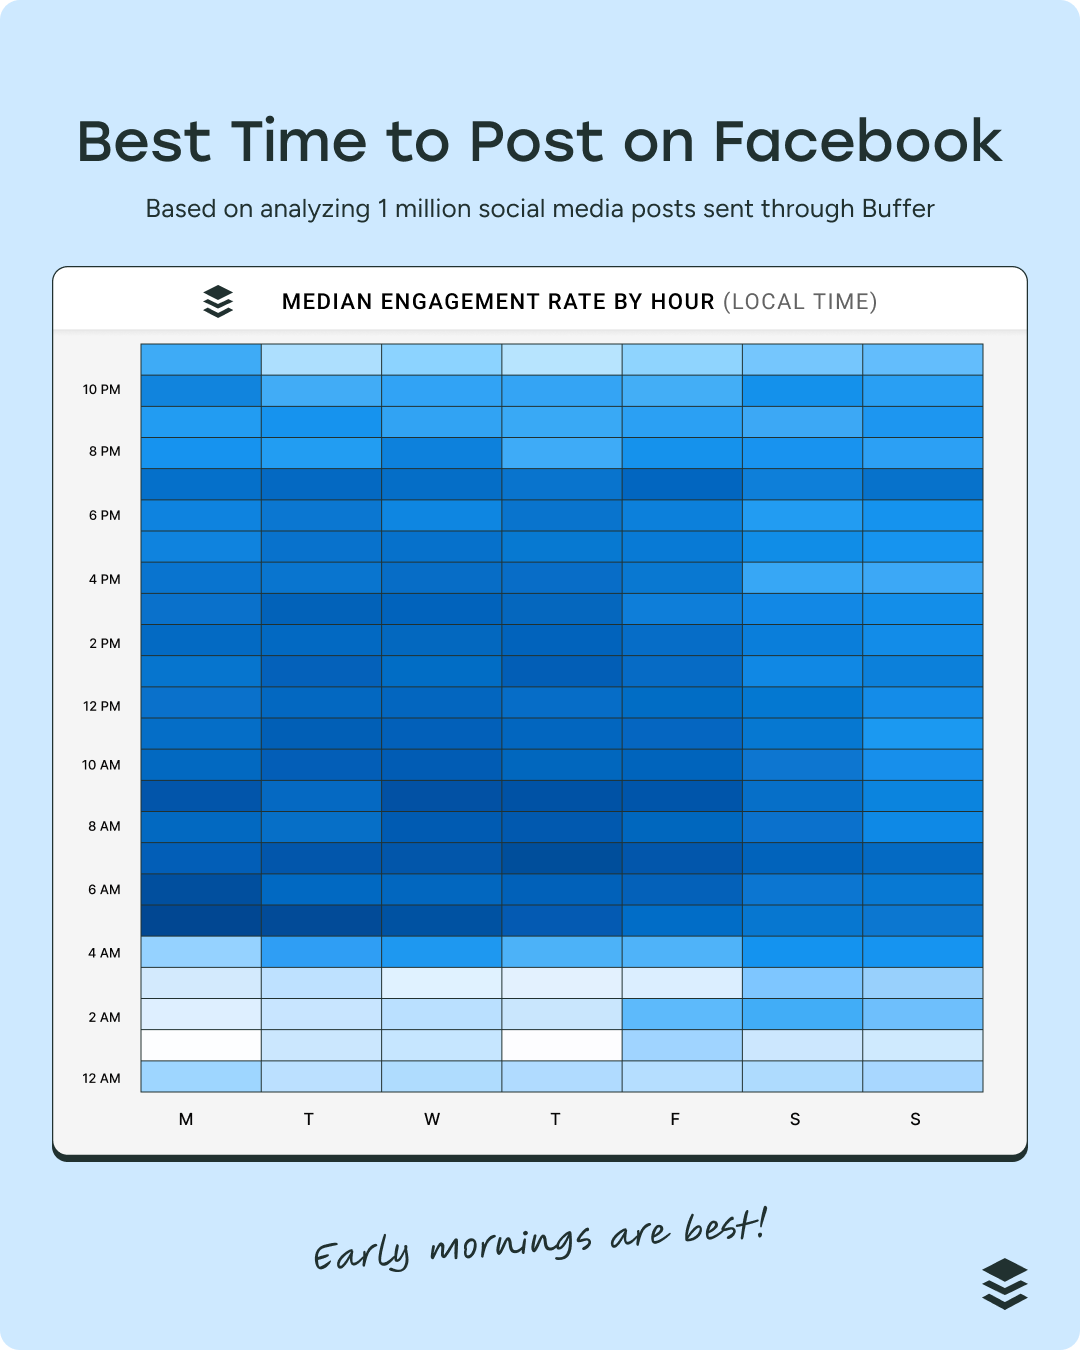
Sorry, night owls; the best time to post on Facebook is 5 a.m. on Monday, according to Buffer’s analysis of more than a million posts.
Best type of post on Facebook
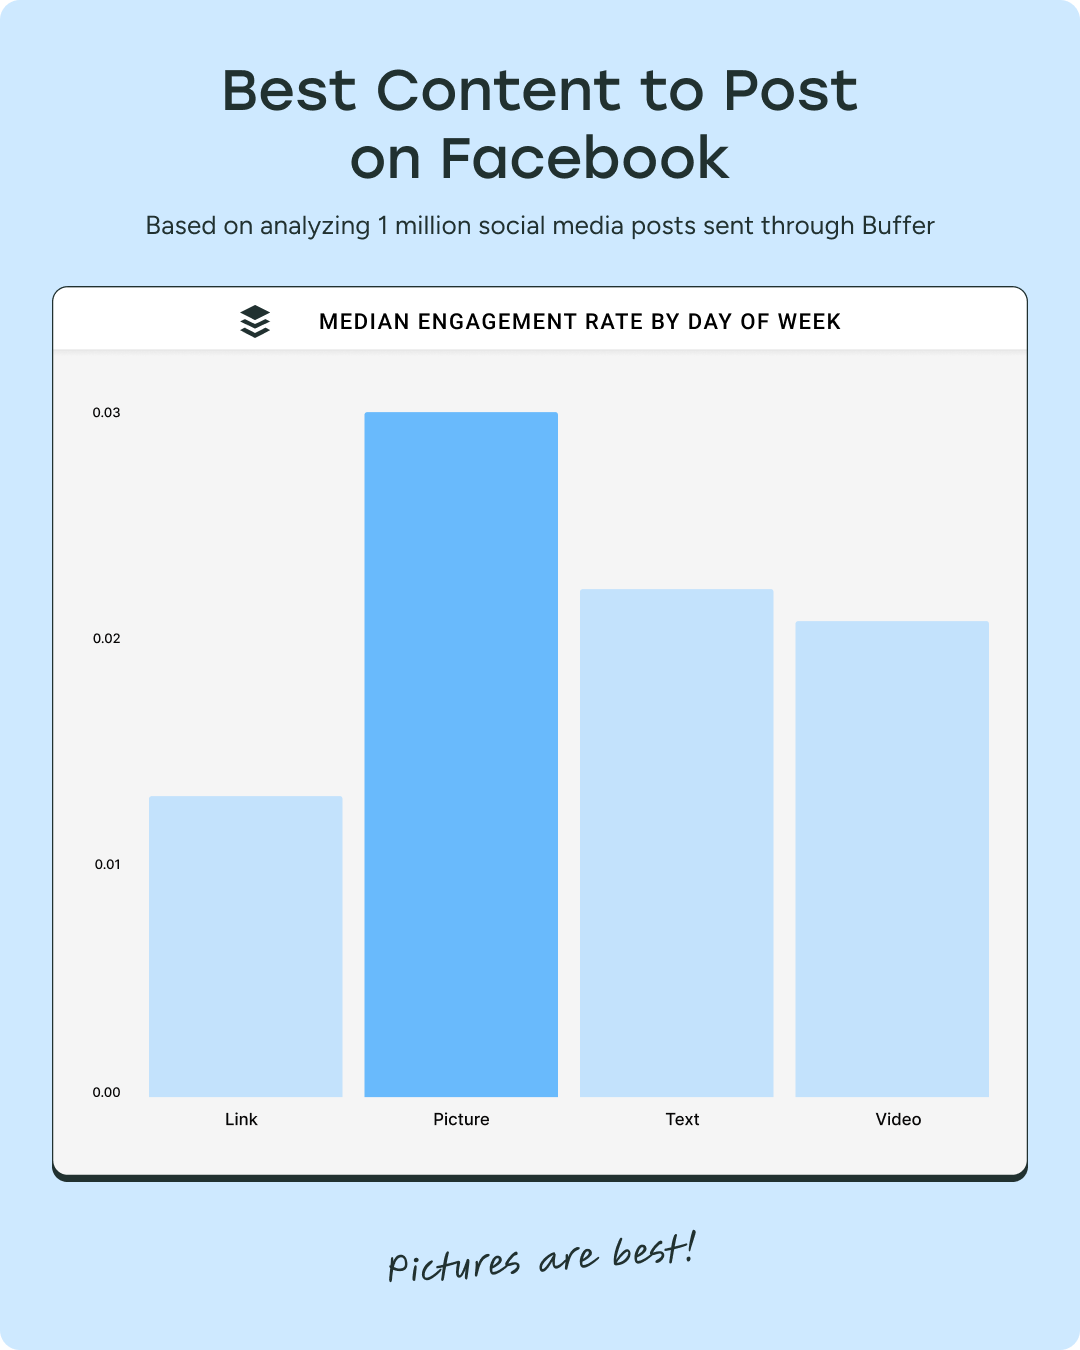
Video may have killed the radio star, but according to our research, pictures get the most engagement on Facebook, earning 35% more engagement than text posts and nearly 44% more than videos.
Median number of posts (monthly) on Facebook
Our Facebook benchmarks data pegs the median Facebook posting frequency at 35 posts per month, so 1-2 posts per day.
Median engagement rate on Facebook
According to Buffer’s analysis of 52 million Facebook posts across 213k accounts, the median Facebook engagement rate is 3.6%. But who wants to be average? It’s important to remember that averages only tell part of the story. The more useful insight comes when you compare your own performance to accounts of a similar size, which you can do right here.
Social media benchmarks for Instagram
The best time to post on Instagram
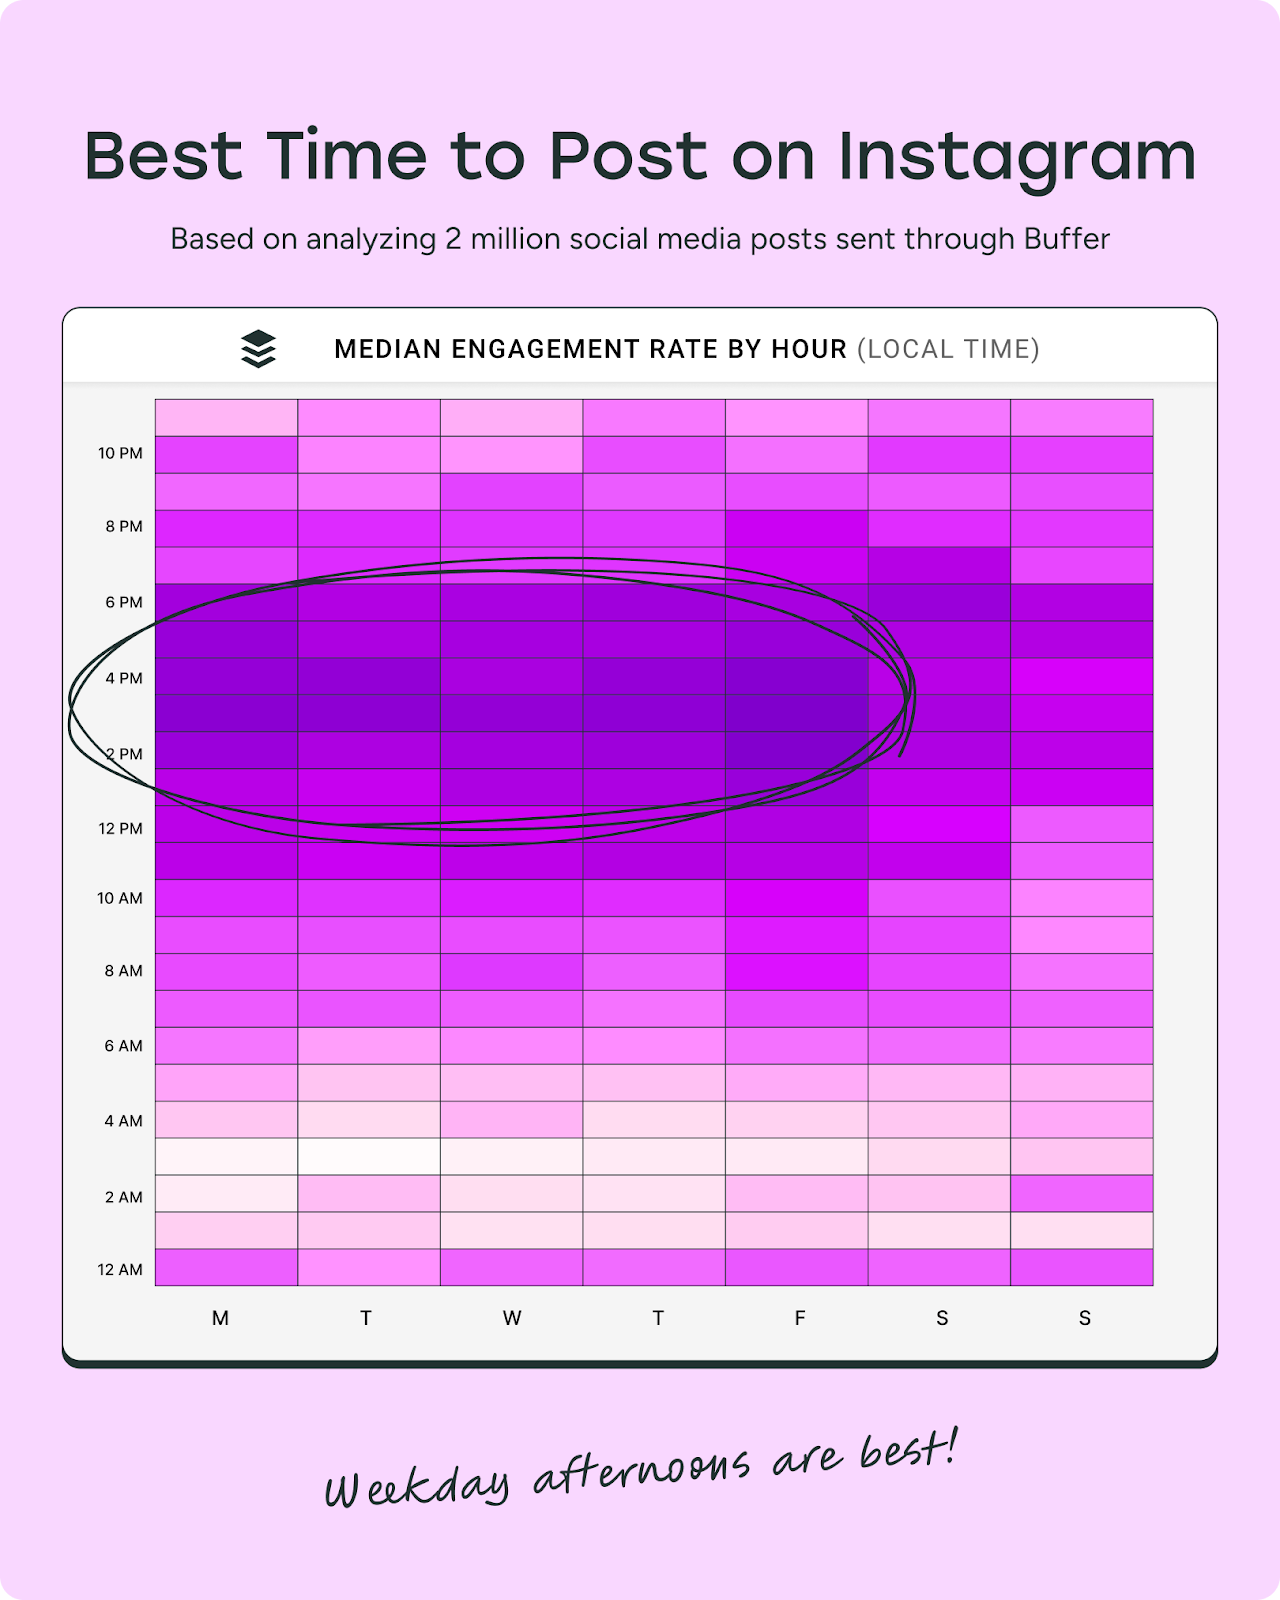
Buffer’s analysis of over 2 million posts found that the best time to post on Instagram is generally 3 p.m. and 6 p.m. on weekdays. Fridays at 3 p.m. took the top spot.
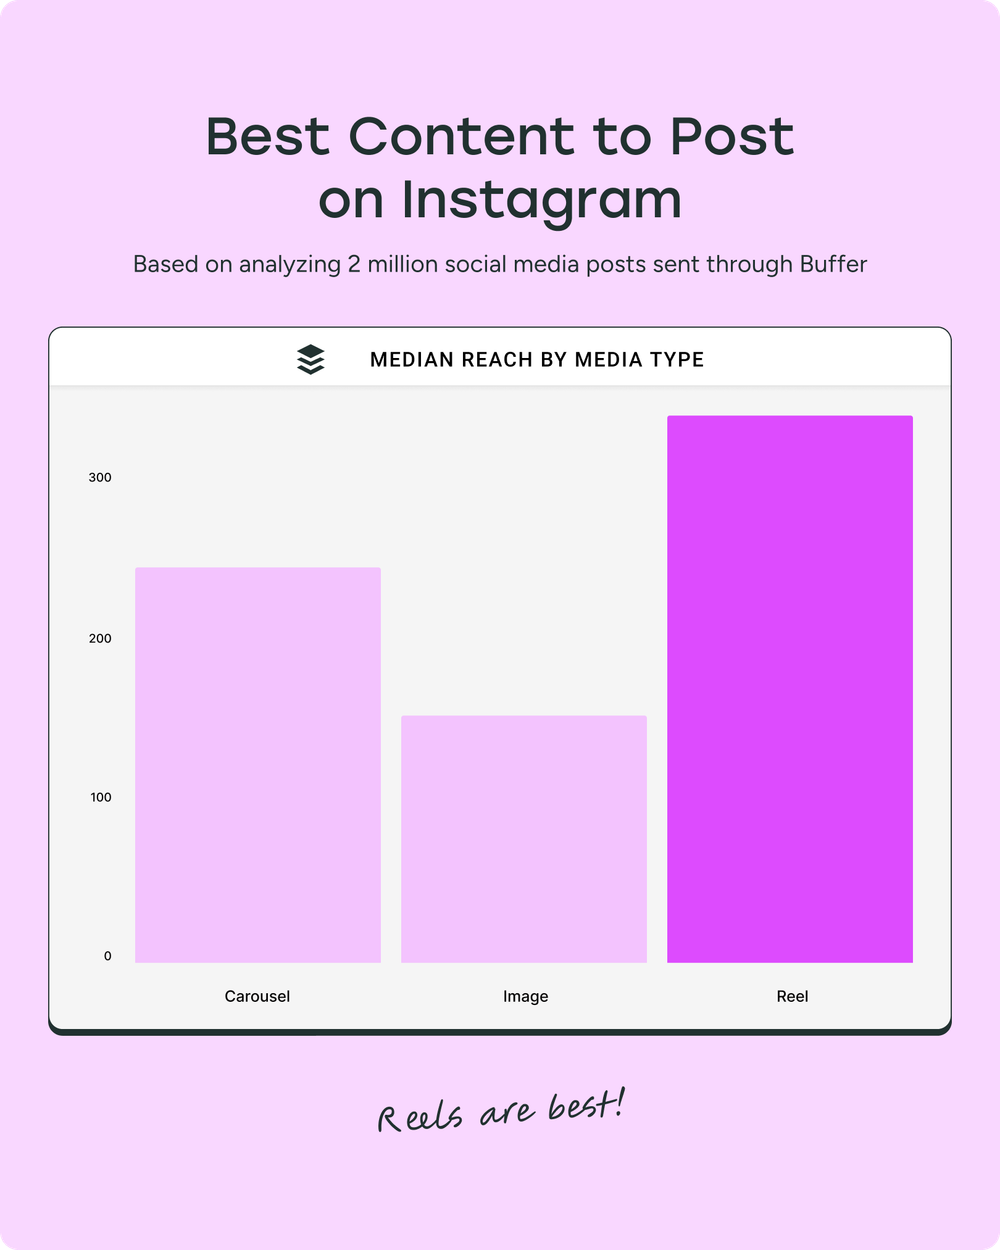
The best type of post on Instagram
Our research of over 2 million Instagram posts found that the best content format for maximum reach is Instagram Reels.
Median number of posts (monthly) on Instagram
The average Instagram posting frequency on Instagram is 17 posts per month, so a post round about every second day.
Median engagement rate on Instagram
The median engagement rate on Instagram is 4.3%. Again, I recommend filtering the data (nifty, right?) to show accounts with a similar size to yours for a more accurate comparison of your content performance. For example, accounts with less than 1k followers averaged 5% engagement, while those with 10–50k followers got a 3.7% engagement rate.
Social media benchmarks for TikTok
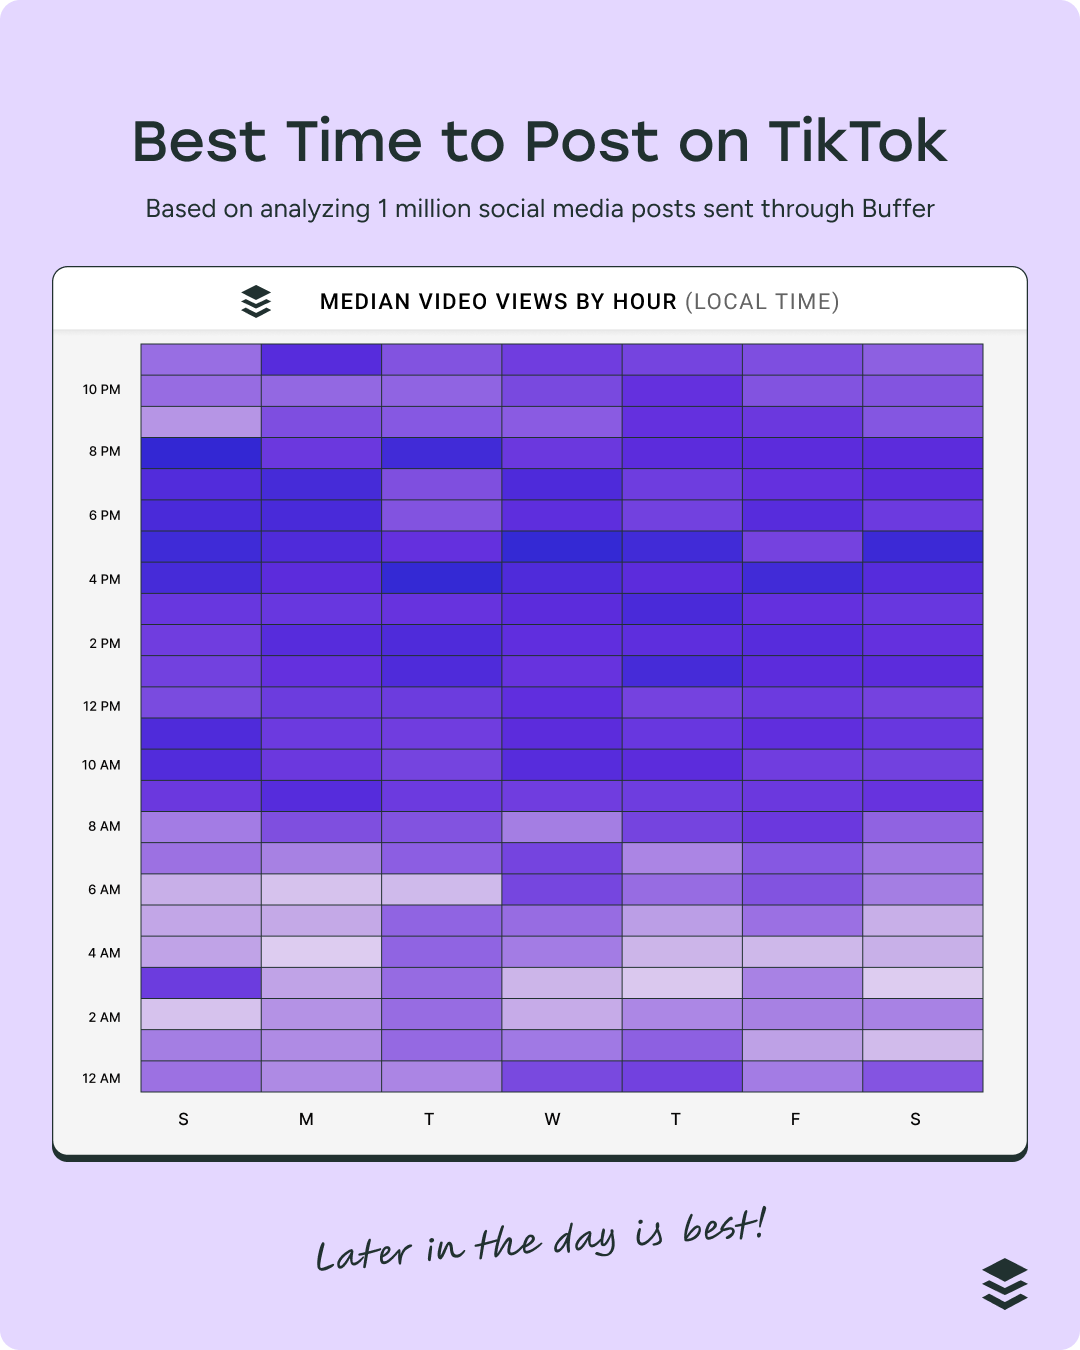
The best time to post on TikTok
According to our data, the best time to post on TikTok is Sunday at 8 p.m. Generally speaking, views tend to pick up later in the day, with peak time slots at 1 p.m. or later.
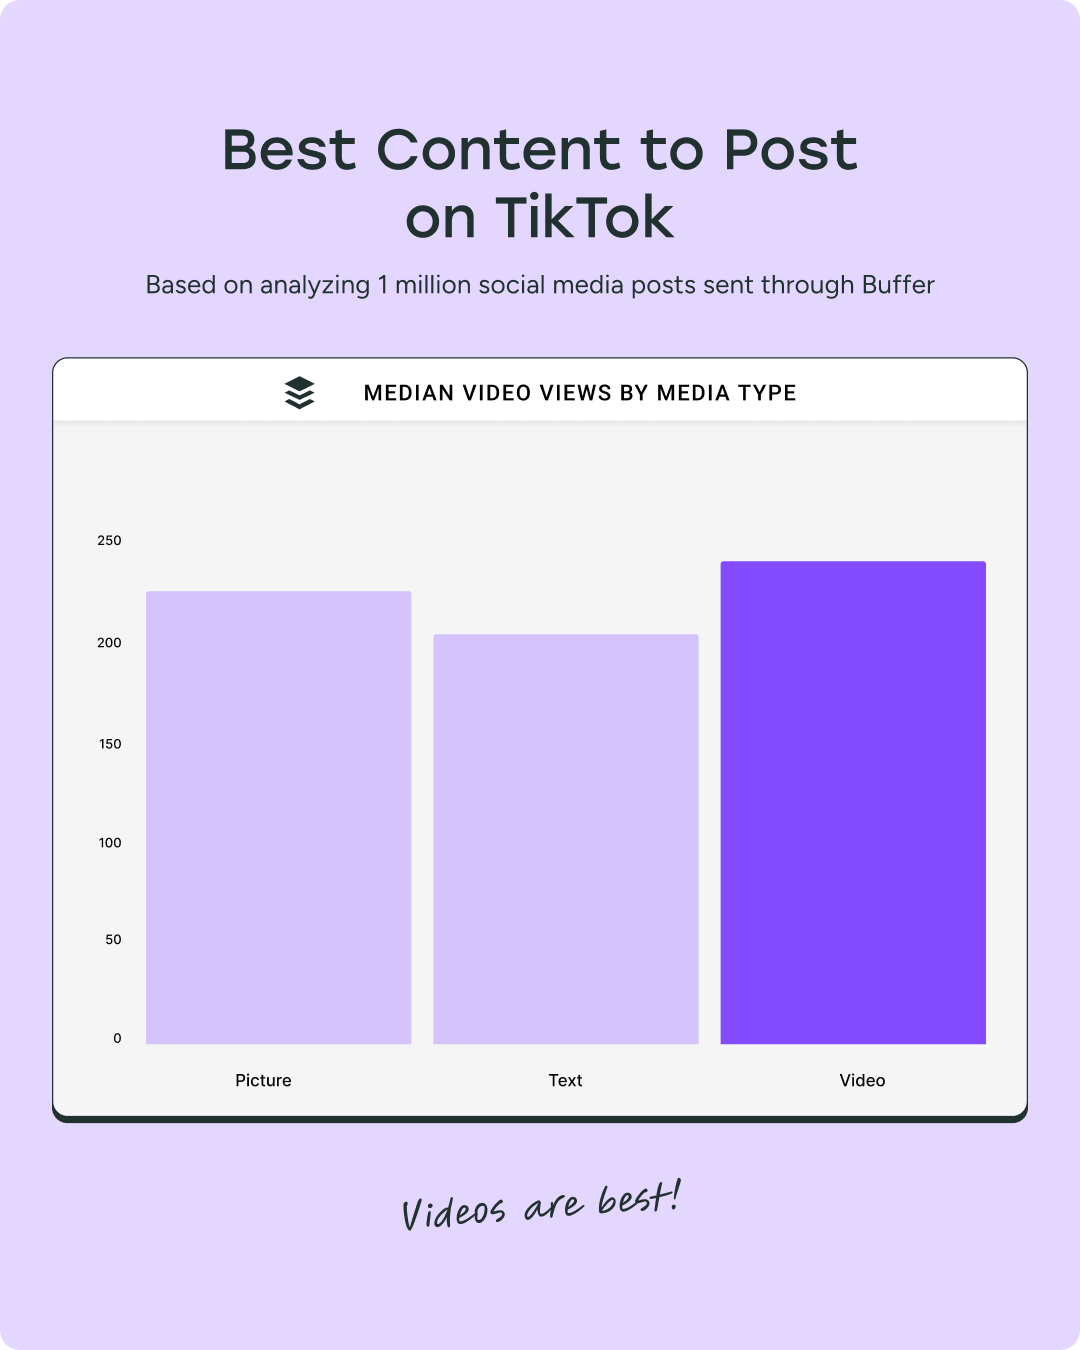
The best type of post on TikTok
No surprises here. Based on Buffer’s analysis of over 1 million posts, videos on TikTok get the most views.
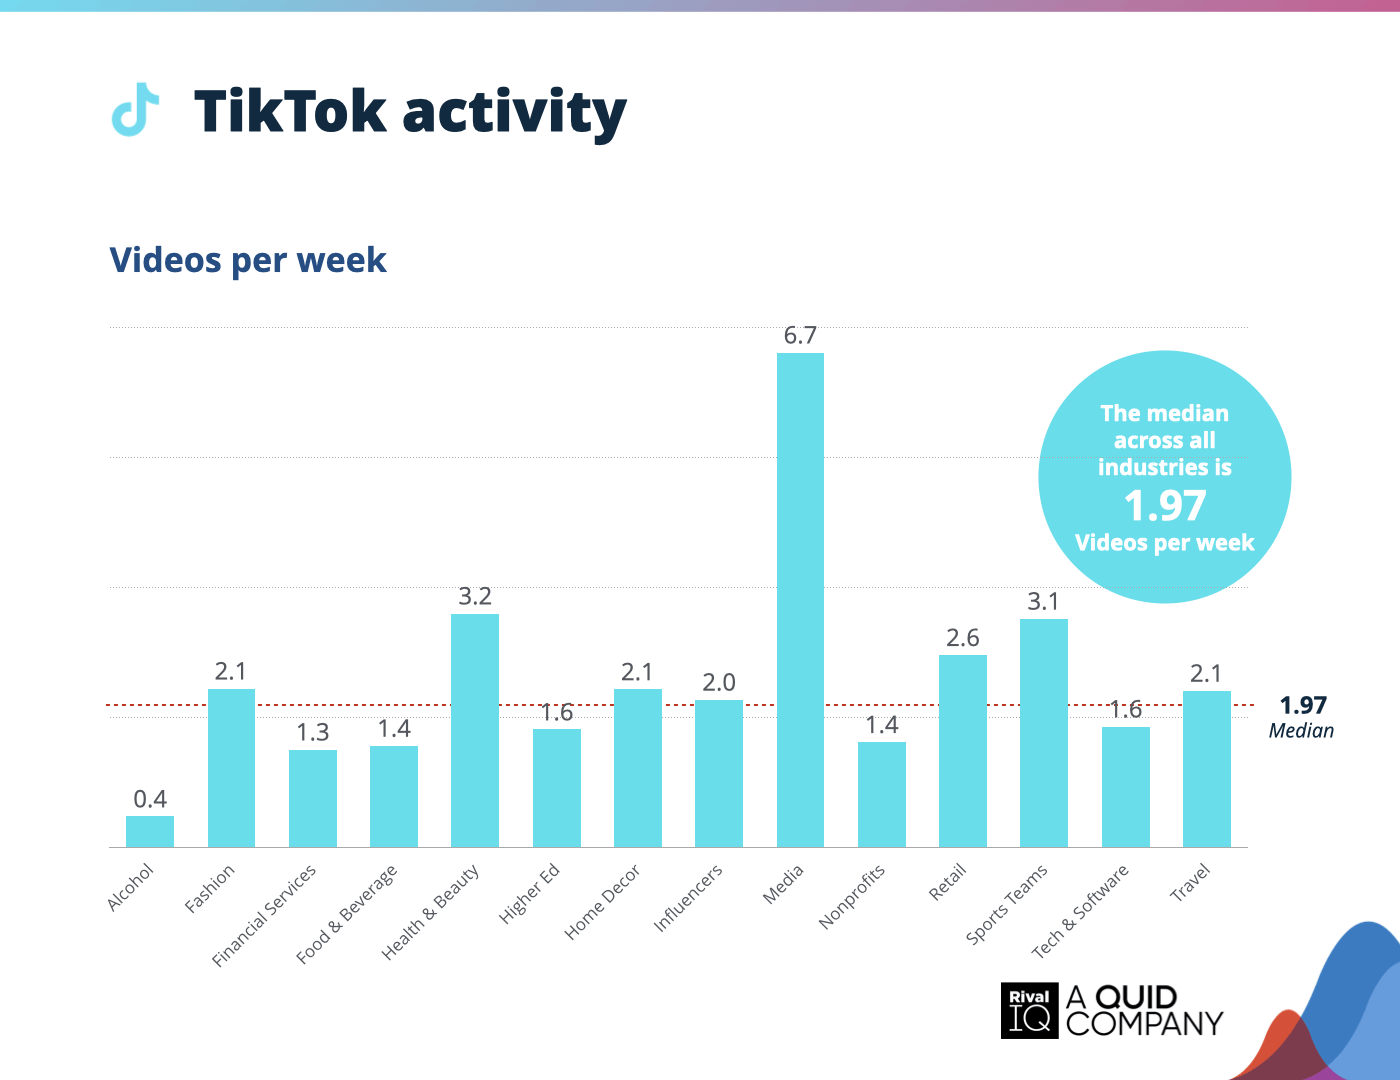
Median number of posts (monthly) on TikTok
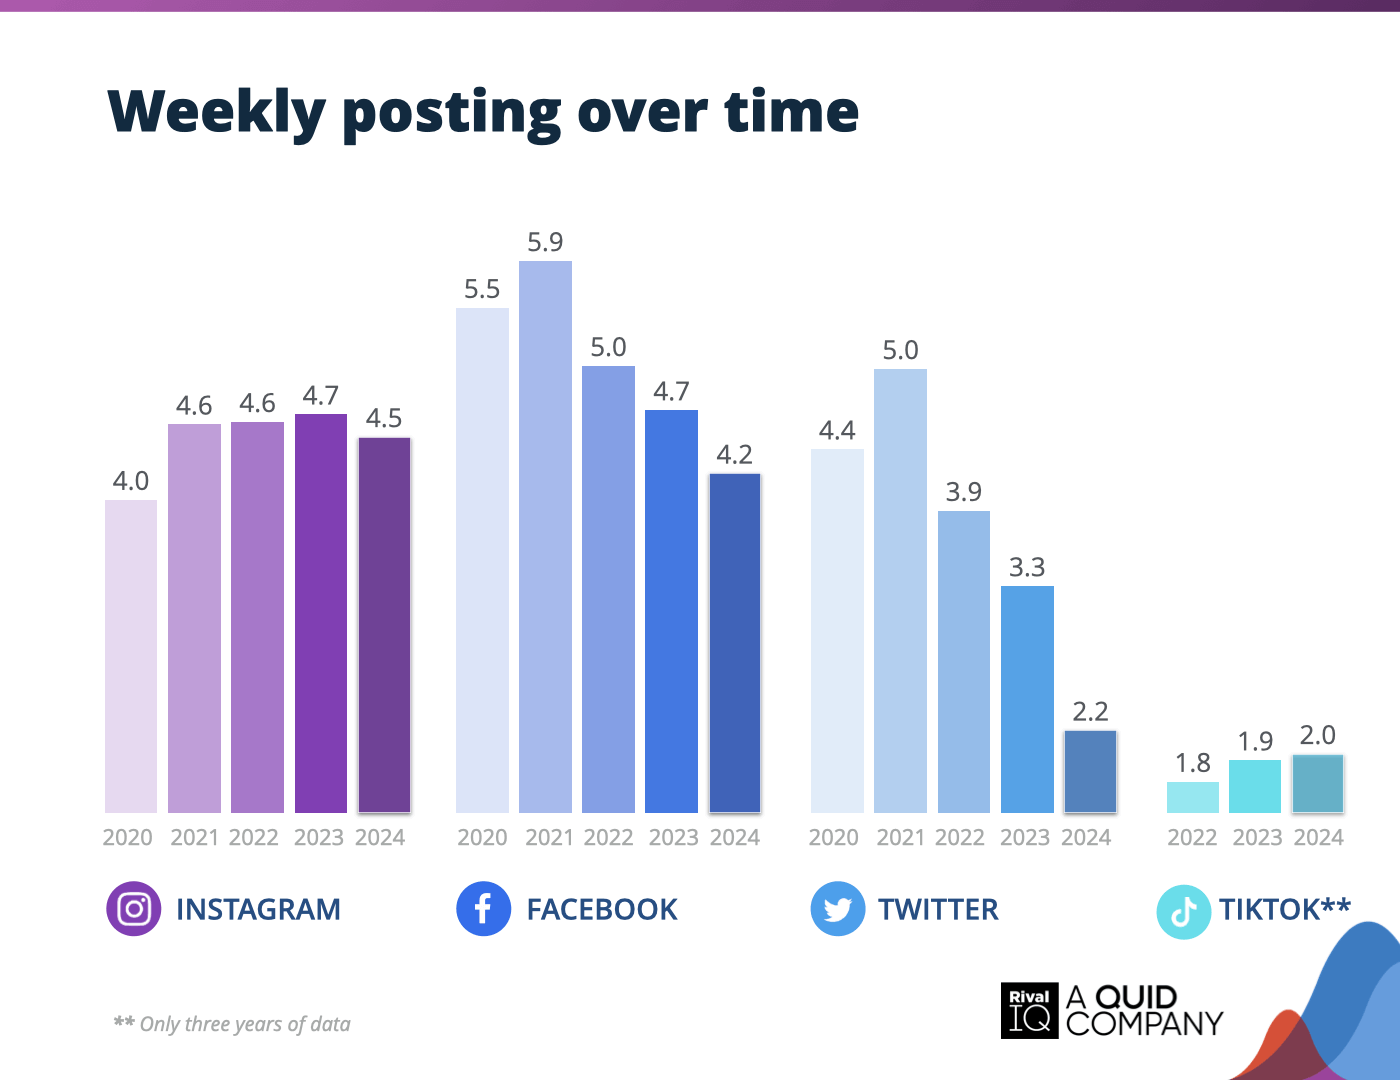
RivalIQ’s 2025 Social Media Industry Benchmark Report found that the median number of posts across all industries is 1.97 per week, or 8–9 per month. In the graph below, you can also see how your posting cadence stacks up against your industry norm.
Interestingly, our study revealed some interesting findings related to TikTok posting frequency. Median views per post stay roughly flat (~500 views) regardless of posting frequency — meaning posting more doesn’t necessarily mean more views, but we found that it does increase your chances of a viral post.
The median number of posts associated with the best efficiency gain is 8–20 posts per month (2–5 per week). This range yields the greatest improvement in performance without diminishing returns — offering the biggest lift in potential views and viral opportunities while maintaining stable median views.
Median engagement rate on TikTok
Our most recent engagement study found an average TikTok engagement rate of 4.86%, an increase from the 4% engagement rate the year prior.
Social media benchmarks for Twitter (now X)
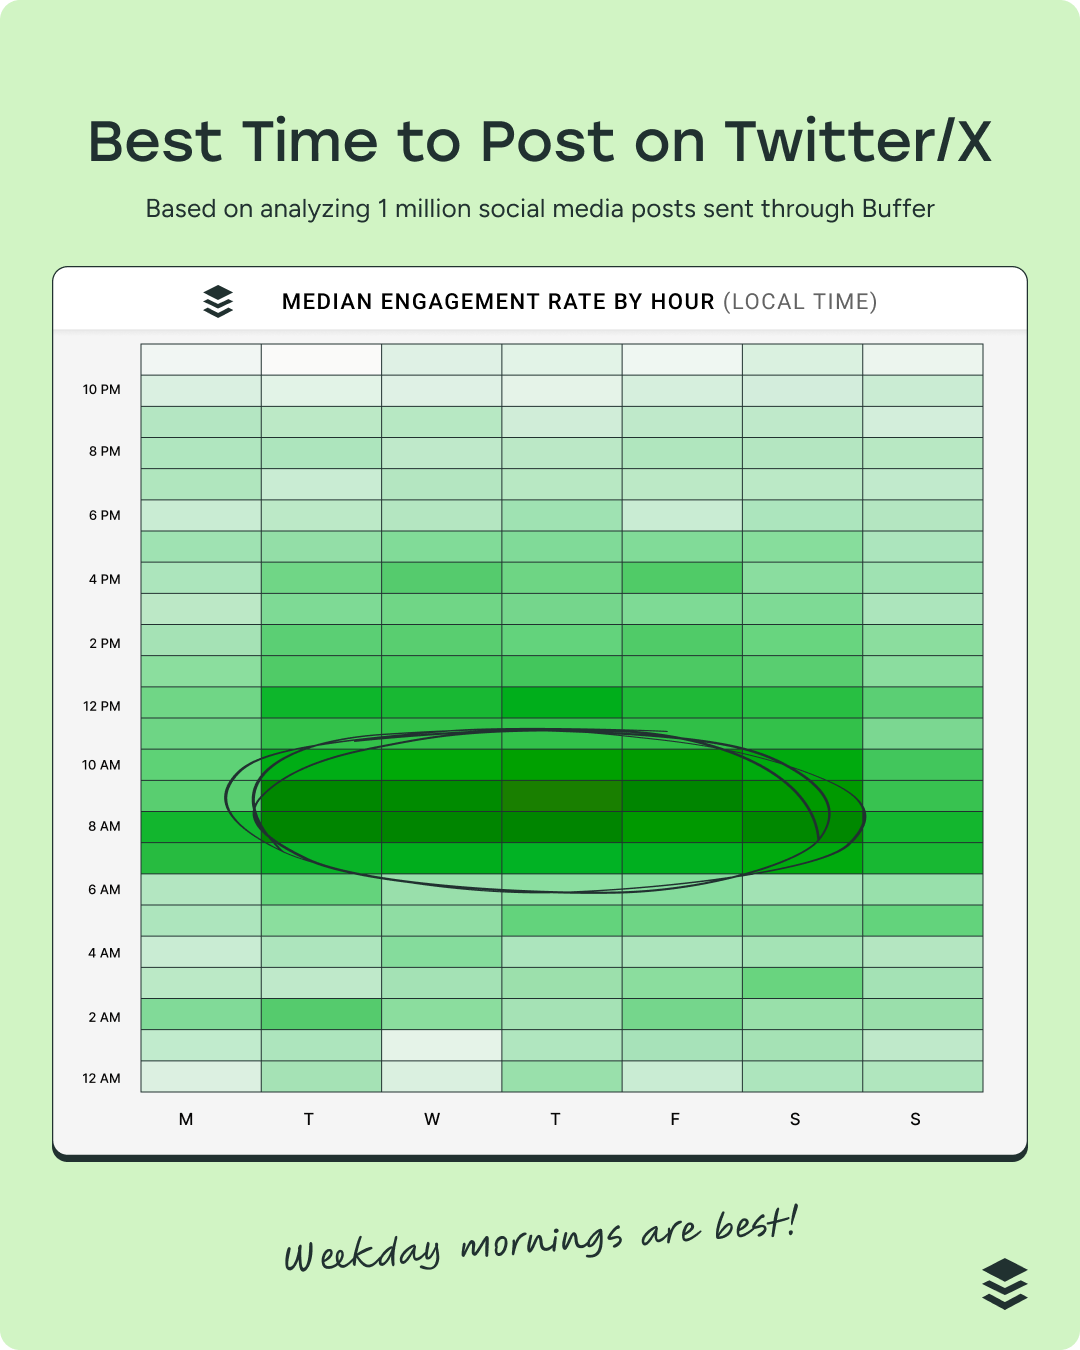
The best time to post on X
Our analysis of over 1 million tweets (can we still call them that?) found that the best time to post on X is 9 a.m. on Wednesday. In general, posting mid-morning every weekday tends to yield solid engagement, as you can see on the heatmap below.
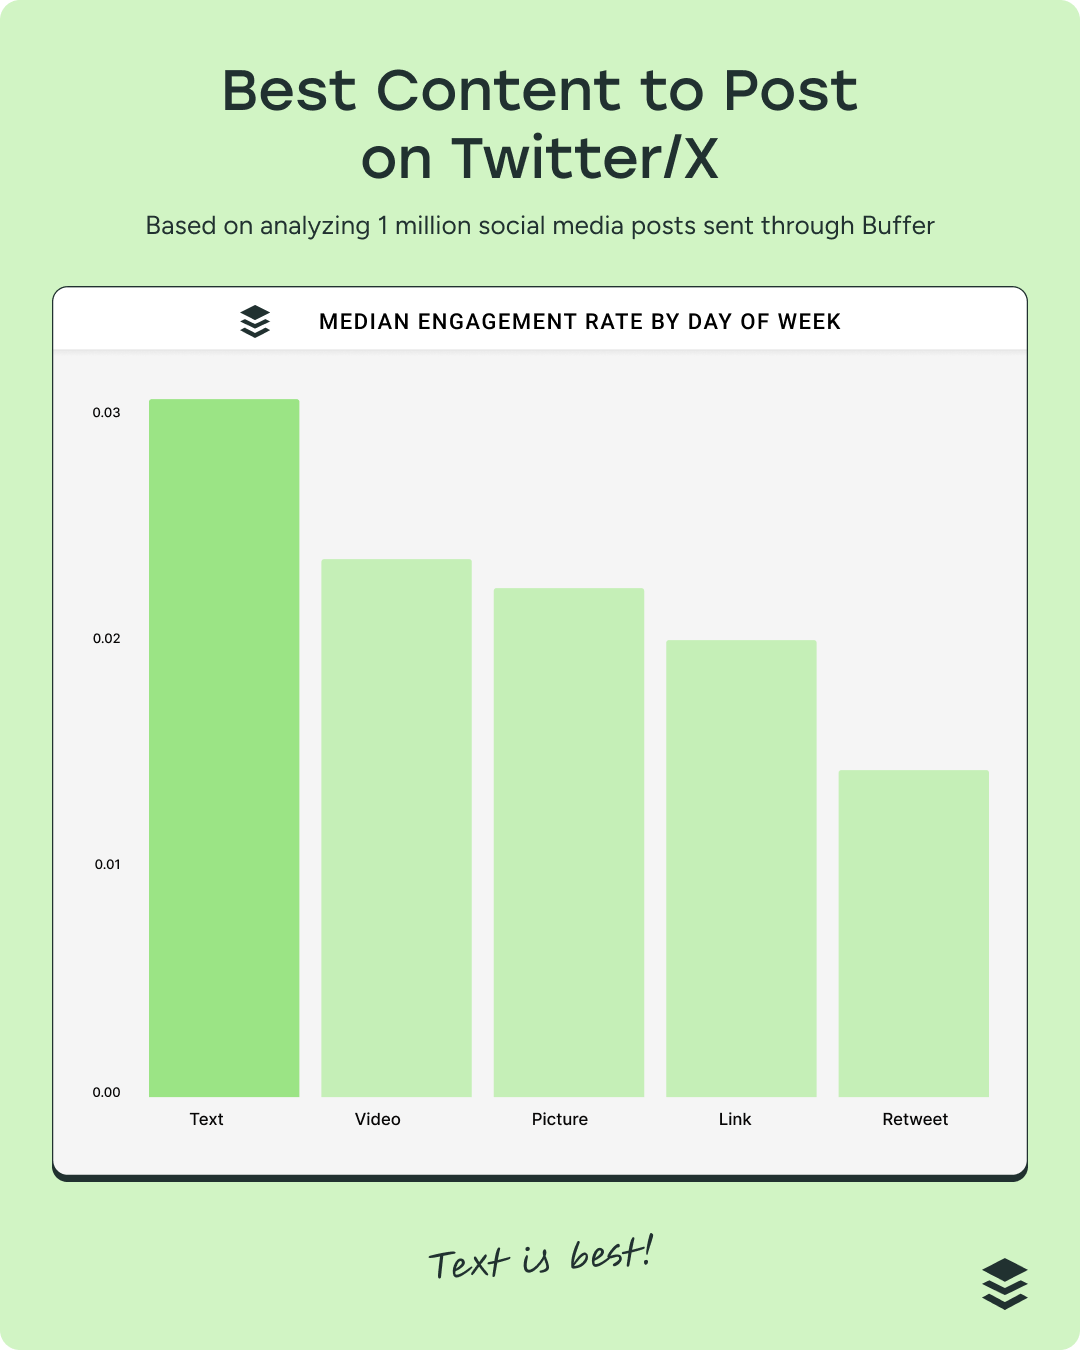
The best type of post on X
Text is still best on X. According to our 2025 data, text-only posts beat out videos, images, and links, and even images in median engagement.
Median number of posts (monthly) on X
According to RivalIQ’s 2025 Social Media Industry Benchmark Report, X users averaged 2.2 posts per week (around 9 posts a month). This is a massive decline from the average of five posts per week in 2021, suggesting people aren’t as invested in X as they once were. (Elon Musk acquired Twitter and started making some big changes in 2022.)
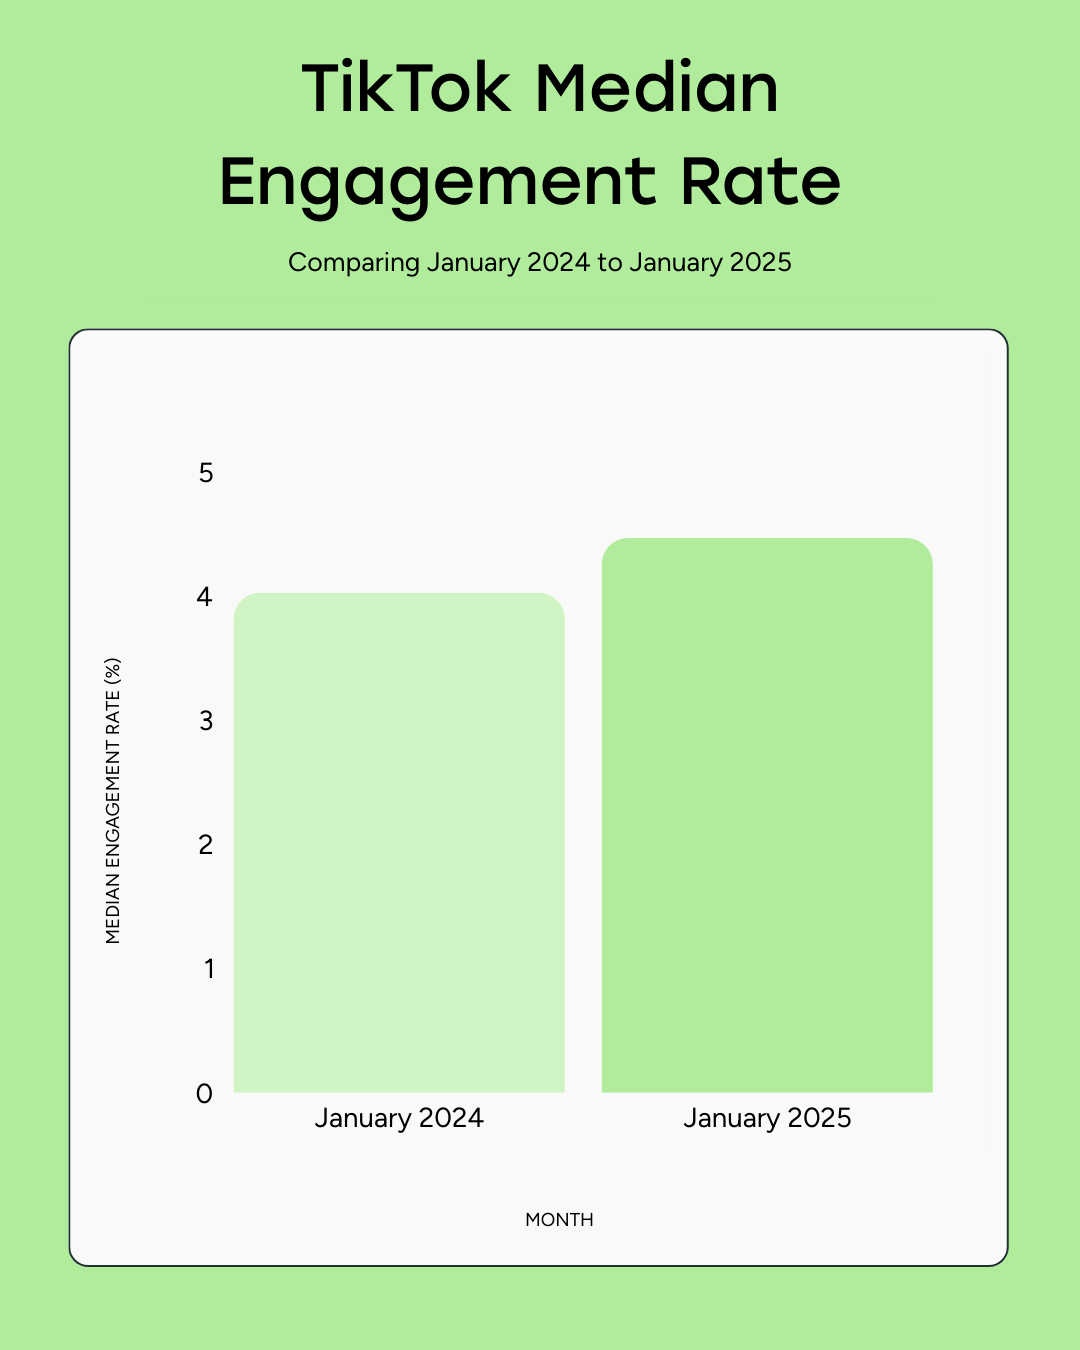
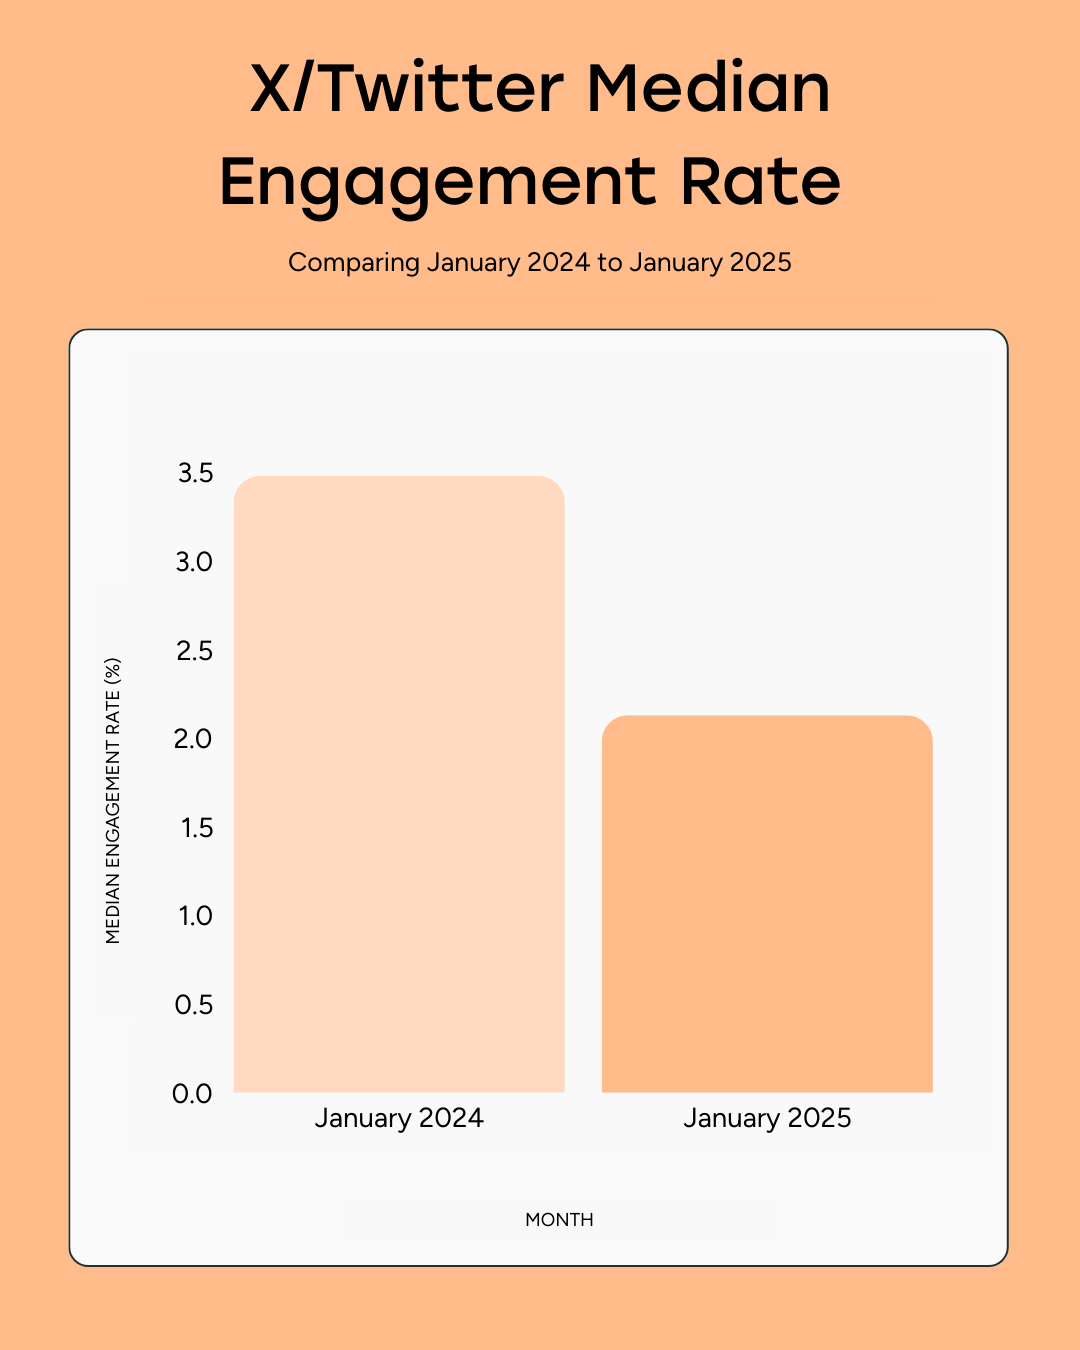
Median engagement rate on X
X dropped from 3.47% in January 2024 to 2.15% in January 2025, largely due to algorithm changes and platform instability.
Social media benchmarks for LinkedIn
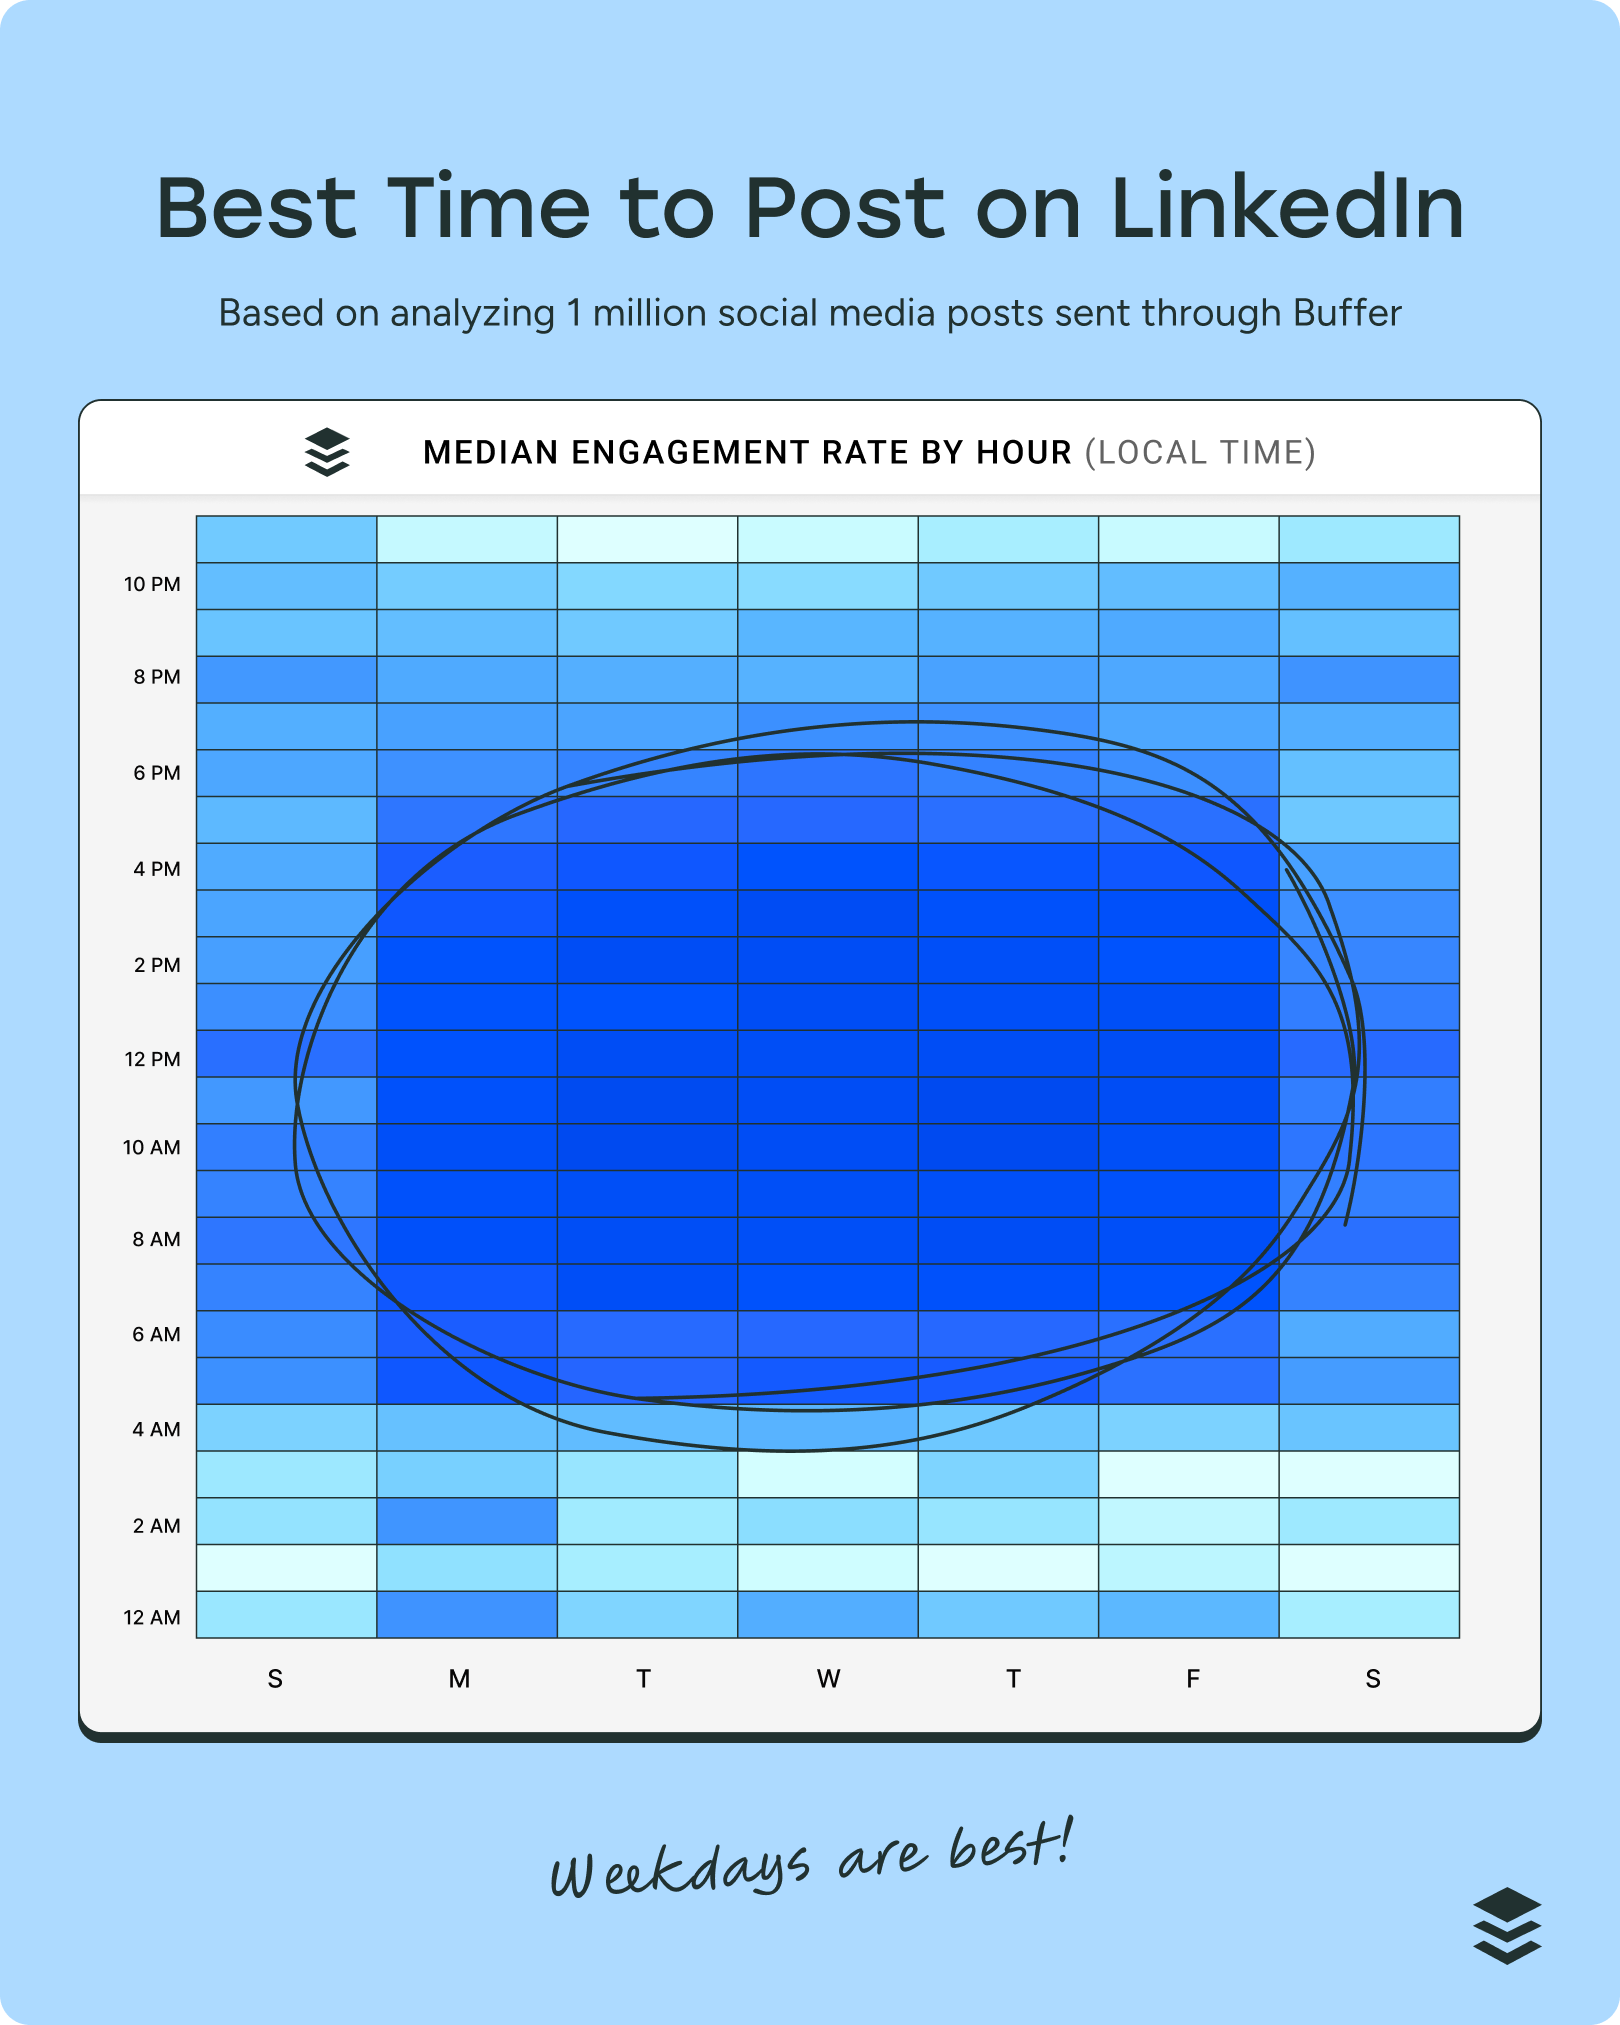
The best time to post on LinkedIn
It shouldn’t come as a surprise that the best time to post on LinkedIn is during working hours. Buffer’s analysis of 5.5 million posts found that posts that go live between 7 a.m. and 4 p.m. on weekdays perform best. Posts shared at 11 a.m. on Thursdays get marginally more engagement.
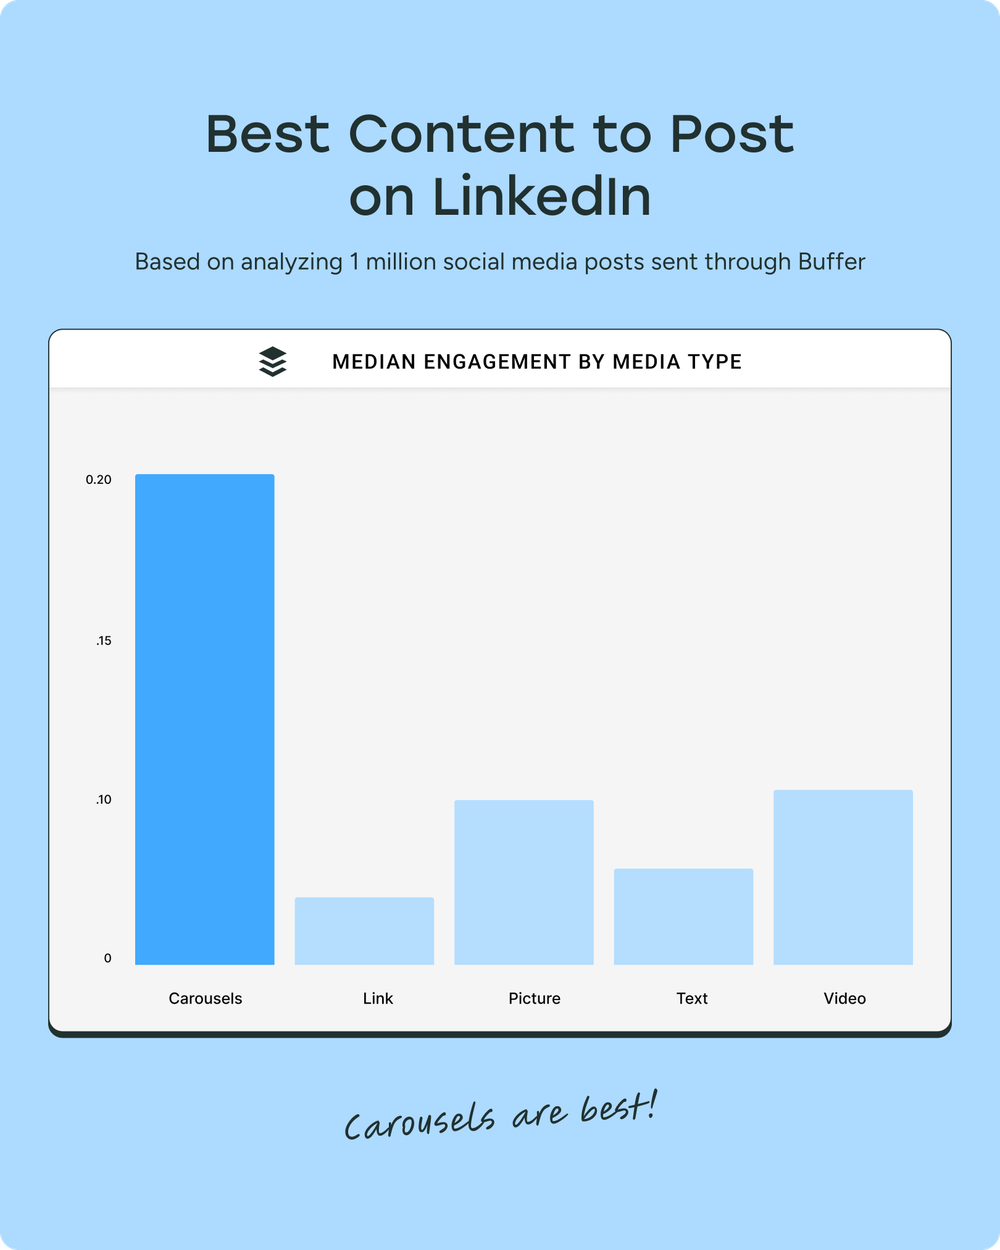
The best type of post on LinkedIn
LinkedIn has evolved into a creator-friendly platform complete with its own video feed, but while video still gets solid traction, it’s no longer the engagement powerhouse it was during the early 2024 surge.
As the algorithm settled and more creators embraced video, one format consistently rose to the top: PDF carousels deliver the highest median engagement on LinkedIn (by far).
Median number of posts (monthly) on LinkedIn
Although we don’t have recent median post frequency data, Buffer’s research of over 2 million posts from 94k+ LinkedIn accounts shows that posting two to five times weekly on LinkedIn is the sweet spot for improving reach and engagement without overwhelming your schedule.
Pro tip: LinkedIn’s posts have a longer shelf life than other social media platforms. This means your LinkedIn posts can appear in your audience’s feed for weeks after you’ve shared them, so it pays to create an intentional LinkedIn strategy. Quality > quantity, so find a frequency you can stick to.
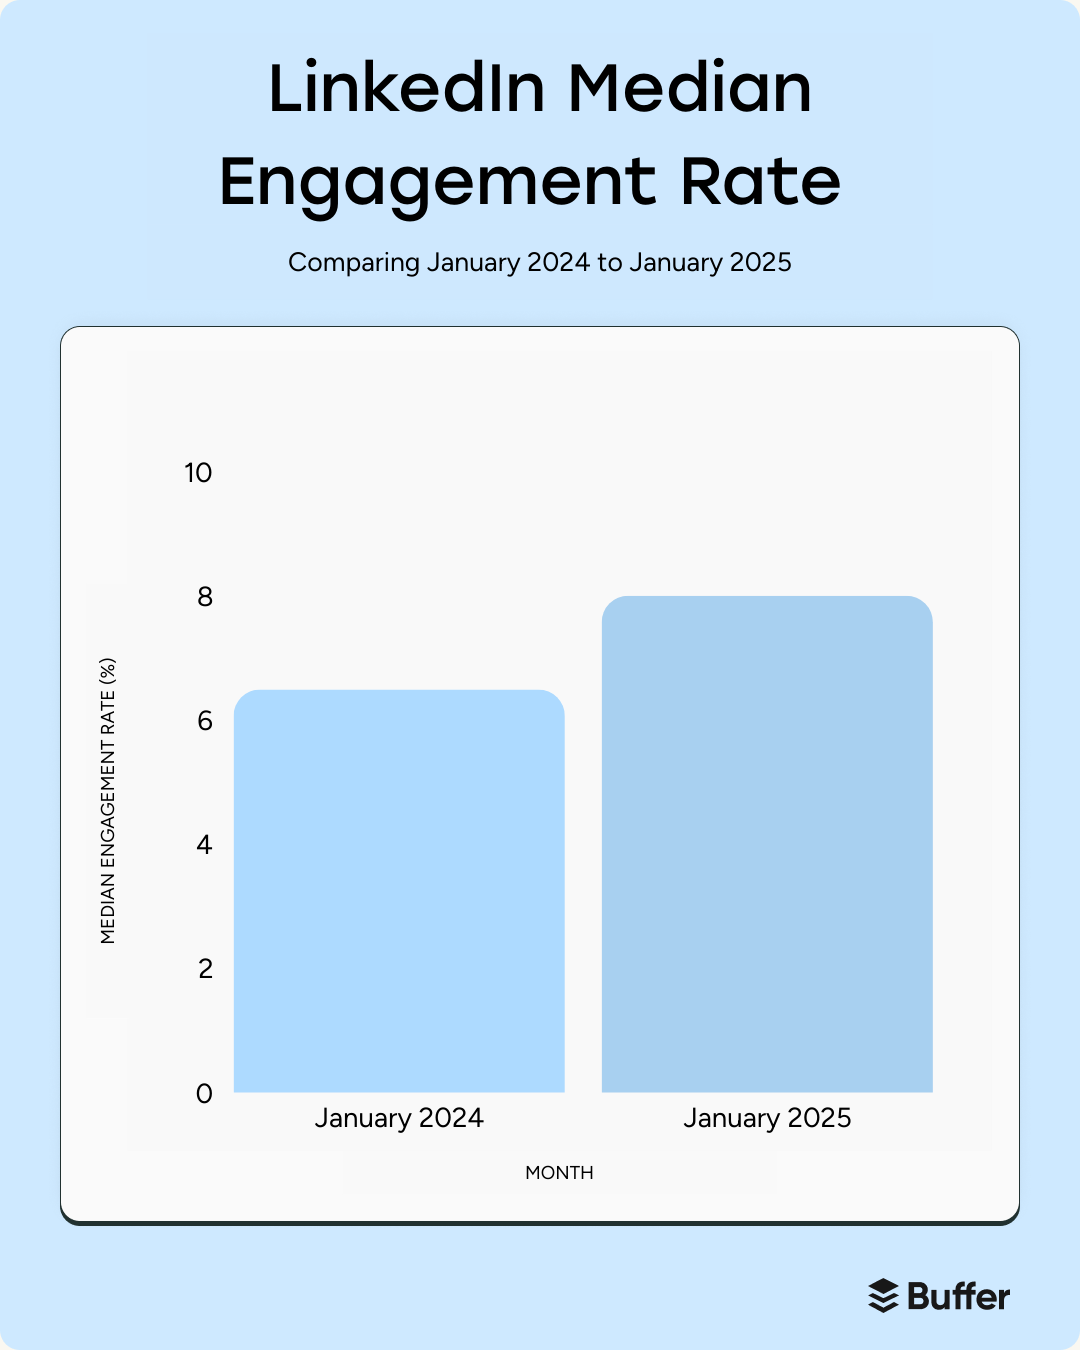
Median engagement rate on LinkedIn
Buffer’s analysis of millions of posts found a median LinkedIn engagement rate of 6.5%, outpacing all the other platforms we measured. This median uses data between January 2024 and January 2025. When we dug a little deeper, we saw how LinkedIn engagement jumped from 6% to 8.01% in that time period.
How to use social media benchmarks to your benefit
Now that you have some social media benchmarks data, how can you use the numbers I shared above to inform your marketing strategy?
Here are three ways:
1. Use social media benchmarks to set goals
Social media benchmarks help you understand where you’re winning, or maybe where you’re falling short. Use social media benchmarks to guide your KPIs and make them more realistic.
2. Use social media benchmarks for reporting the true picture
At first blush, a 3% engagement rate on Twitter (now X) might seem bleak to your stakeholders. Will that lead to a good growth rate? Should you practice more retweets or increase the number of posts? But presenting that number alongside benchmark data (the median is just over 2%) can help you see the whole picture. In this case, maybe you’re not doing so badly after all.
3. Use social media benchmarks as an aspirational vision board
If your social media metrics leave a little to be desired, let benchmark data serve as an inspiration and something to work towards by varying content type, positioning, frequency, or wherever you think improvements can be made.
⚠️ But here comes one of those caveats again
Even benchmark data points keep shifting under the whims of algorithms, competition, and other factors out of your control. And what one study calls ‘benchmarks’ depends on its own methodology and sample size — it can differ vastly from one research report to another. Take every benchmark with a grain of salt and use it in conjunction with your past performance metrics and audience feedback.
So, how did your socials stack up against these social media benchmarks?
If you’re feeling clearer about where you stand, that’s exactly what these social media benchmarks are for. Maybe you discovered you’re posting at the right times? Maybe you spotted a few gaps or opportunities you hadn’t considered before? Either way, you now have data you can actually use.
And remember, the only numbers that matter long-term are the ones that move your goals forward.
Benchmarks give you direction; your strategy gives you momentum. Pair the two, and your social presence will be stronger and smarter going into 2026.
More social media insights
- The Best Time to Post on Twitter/X: Based on Data from 1 Million Posts
- Replying to Comments Boosts Engagement by 5-42% on These Major Platforms
- 17 Threads Stats You Need to Know in 2026 (+ What They Mean for Your Strategy)
- The Best Time to Post on TikTok in 2026 — New Data
- What Is a Good Facebook Engagement Rate? Data From 52 Million+ Posts
- Do Posts with Links Affect Content Performance on X?
FAQ about social media benchmarks
What are social media benchmarks?
Social media benchmarks act like a compass for your strategy. They show how your posts, engagement, and posting frequency compare to similar accounts, helping you understand what “good” looks like without the guesswork.
Why should I care about social media benchmarks?
Benchmarks help you set realistic goals, report meaningful results to your team or stakeholders, and identify areas where you can improve your social media performance — without stressing over every like or share.
Which social media metrics matter most?
Some of the key metrics to watch are engagement rate, post type, posting frequency, and posting times. These give insight into how your audience interacts with your content, which formats work best, how often to post, and when your content gets the most visibility.
What type of posts perform best on each platform?
Different platforms favor different content. Pictures perform best on Facebook, Instagram Reels get the highest reach, TikTok rewards videos, text posts win on X (Twitter), and LinkedIn sees the most engagement with carousels or PDFs.
When is the best time to post on social media?
The optimal posting times differ across platforms. On Facebook, 5 a.m. on Mondays performs well. Instagram sees the most engagement around 3 p.m. on Fridays. TikTok posts do best at 8 p.m. on Sundays. X (Twitter) favors 9 a.m. on Wednesdays, and LinkedIn engagement peaks at 11 a.m. on Thursdays. But the best time to post is when your audience is online, which you can find out in your Buffer Insights.
What is a good engagement rate for social media?
Median engagement rates vary by platform. Facebook averages 3.6%, Instagram 4.3%, TikTok 4.86%, X (Twitter) 2.15%, and LinkedIn 6.5%. These numbers provide a helpful reference point for evaluating your own performance, but must be considered in the context of your audience size and your industry.
How should I use social media benchmarks?
Benchmarks can guide your strategy in three main ways. They help you set realistic goals, give context when reporting performance to stakeholders, and inspire improvements in content type, posting frequency, and timing.
Are benchmarks the same for every business?
Benchmarks are guides, not rules. Your niche, audience, and goals can change what “good” looks like for your brand. Use benchmark data to inform your strategy, but always consider your own performance history and audience behavior.
Try Buffer for free
200,000+ creators, small businesses, and marketers use Buffer to grow their audiences every month.


