
Every post on X (formerly Twitter) tells a story through numbers — who saw it, who replied, who shared it, and who followed you after.
These numbers aren’t random. They show patterns in what people pay attention to and how your presence grows over time. For creators, marketers, and small business owners, that insight can shape what you share next and how you show up on the platform.
To accurately measure if your Twitter strategy is on track, you need to get comfortable with Twitter analytics. In this post, I’ll show you how to find — and read — the data so you get a clear picture of what’s working and what’s worth rethinking.
Craft the re-tweet-worthy tweets, learn what works and schedule your posts at the right time (in half the time) with Buffer's Twitter scheduling and analytics tools.
Jump to a section:
- What is Twitter analytics?
- How to find your X/Twitter analytics
-
How to use X/Twitter analytics in your social media strategy
- 1. Understand what’s getting your content seen
- 2. Identify which posts drive the most engagement
- 3. Evaluate engagement over time against your goals
- 4. Benchmark performance with tweet averages
- 5. Pinpoint the best times to post
- 6. Spot what’s driving follower growth
- 7. Use audience insights to check if you're reaching the right people
- If X has analytics, where does Buffer fit in?
- Which Twitter analytics tool is right for you?
- FAQ about Twitter analytics
- More Twitter/X resources
What is Twitter analytics?
X or Twitter analytics is a data dashboard that tracks the performance of your account. It can reveal insights that help guide your social media strategy, from identifying your most loyal followers to posting tweets at the right time of day.
How to find your X/Twitter analytics
X offers different analytics depending on your plan.
Free accounts get basic metrics — like impressions and engagements — for each individual post.
Premium accounts get an analytics dashboard that’s seriously impressive, with detailed data on your overall account performance, individual post performance, and audience insights.
If you use a social media management tool like Buffer, you’ll also find built-in Twitter analytics directly within Buffer, available on both free and paid plans.
How to find analytics in X
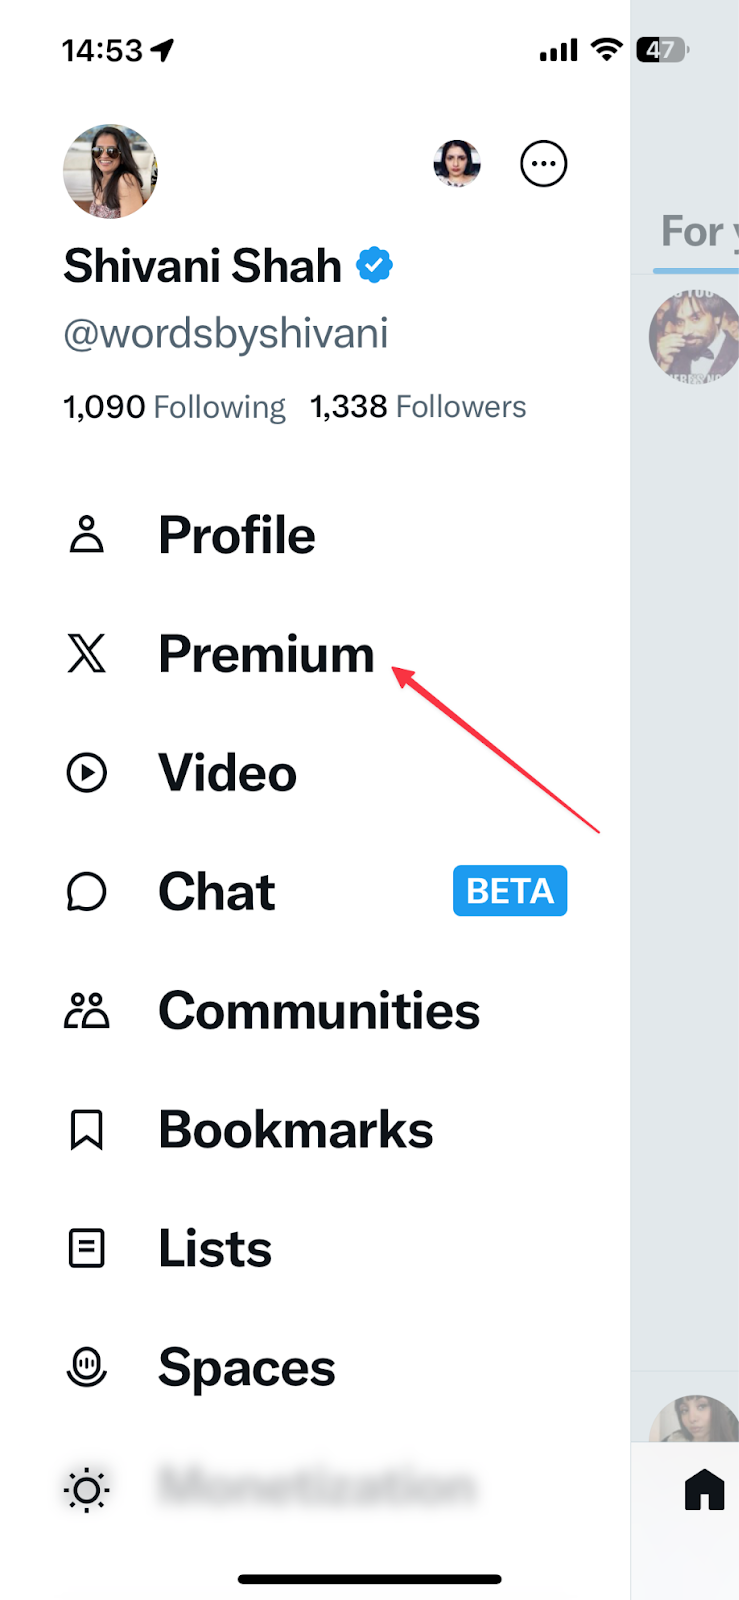
For X premium accounts on the mobile app, click on Premium in the menu, and then click on Analytics. You’ll land on a full analytics dashboard showing you key metrics at the account level.

On the web, you can go directly to https://x.com/i/account_analytics
From there, you can switch between tabs for various metrics on your:
- Audience
- Content (individual posts)
- Uploaded video posts
- Live video streams
- Spaces audio conversations
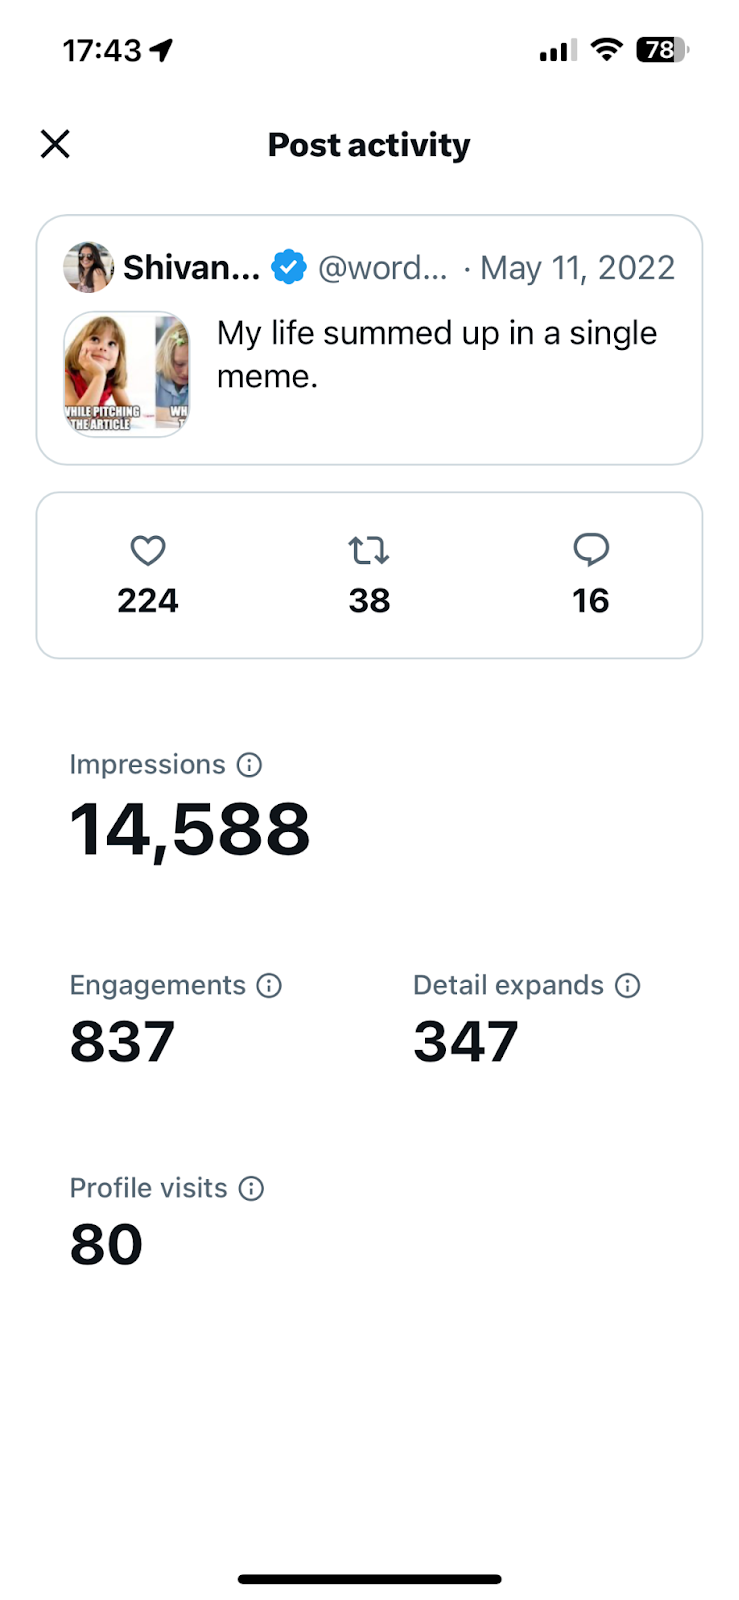
If you’re using a free X account, you can check Twitter analytics directly from any post on the web or in the mobile apps.
Tap the bar chart icon below your tweet to see impressions, engagements, profile visits, link clicks, detail expands, and interactions like replies and reposts.

How to find X analytics on Buffer
To view your X analytics dashboard in Buffer, click Analyze in the main navigation menu, then choose Twitter/X from your connected accounts.
On Buffer's free plan, you’ll find post data under the Publish tab. Just select your Twitter account and look at any published post to see its performance data.
How to use X/Twitter analytics in your social media strategy
Now that you know where to find your Twitter analytics, let’s explore what the numbers actually mean for your strategy. Below are seven ways to use the data, along with where to find each metric in both X and Buffer.
1. Understand what’s getting your content seen
Impressions measure how many times your posts landed in someone’s feed or popped up in search results. If you’re trying to build awareness or get your name out there, this is the metric to watch.
A jump in impressions usually has a reason behind it. This could be one of many things:
- Timing: You posted at a moment when your audience was actually scrolling.
- Format: A post in one format —say a video — caught attention in ways a text or image post didn’t.
- Topic: You posted about something people were already searching for, was timely, or your audience normally responds to.
- High engagement: One of your earlier posts gained traction through reposts, shares, or comments and drew more eyes to your account.
Look for patterns across post impressions to see which ones perform better. Do video posts consistently get thousands of impressions while text posts get only a couple of hundred? Do Tuesday morning posts outperform Friday afternoon? This analysis shows you what’s worth repeating.
Also look at impressions over time. Checking impressions on individual posts shows you which ones landed. Looking at how your posts perform over weeks or months shows whether your overall Twitter strategy is helping more people discover you.
Where to find impressions in X
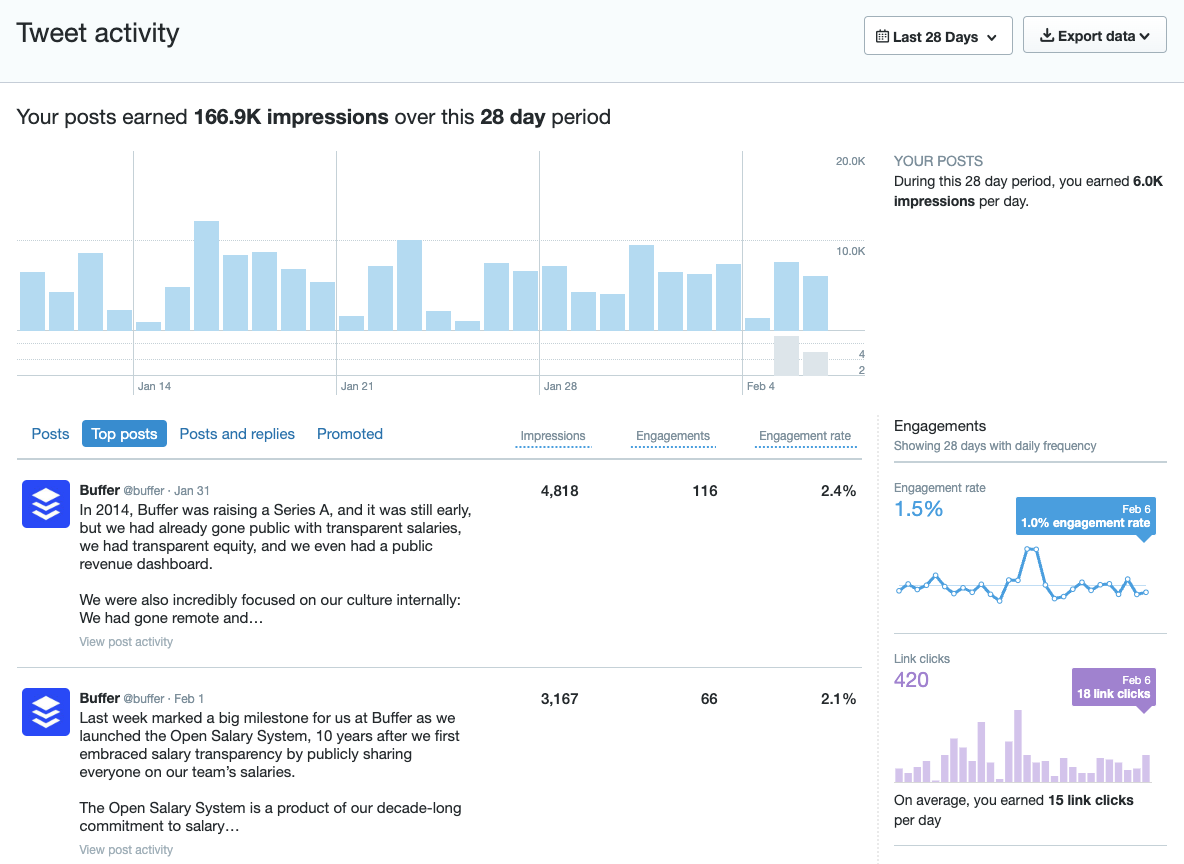
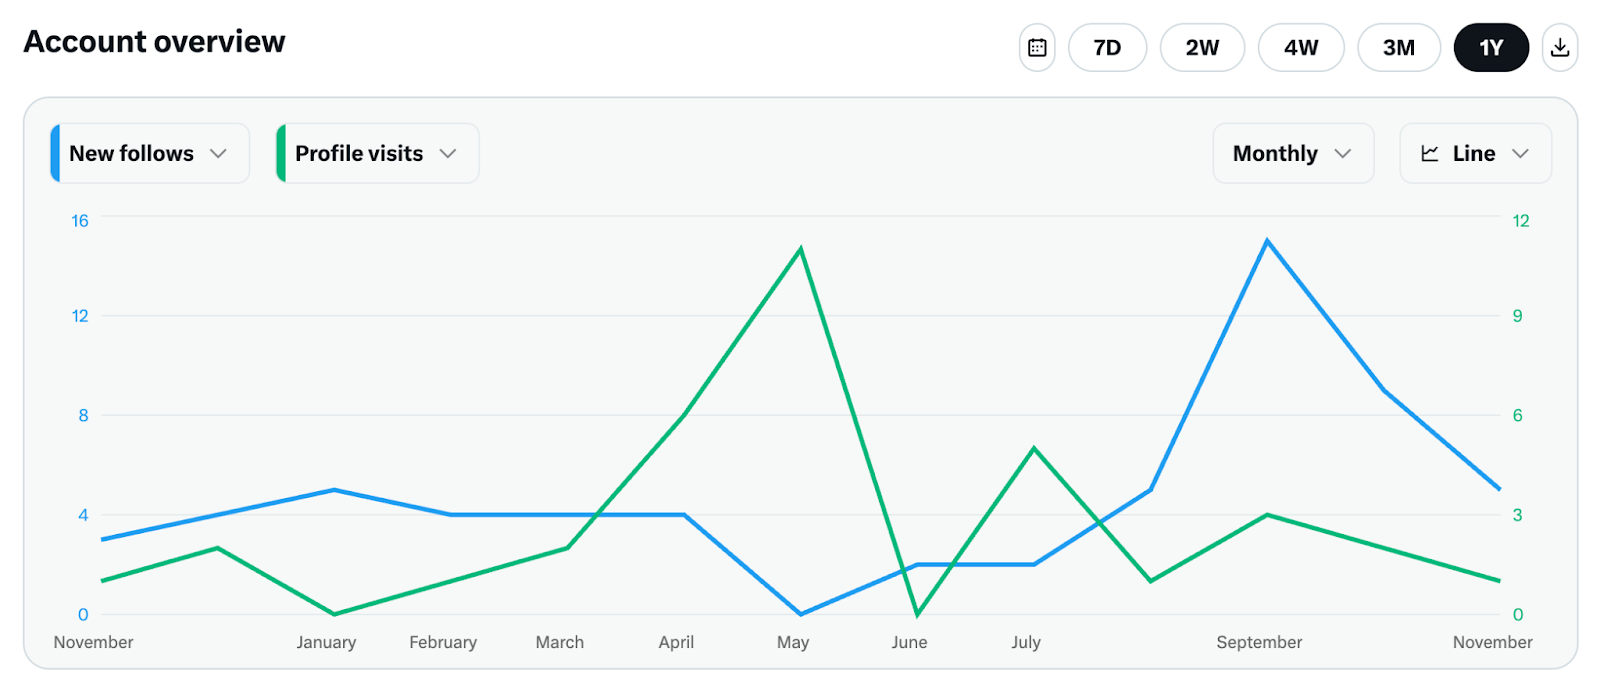
On the Account Overview dashboard in X analytics, you’ll see total impressions for the selected period and a chart showing impressions over time. You can even layer this data with other metrics on the native analytics dashboard to learn more.
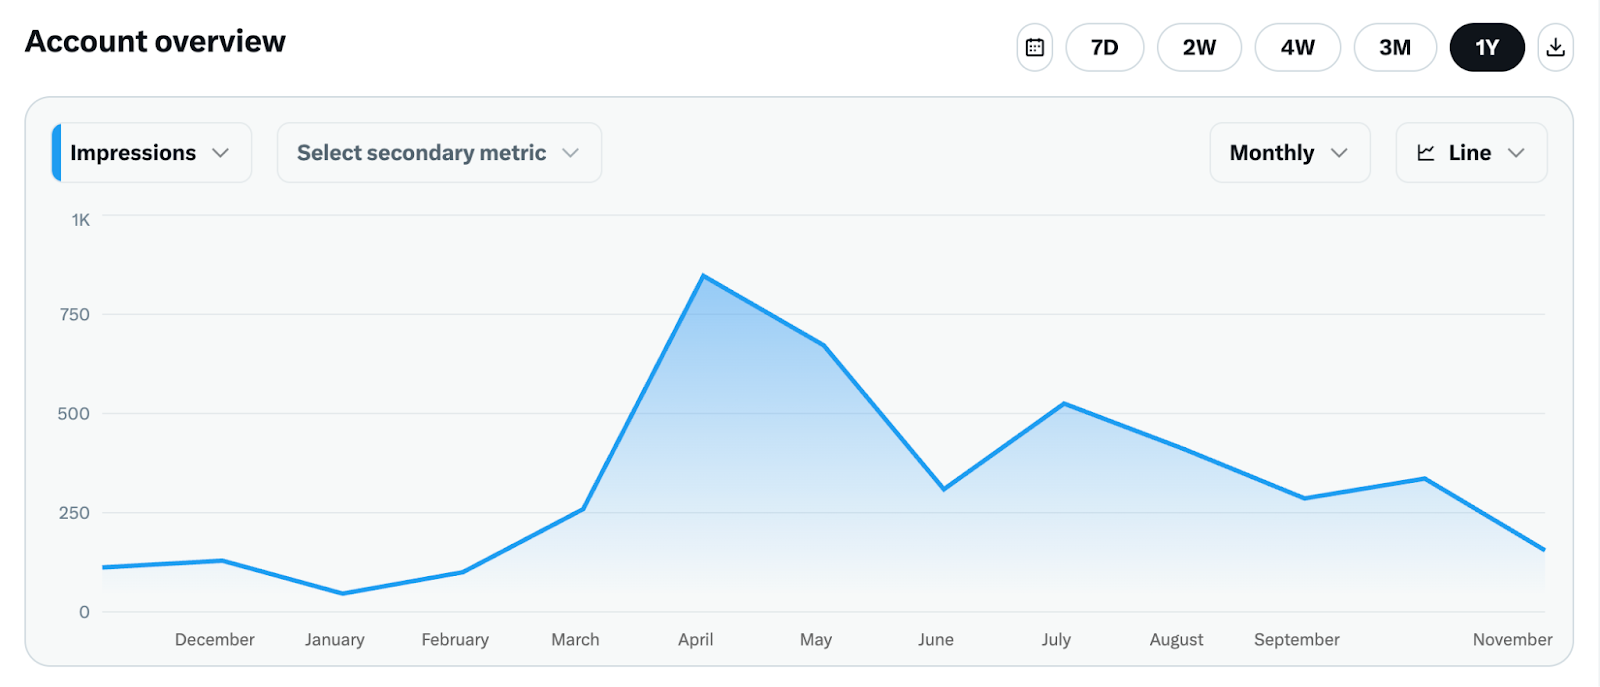
Compare tweet impressions to engagement rate to see if your posts are not only reaching people but also engaging them. Or, you can compare them to new followers to see if visibility is turning into follower growth.
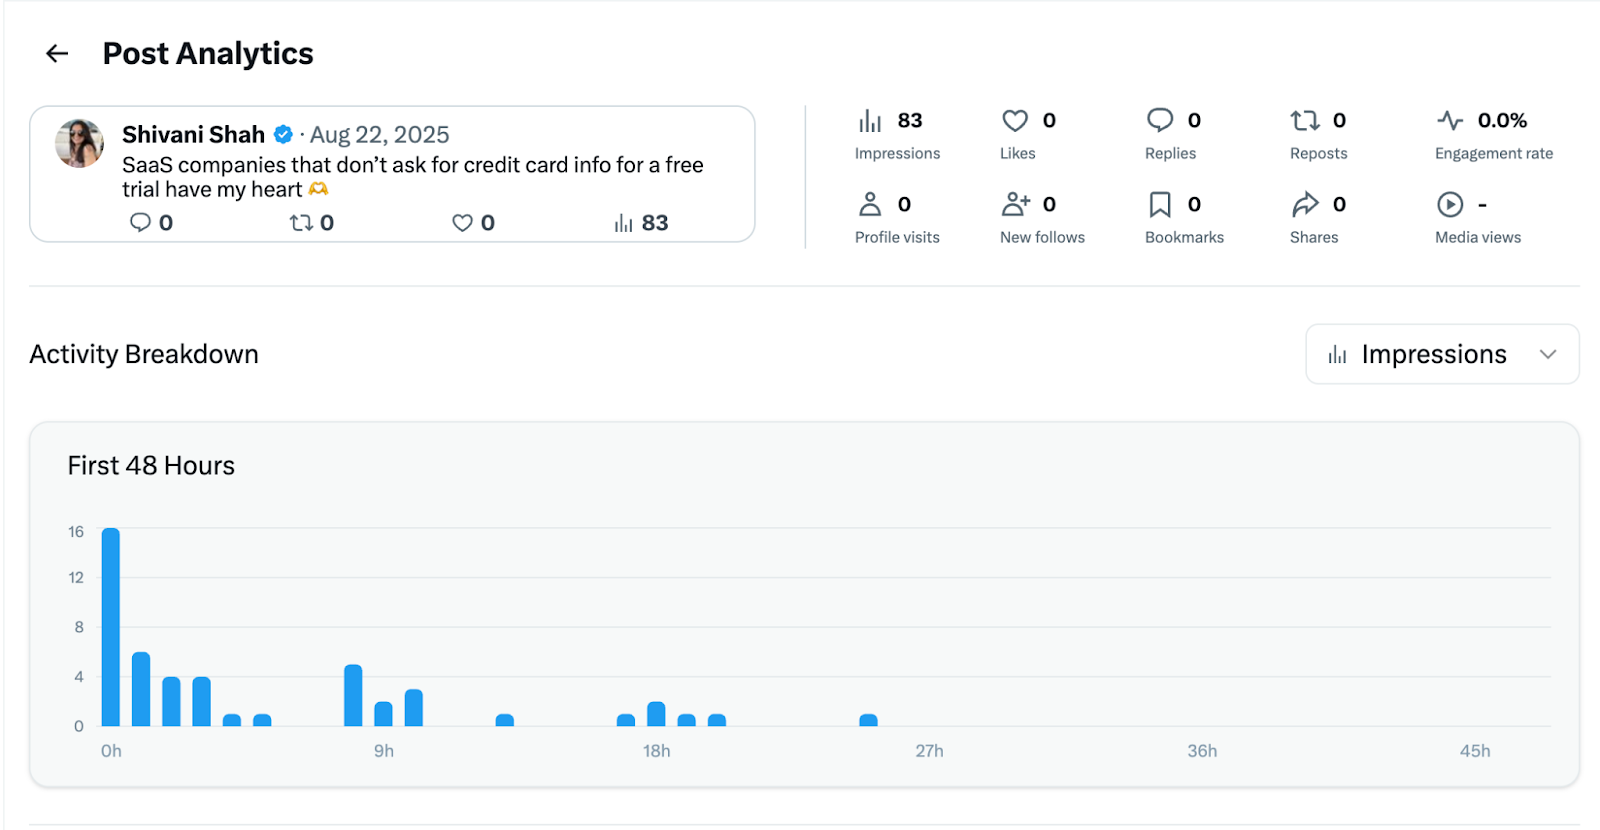
For individual tweets, click on the Content tab to see the numbers. You can also click on any post in the content dashboard to see more detailed impressions data for the first 48 hours after posting.
Where to find impressions in Buffer
In Buffer analytics, the X/Twitter dashboard shows average impressions per tweet and impressions for the selected period. Click on the Posts tab to see impression counts for individual tweets, or download the CSV file for that post-level data.
2. Identify which posts drive the most engagement
Engagement rate tells you what percentage of people who saw your tweet actually interacted with it. A high engagement rate means your content struck a chord. Instead of scrolling past your posts, people stopped to like, reply, share, or click.
Comparing engagement rates across different post types reveals what formats work best for your audience. If images consistently pull higher engagement than other types, that’s a clear signal to lean into visual-first posts.
Breaking engagement down further shows you how people interact with your content. Here are the different types of tweet engagement:
- Reposts are a sign of value. Someone found your tweet valuable enough to share with their audience.
- Likes are a sign of appreciation. Your tweet resonated with someone else, and they wanted to give a virtual high-five.
- Link clicks are a sign of relevance. Someone found your content relevant enough to head over to your website and check out what you had shared.
- Detail expands are a sign of curiosity. A Twitter user clicked on your tweet to see your thread or other comments because they want to know if there’s more to your story.
- Profile clicks are a sign of interest. People want to look into your account because they want to know who you are.
- Media engagements are a sign of approval. Viewers want to see more of your content, so they clicked your photo or watched your video.
Once you spot which engagement types happen most often — and on which posts — you know what formats, tones, or topics to repeat.
Where to find engagement rate in X
The Content tab on the Twitter analytics dashboard shows a table of your posts with impressions, likes, replies, and reposts. If you click on a post, you’ll see the total engagement rate as well as engagement metrics for the first 48 hours after posting.
Download the CSV file from the Content tab for detailed data on more types of post engagement like bookmarks, shares, profile visits, detail expands, link clicks, and hashtag clicks.
Where to find engagement rate in Buffer
The X/Twitter Posts dashboard in Buffer analytics displays engagement rate and individual engagement metrics like retweets, likes, and link clicks for each post.
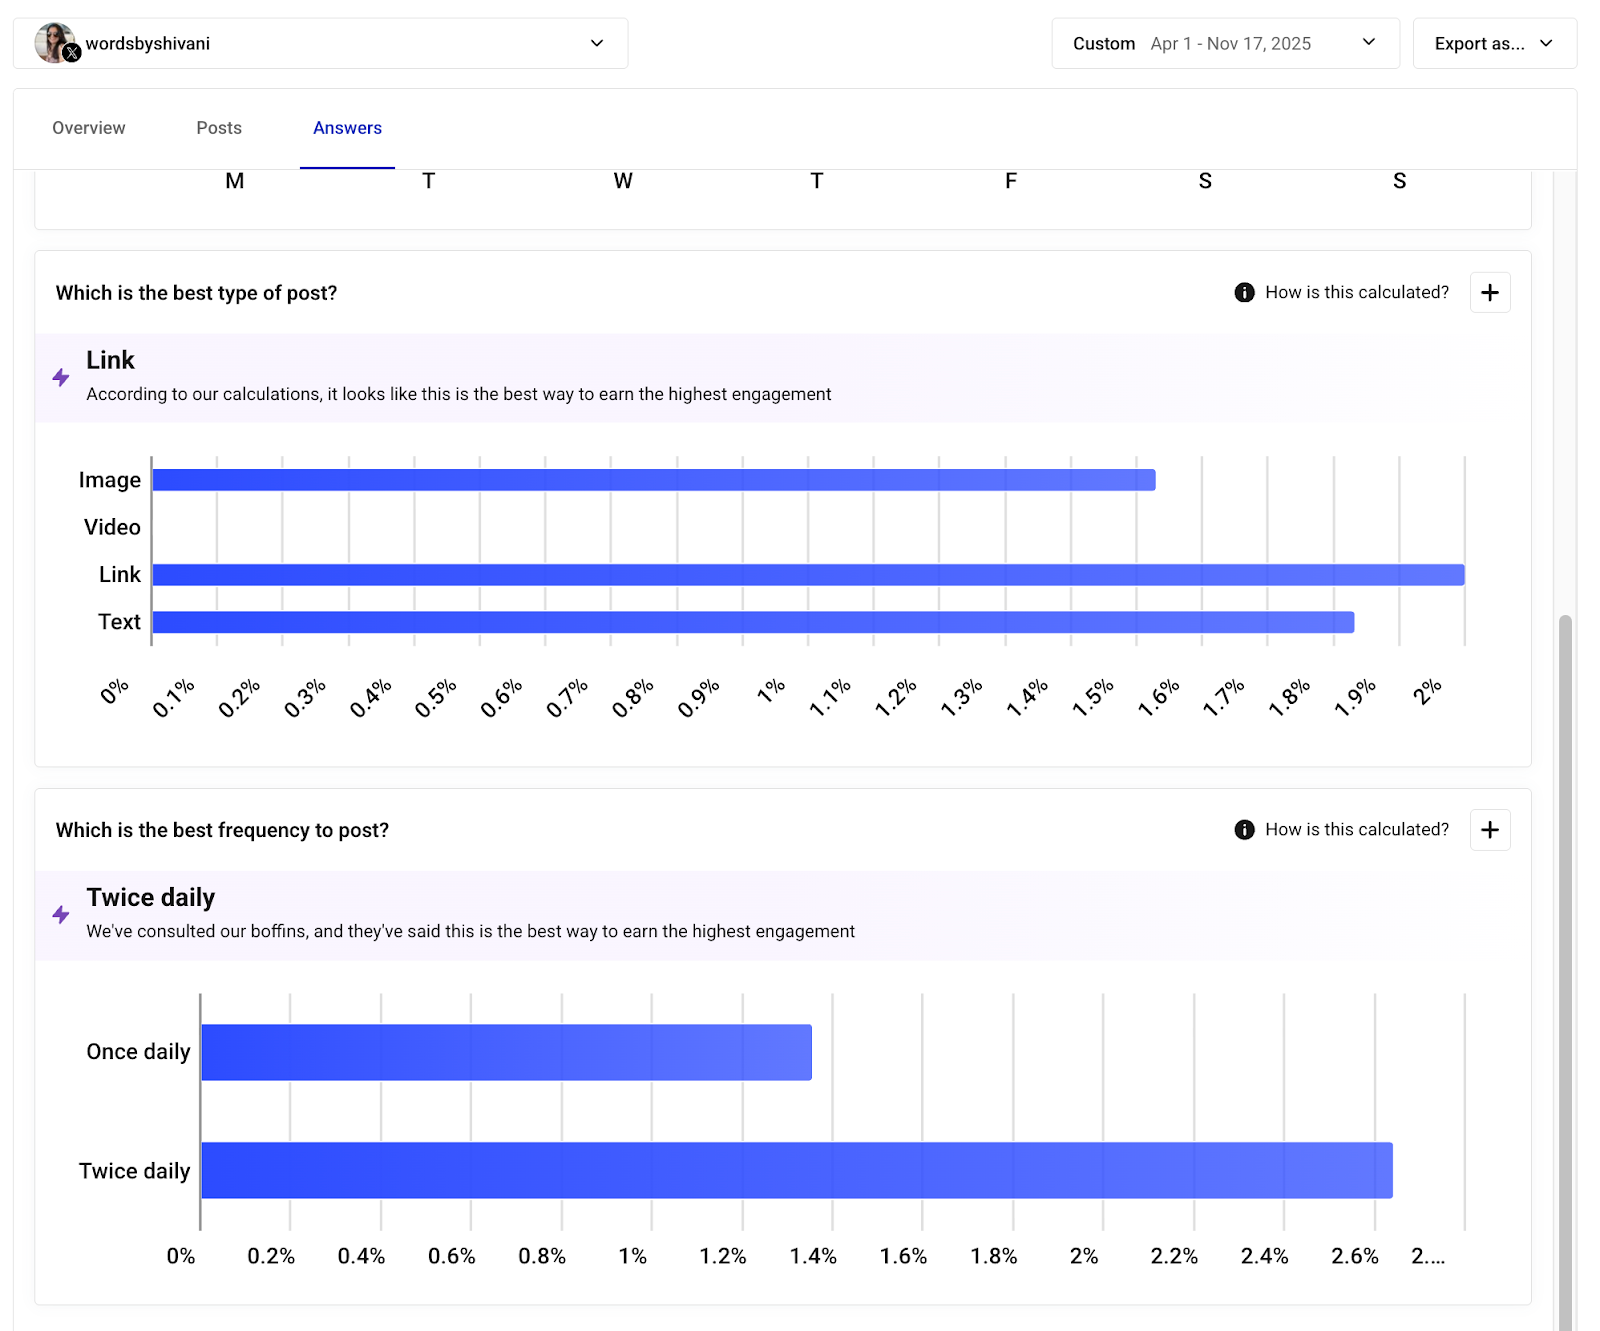
You can download the CSV file to get raw data to analyze. Even better — let Buffer do the heavy lifting for you. Head to the Answers tab for valuable insights on:
- Which post type your audience engages with most
- What post performance looks like across different formats
3. Evaluate engagement over time against your goals
Engagement rate is even more useful when you track how it changes over time and whether those changes line up with your goals.
Are you working on building community interaction? Check if your replies are rising along with your engagement rate over a few weeks. More replies suggest people are talking back more often — exactly what you want! Fewer replies means you may need to try different types of posts to encourage conversation.
Where to find engagement over time in X
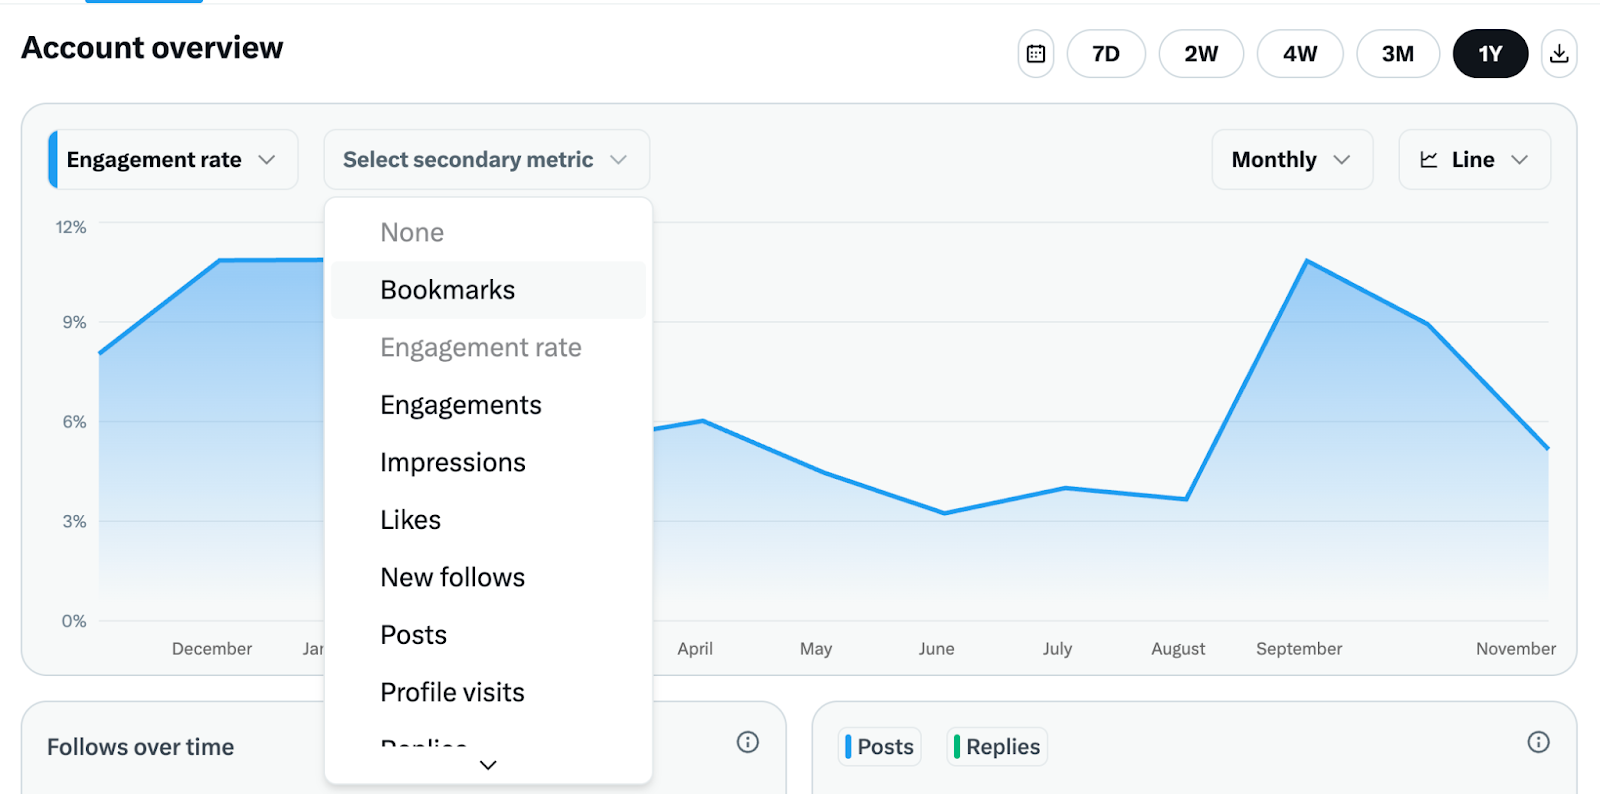
The account overview dashboard shows your engagement rate over time. Add in specific metrics like replies or reposts to see which actions are actually moving the needle.
Where to find engagement over time in Buffer
Check the Twitter overview dashboard in Buffer analytics for a chart tracking engagement rate over time. You can download the CSV file to get engagement rate for the selected period, along with a breakdown of the types of engagement behind it.
4. Benchmark performance with tweet averages
Goals give your Twitter activity direction. Without them, it’s hard to know whether your posts are getting the results you’re aiming for or whether you’re simply publishing because you feel you should.
Benchmarking your performance against those goals is a great way to make sure you’re investing in the right platform and your content is connecting with the people you want to reach.
The challenge with Twitter, though, is that numbers jump around daily. This makes it difficult to compare your performance for a period (e.g., a month) with the period before.
Averages solve that problem.
Instead of comparing individual days or posts, compare your average tweet performance for this month with the previous month to see if your Twitter performance has improved.
You can also compare your averages to broader benchmarks. Here are the current social media benchmarks for Twitter:
- Median number of posts: 9 posts per week
- Median engagement rate: 2.15%
If your averages are below these benchmarks, you know where to focus. If they’re higher, you’re outperforming the typical Twitter account.
Buffer’s research also found that video posts tend to perform best, and 11 a.m. on Mondays and Fridays is when engagement peaks. (We’ll dig into post timings tailored for your audience next.)
Where to find tweet averages in Buffer
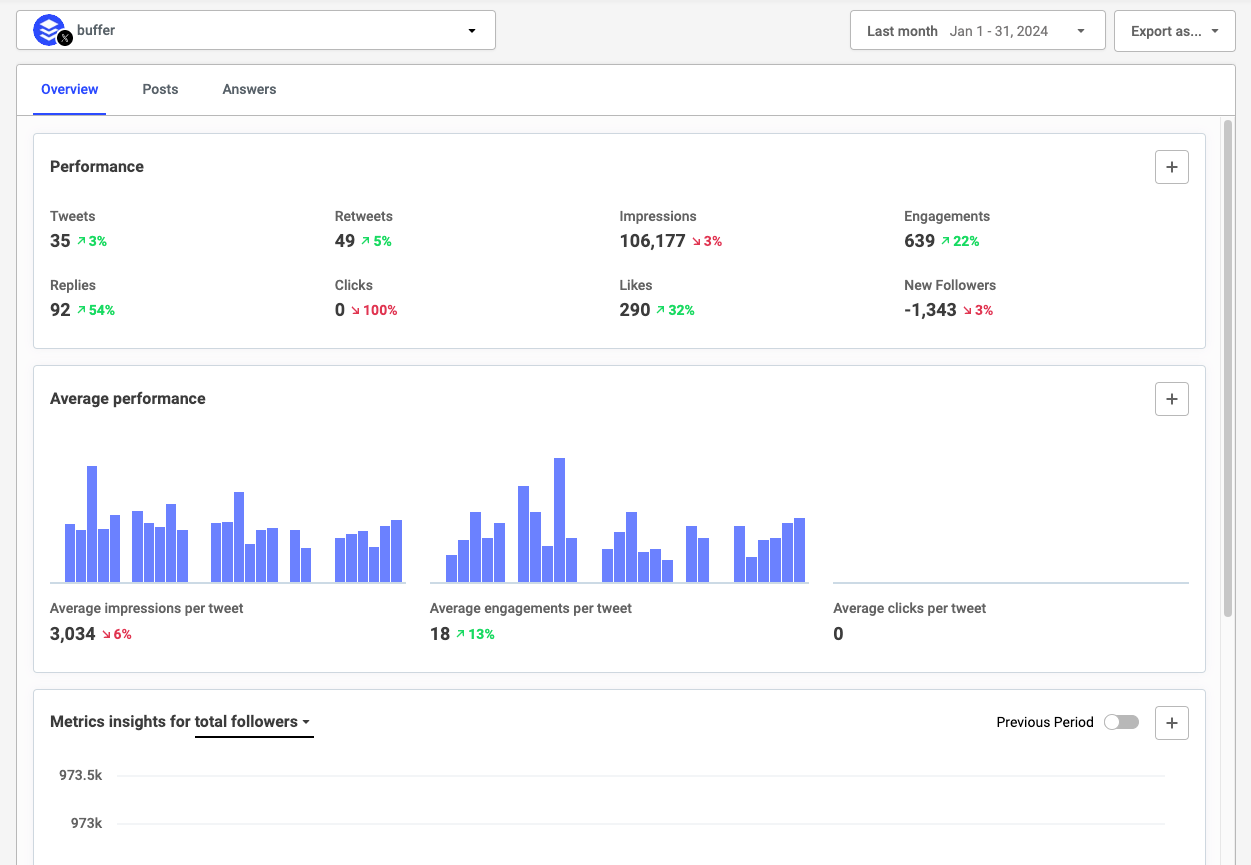
X’s native analytics dashboard doesn’t calculate averages for you. To see yours, head to Buffer's X analytics dashboard. The overview dashboard shows your average impressions per tweet, average engagements per tweet, and average clicks per tweet for posts with links.
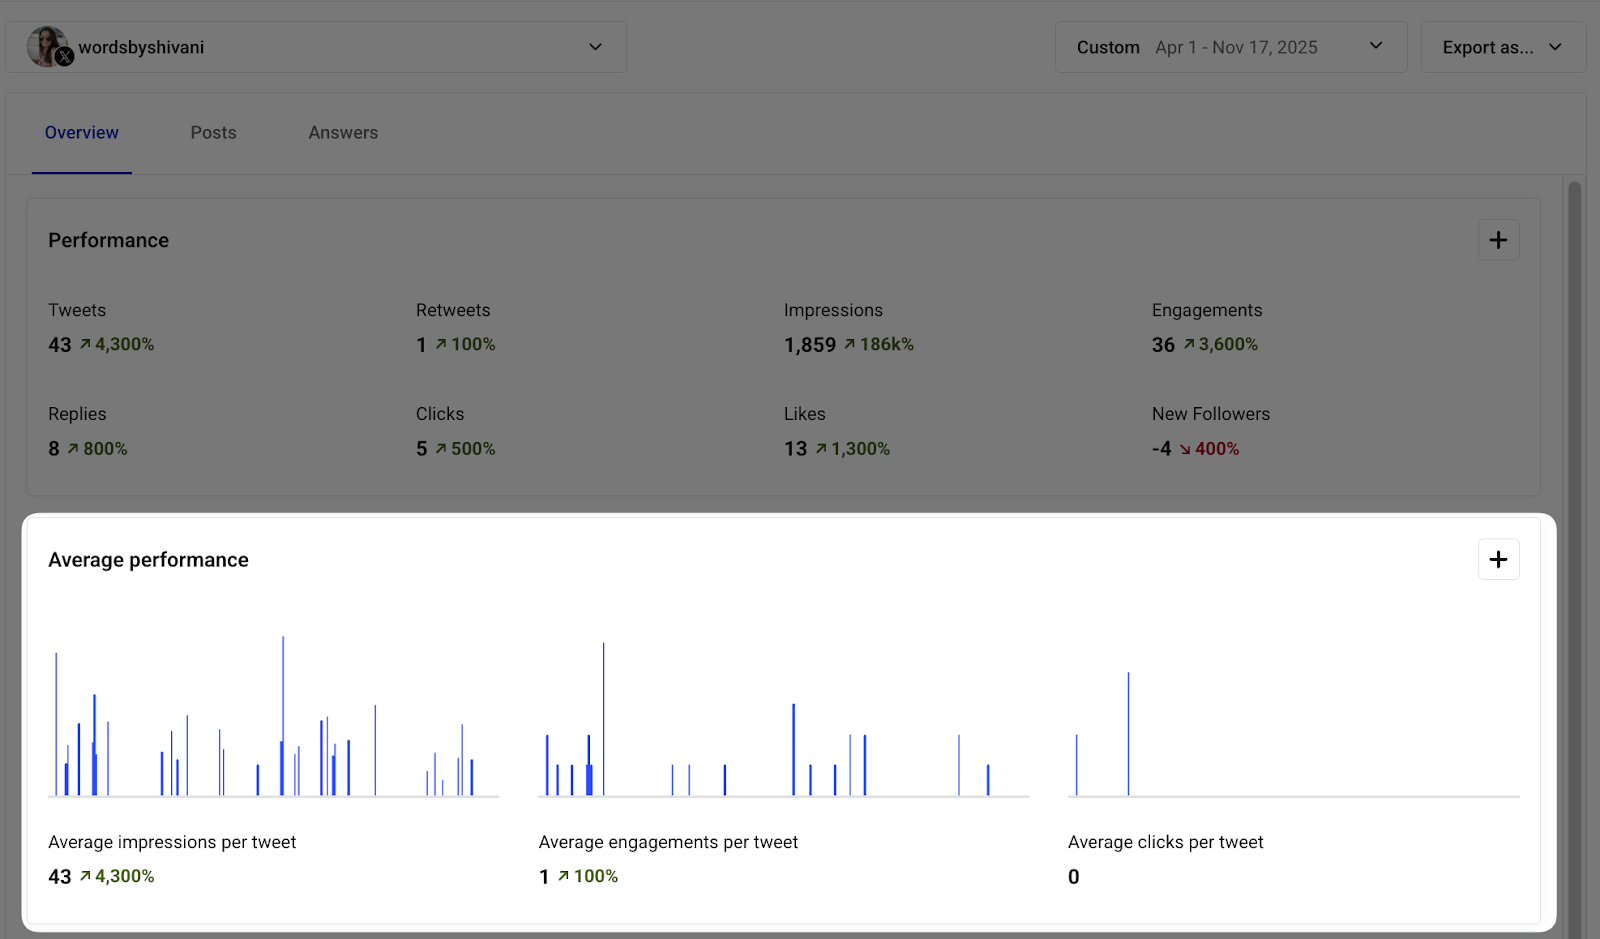
These numbers give you a quick snapshot of how your content performs on average. There’s no need for doing math — Buffer takes care of it for you.
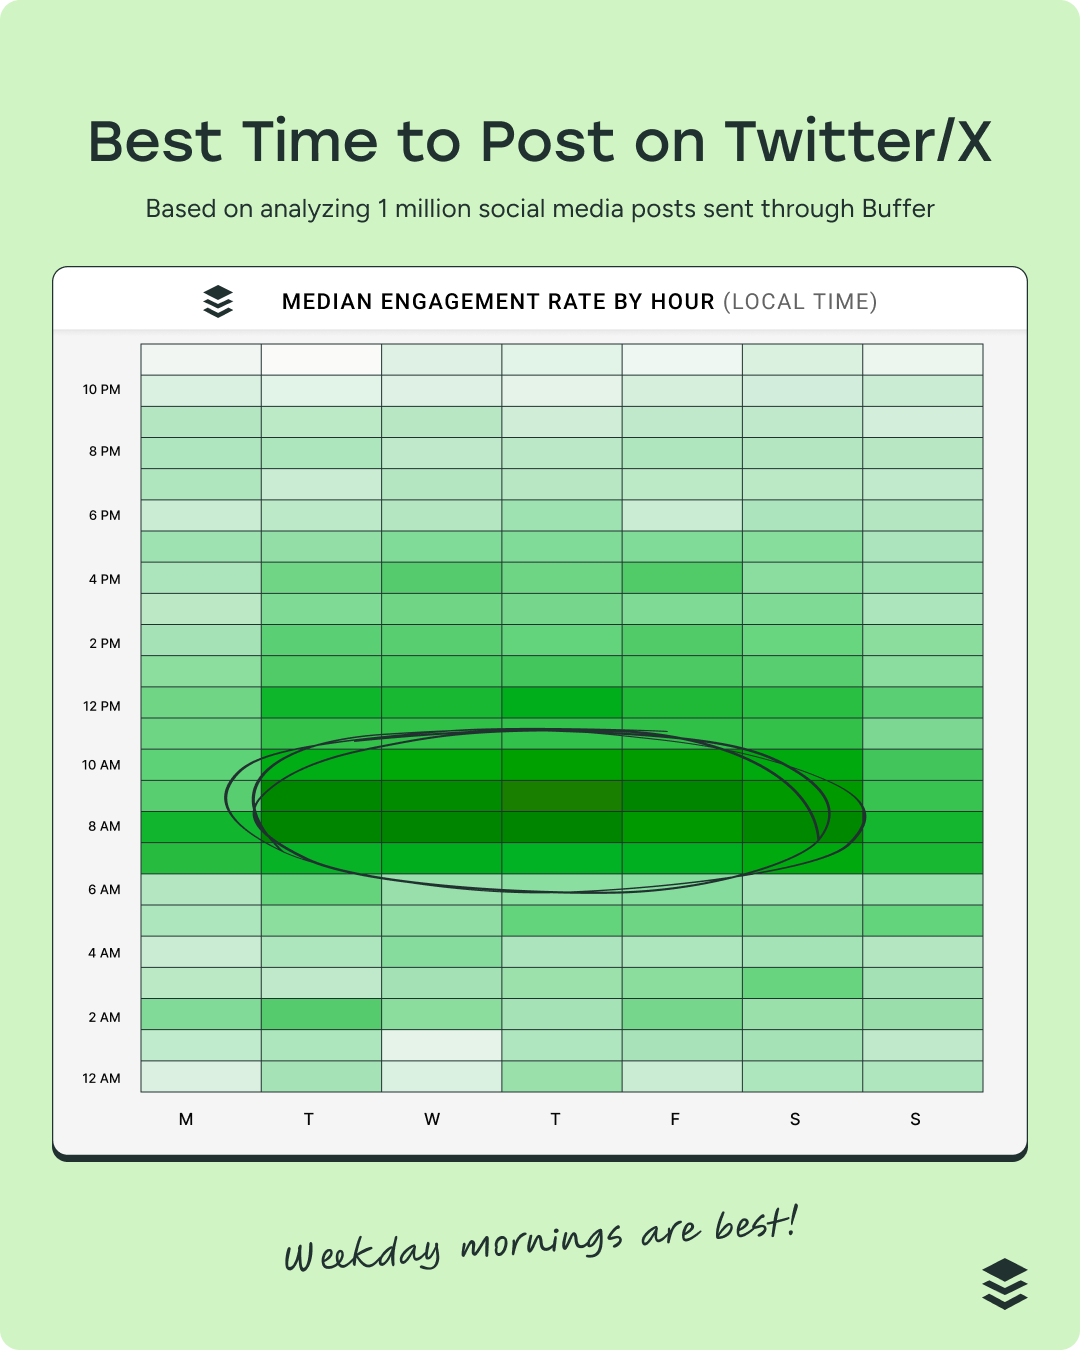
5. Pinpoint the best times to post
When you post can matter as much as what you post. Buffer’s analysis of more than one million posts found that the best times to post on X are, in order:
- 9 a.m. on Wednesdays
- 8 a.m. on Tuesdays
- 8 a.m. on Mondays
If you’re just getting started, these times are a helpful baseline. Once you’ve built up a posting history, your own tweet data is the real gold — patterns in your data will reveal when your audience is online, scrolling, and ready to engage.
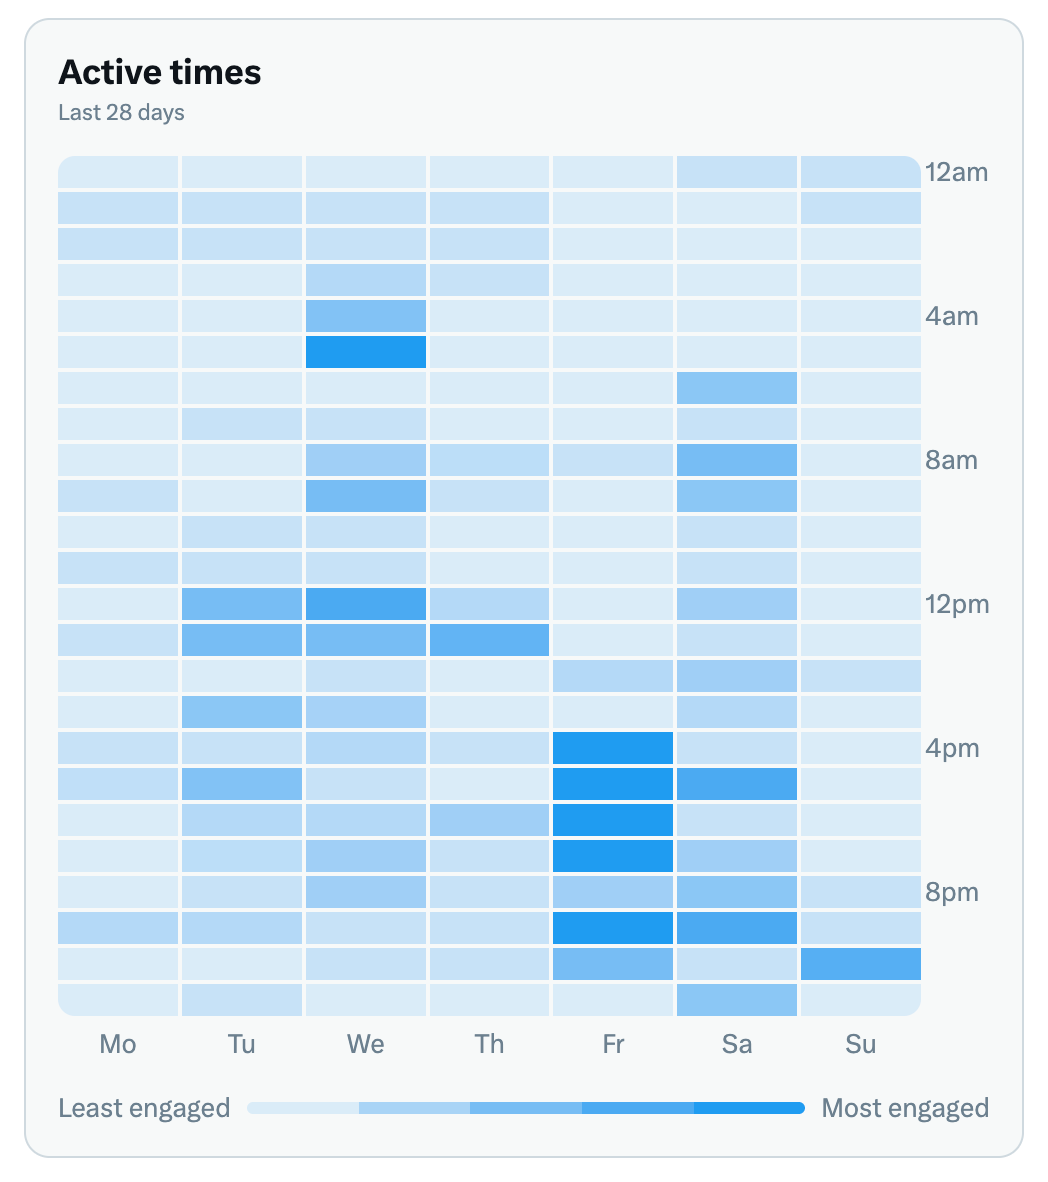
Where to find timing insights in X
X doesn’t offer timing performance for individual posts, but the Audience tab in X analytics shows when your followers are most active.
Use this insight to test scheduling your tweets at high-activity hours. If your engagement climbs, you’re on target. If not, it’s time to experiment with different times (pun intended).
Where to find timing insights in Buffer
For timing data tailored to your own audience, Buffer’s Answers tab breaks down your average engagement rate by day of the week.
Match your highest-performing days to Buffer’s recommended hours on that day for the best shot at reaching your target audience when it counts.
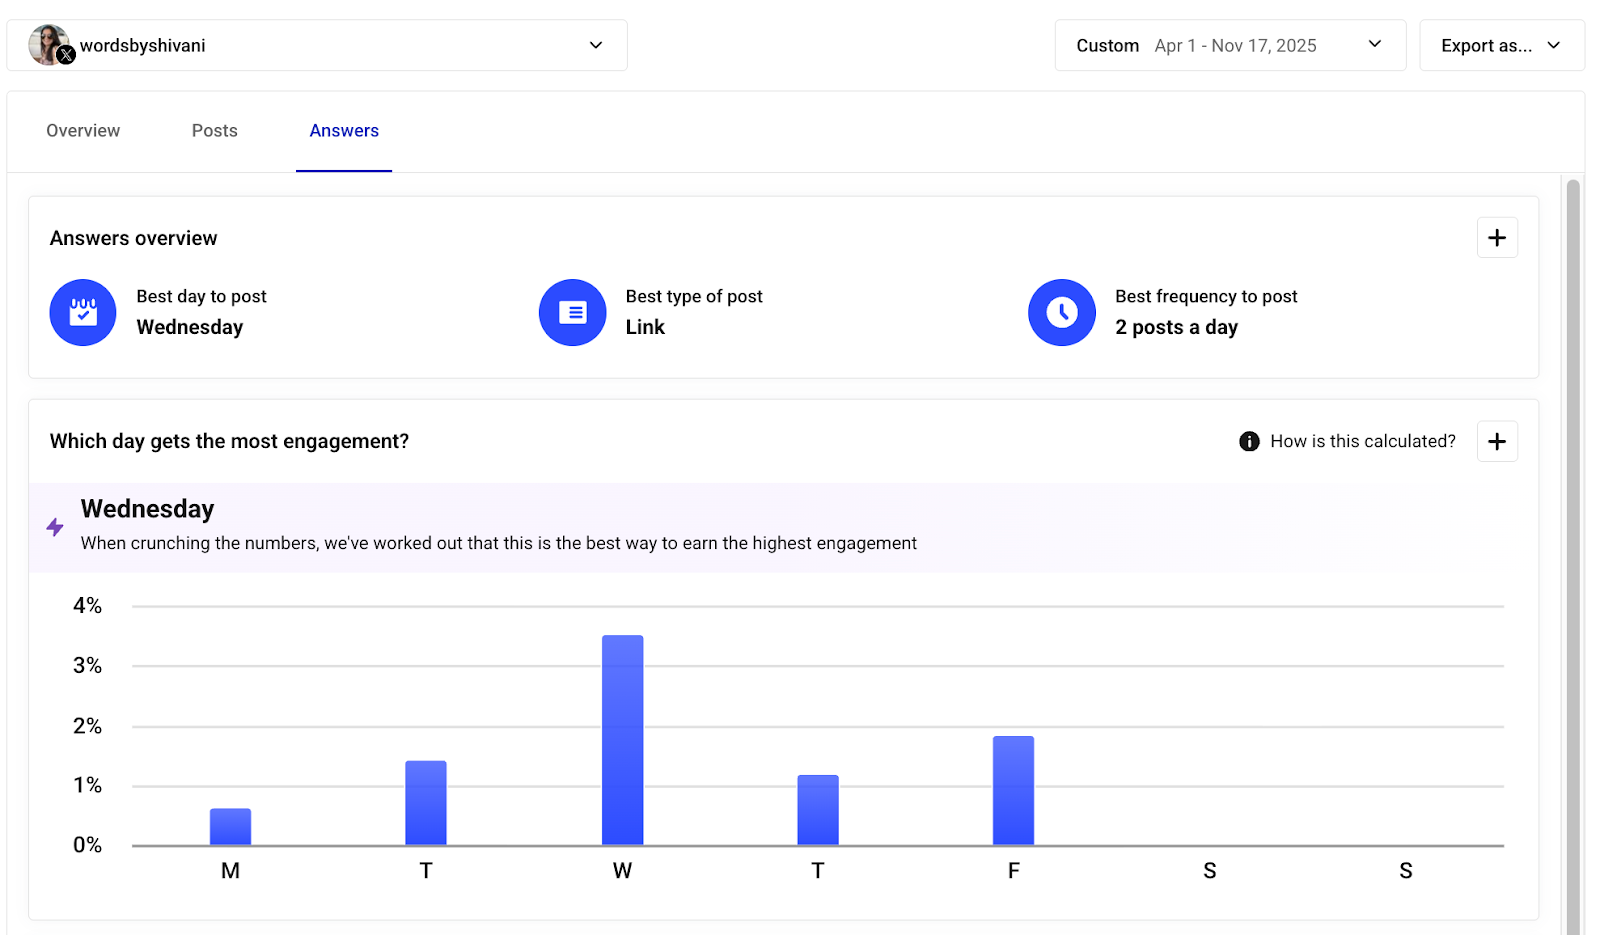
This data may change as your audience grows, so keep checking it to make sure you continue to make sure your timing always matches what works best for your community.
6. Spot what’s driving follower growth
The real story behind your follower count is found in the details: sharp jumps after a campaign, steady climbs tied to consistent posting, or even a sudden and unexpected drop.
Map how your follower numbers change over time to specific actions. Here are some questions you can ask while analyzing your follower metrics:
- What did I post in the 24–48 hours before the spike or dip?
- Did those posts get shared outside my followers, or did they only reach my current followers?
- Was the topic, tone, or format different from what I usually share?
- Did profile visits increase on the same day my follower count changed?
- Is this a short-term fluctuation, or does the trend continue over several days or weeks?
With this trend-focused view, you can double down on tactics that work and rethink moves that stall growth.
Where to find follower growth data in X
On the Twitter account overview dashboard, the Follows over time chart shows daily counts of new followers and unfollows.
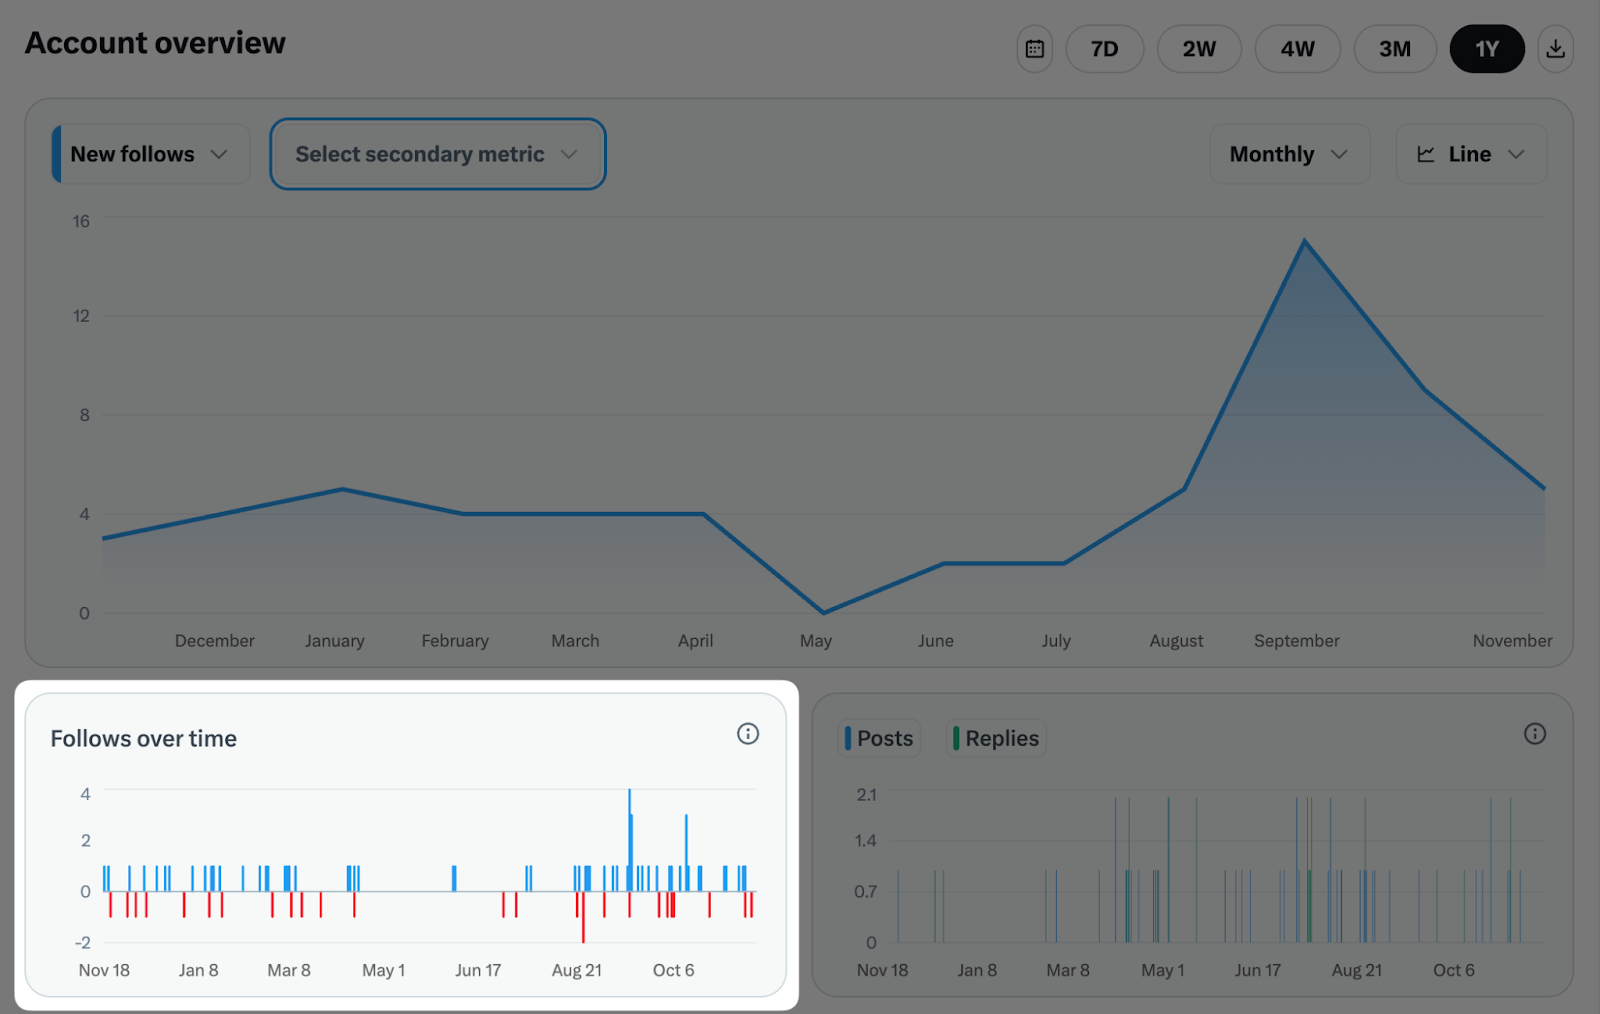
Use the comparative chart to layer new followers with metrics like impressions, profile visits, reposts, and engagement rate. This makes it easy to analyze spikes in your follower count and compare them to posts or campaigns active at the time.
Where to find follower growth data in Buffer
Scroll down Buffer’s overview dashboard for a chart that tracks your total followers over time. Switch the chart to new followers to see how many people followed you each day so you can connect those changes to specific posts, campaigns, or activity.
7. Use audience insights to check if you're reaching the right people
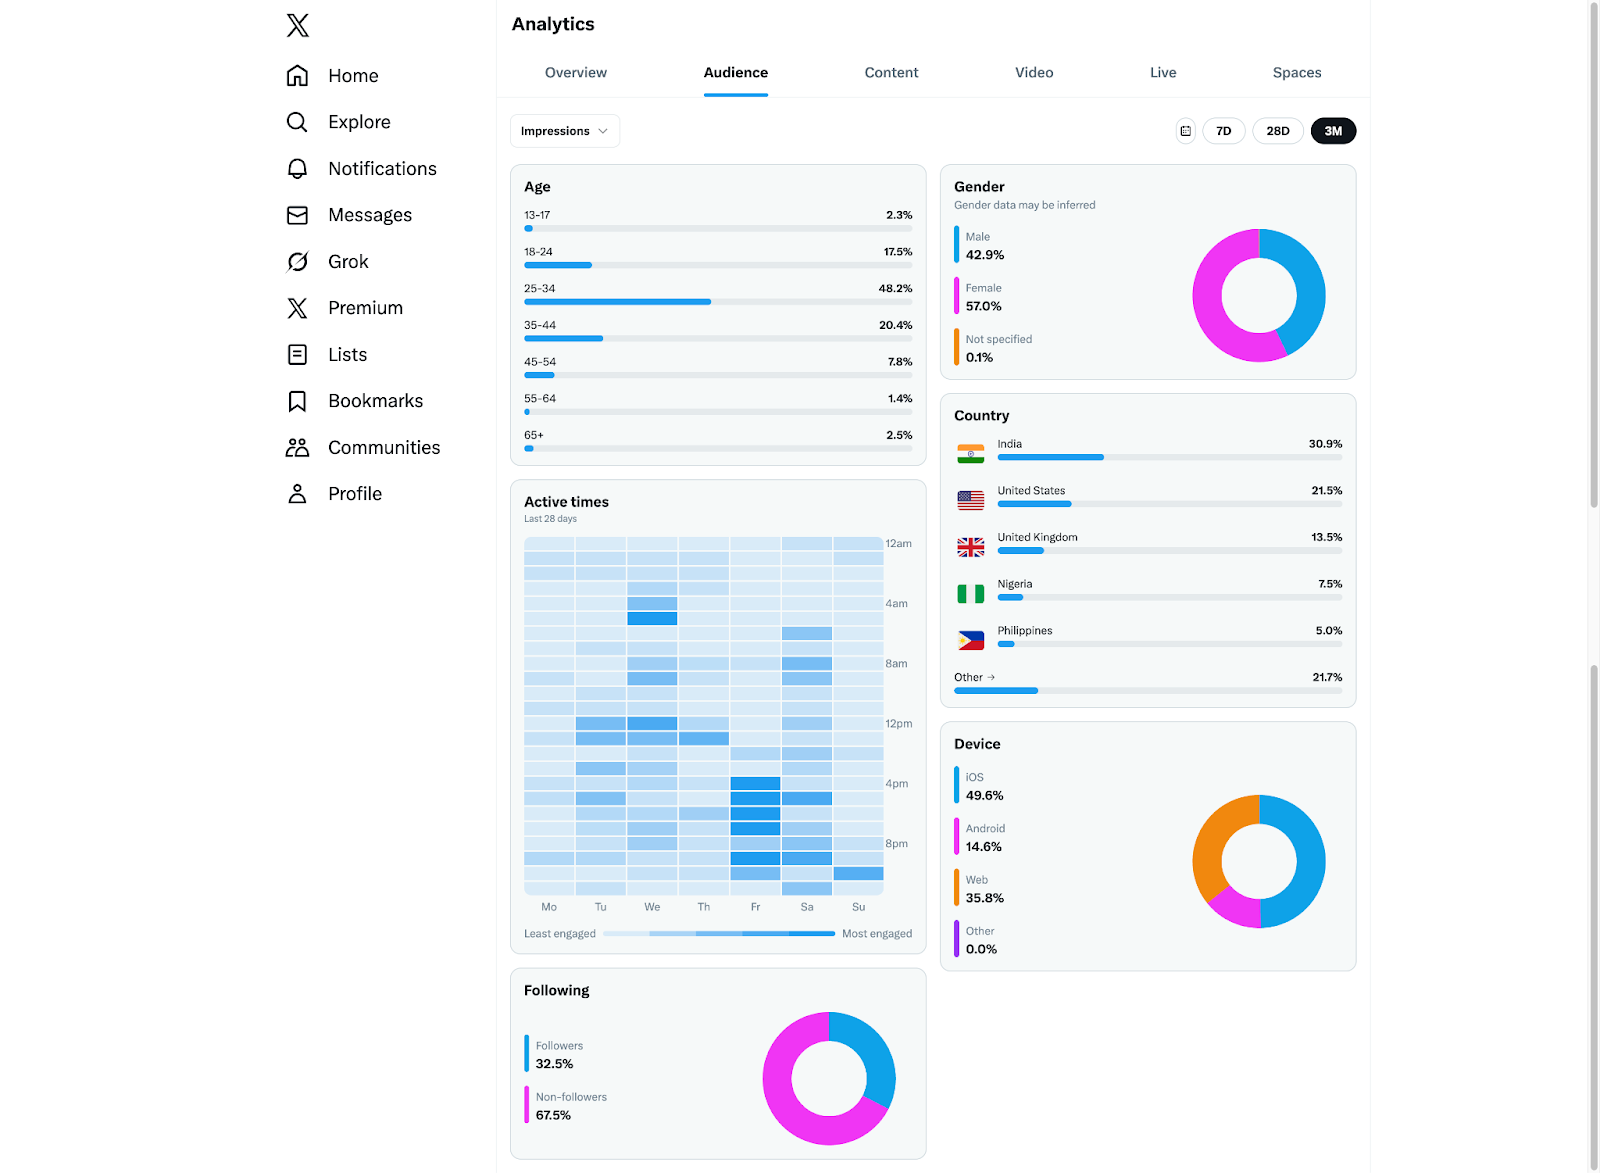
The audience dashboard on Twitter is a visual data lover’s dream. You get charts and graphs that tell you who’s actually seeing and responding to your tweets:
- Age
- Gender
- Location (at the country level)
- Whether they’re a follower or not
- Their most active times
- Even the devices they use — X’s iOS or Android apps, web app, or somewhere else
When you compare this data with the audience you want to reach, you start to see whether your content is attracting the right audience or drifting toward a different set of X users.
Here are a few ways this data can guide you:
- If most of your viewers are based in places you’re not targeting, your posting schedule may be missing the window when your target audience is online.
- If the age range skews older or younger than what you aim for, your topics or formats may be resonating with the wrong group.
- If the gender split looks very different from what you expect, your messaging may be landing unevenly and needs a tune-up.
- If you’re testing a new content direction and your audience mix suddenly shifts, that’s a sign you’re reaching a different segment than usual.
These audience insights are also incredibly useful for creators looking to partner with brands. You can check whether your audience aligns with partners or sponsors you’re hoping to collaborate with, and use this data to strengthen your media kit.
Where to find audience insights in X
To find your audience demographics, head to the Audience tab in the Twitter analytics dashboard.
You’ll also find audience insights for individual posts in the Content tab, which helps you see who each post reached.
Buffer doesn’t offer audience demographics for X yet, but Twitter analytics gives you plenty to work with as you shape your strategy.
If X has analytics, where does Buffer fit in?
Both X and Buffer give you plenty of useful data about how your posts perform. If you can get so much from X’s native analytics, do you really need a tool like Buffer as well?
Short answer: Buffer’s analytics are a great complement to Twitter’s. Here’s why.
Provides advanced analytics even if you have a free Twitter account
Most users don’t have access to advanced analytics, which are only available for X premium account holders.
Back in December 2022, the platform had more than 368 million monthly active users — and yet only about 640,000 people were premium subscribers as of April 2023. That means well under 1% of all creators, businesses, and everyday users on the platform have access to performance data.
Buffer fills that gap. On a paid Buffer plan, you get nearly the same data you’d find in X’s native analytics (except for audience demographics) even if you don’t pay for X premium.
And if you’re on Buffer’s free plan, you still get the essentials: impressions and engagement metrics for every post you publish.
Plus, Buffer’s Answers tab saves you from crunching numbers yourself. It pulls patterns out of your data automatically and shares actionable insights so you can spend your time on your content and your audience — not spreadsheets. And if you ever want to dig deeper, the raw data is always available to download.
Gives you a big-picture look at your entire social media data across all platforms
X’s native analytics only show you what’s happening on X. If you’re also posting to other social media platforms, you’re looking at each one separately to track performance. That means multiple tabs, different dashboards and spreadsheets, and no way to see patterns across everything you’re publishing.
Buffer brings all of that data into one place. You can track how your Twitter content strategy performs alongside your Facebook Pages, Instagram profiles, and LinkedIn Pages content.
Instead of piecing together performance data from four different places, you can spot which channels are driving results and which ones need attention, all from one place.
Pulls your social performance into clear, customizable reports
If you need to share how your Twitter posts are doing — whether with your manager, a client, or a brand partner — you can create professional-looking reports in Buffer. Pull in data from just your Twitter account, or mix in results from Facebook, Instagram, and LinkedIn if you’re working across platforms.
The reports are fully customizable, so you decide what metrics to include based on who’s reading it.
It just takes a few clicks to set up and export your report in Buffer. And because X doesn’t have reporting built in, Buffer covers the steps you’d otherwise handle manually with raw data and screenshots.
Which Twitter analytics tool is right for you?
Twitter analytics offers a powerful set of tools to track performance. If X is your main channel, it may be worth paying for Premium to access everything the platform offers.
If you’re publishing across more than just X, Buffer gives you a full view of your social media performance. You get Twitter analytics alongside your data from Facebook, Instagram, and LinkedIn, plus tools that help you understand trends, compare performance, and create reports without switching dashboards.
In the end, it comes down to what you need. If your priority is going deeper on X alone, the native analytics may be the right fit. If you want to see how your content performs across channels and keep everything in one place, Buffer can help you make sense of it all.
FAQ about Twitter analytics
Are Twitter analytics free?
Basic analytics are available on free X accounts, including impressions and engagements on individual posts. More advanced analytics — like full account performance and audience insights — require an X Premium subscription.
Where do I find my X analytics?
On the web, you can access analytics directly from X’s analytics dashboard. On mobile, Premium users can find analytics under the Premium tab. Free users can tap the bar chart icon on individual posts to see performance.
What metrics matter most in X analytics?
The most useful metrics depend on your goals, but impressions, engagement rate, and follower growth are a strong starting point. Together, they show whether your content is being seen, interacted with, and driving long-term growth.
Does Buffer show X (Twitter) analytics?
Yes. Buffer provides X analytics on both free and paid plans, including impressions, engagement metrics, and post-level performance, even if you don’t have X Premium.
What’s the difference between X analytics and Buffer analytics?
X analytics focuses only on performance within X. Buffer analytics adds averages, trends, and cross-platform insights, helping you understand how your X content performs alongside other social channels.
What’s the best time to post on X?
Data suggests weekday mornings often perform well, but the best time to post depends on your audience. Reviewing your own engagement patterns over time is the most reliable way to find your optimal posting schedule.
How do I know if my X content is helping me grow followers?
Track follower changes alongside recent posts and campaigns. Spikes or dips often connect to specific content, timing, or increased profile visits, which can reveal what drives people to follow you.
More Twitter/X resources
- The Best Time to Post on Twitter/X: Based on Data from 1 Million Posts
- Do Posts with Links Affect Content Performance on X?
- Does X Premium Really Boost Your Reach? An Analysis of 18M+ Posts
- How to Schedule Tweets: When to Post, What to Use, and How to Do It Right
- We Analyzed 1.7M Posts from X, Threads, and Bluesky: Here’s What We Learned
Try Buffer for free
200,000+ creators, small businesses, and marketers use Buffer to grow their audiences every month.