
50 Video Marketing Stats to Help You Create a Winning Social Media Strategy in 2017

Product Marketing @ Buffer
Video is taking over social media.
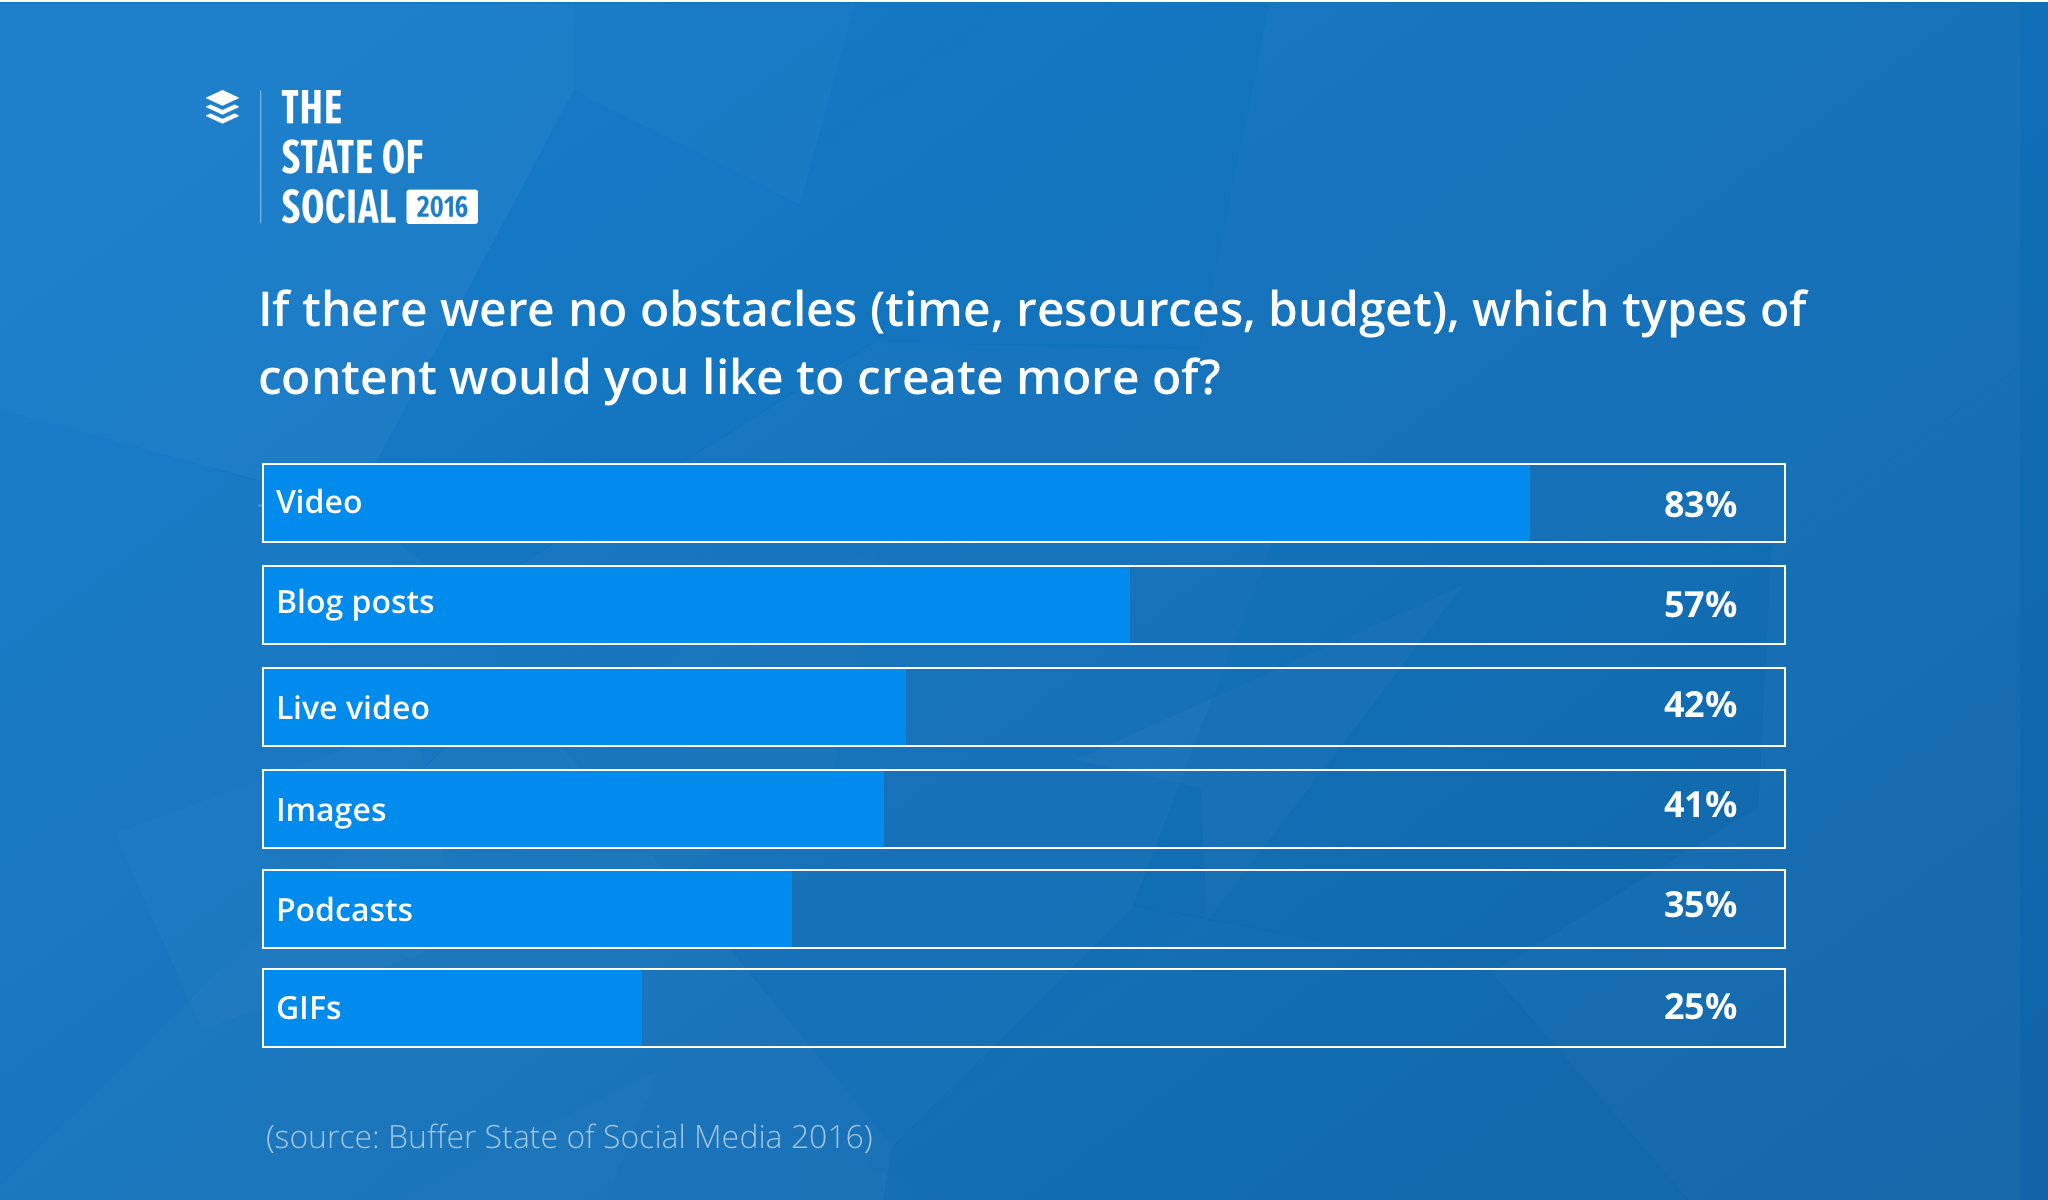
In our end of 2016 social media survey, 83 percent of marketers said they’d like to create more video content if they didn’t have restraints such as time and resources. We also found that 30 percent of marketers are looking to spend more time focused on Facebook video in 2017.
To help you make the fullest use of video marketing on social media and create a successful social media strategy for 2017, we’ve pulled together 50 of the most relevant video marketing statistics for social media marketers.
Did you know, for example, that Facebook video receives, on average, 135 percent more organic reach than a Facebook photo? Or that 73 percent of B2B marketers say that video positively impacts marketing ROI?
Check out more fascinating video statistics covering topics like marketing trends, user behavior, engagement, and much more below!

50 video Marketing statistics for 2017
The statistics are categorized into:
Feel free to use the quick links above to jump to the section you’re most interested in.
Let’s jump right in!
—
1. Trends
1) Online videos will account for more than 80% of all consumer internet traffic by 2020 (CISCO, 2016). Tweet
2) Over 8 billion videos or 100 million hours of videos are watched on Facebook every day (TechCrunch, 2016; TechCrunch, 2016). Tweet
3) 10 billion videos are watched on Snapchat every day (Bloomberg, 2016). Tweet
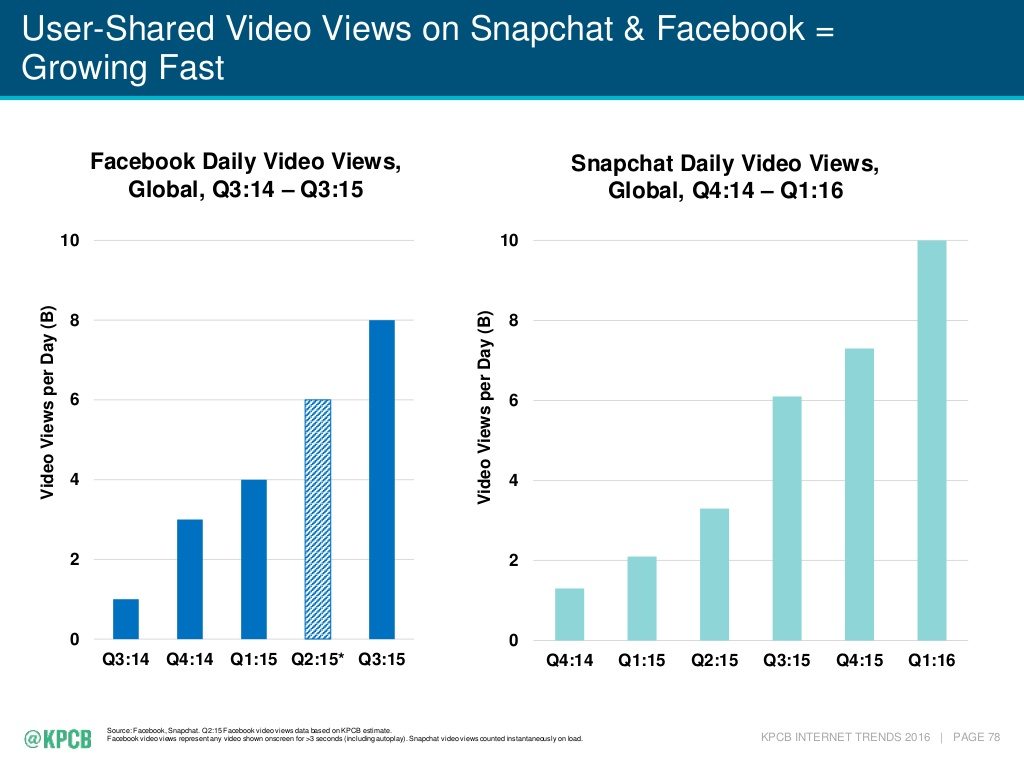
(Image from KPCB)
4) Video views on Twitter grew 220X from December 2014 to December 2015 (Twitter, 2015). Tweet
5) Periscope users have created more than 200 million broadcasts (Periscope, 2016). Tweet
6) Periscope users watch over 110 years of live videos every day (Periscope, 2016). Tweet

7) More than 500 million hours of videos are watched on YouTube every day (Business Insider, 2016). Tweet
8) Searches related to “how to” on YouTube grew 70% from 2014 to 2015 (Google, 2015). Tweet
9) More than 100 million hours of how-to YouTube videos were watched in North America in the first five months of 2015 (Google, 2015). Tweet
—
2. Marketers’ usage
10) 60% of marketers used videos in their social media marketing in 2016 (Social Media Examiner, 2016). Tweet
11) 14% of marketers used live videos in their social media marketing in 2016 (Social Media Examiner, 2016). Tweet
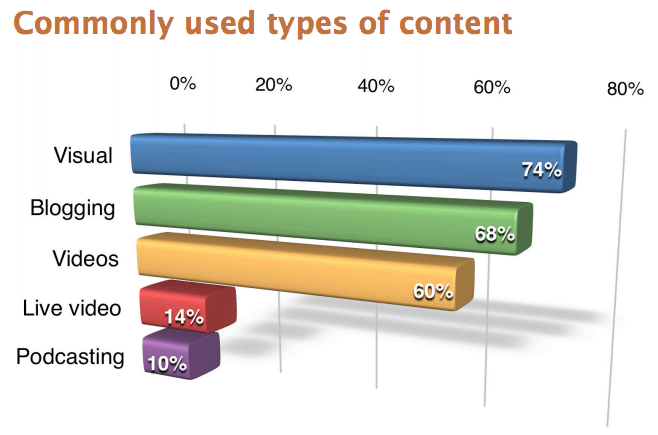
12) 73% of marketers plan on increasing their use of videos (Social Media Examiner, 2016). Tweet
13) 50% of marketers plan on using live videos. (Social Media Examiner, 2016). Tweet
14) 44% of SMB owners and marketers plan to spend money to promote their video content on Facebook in 2017 (Animoto, 2016). Tweet
15) 83% of marketers said they’d create more video content if there were no obstacles like time, resources, and budget (Buffer, 2016). Tweet
16) 43% of marketers said they’d create more live videos if there were no obstacles like time, resources, and budget (Buffer, 2016). Tweet
17) 1 in 4 marketers and SMB owners feel behind on video marketing (Animoto, 2016). Tweet
—
3. Video watching behavior
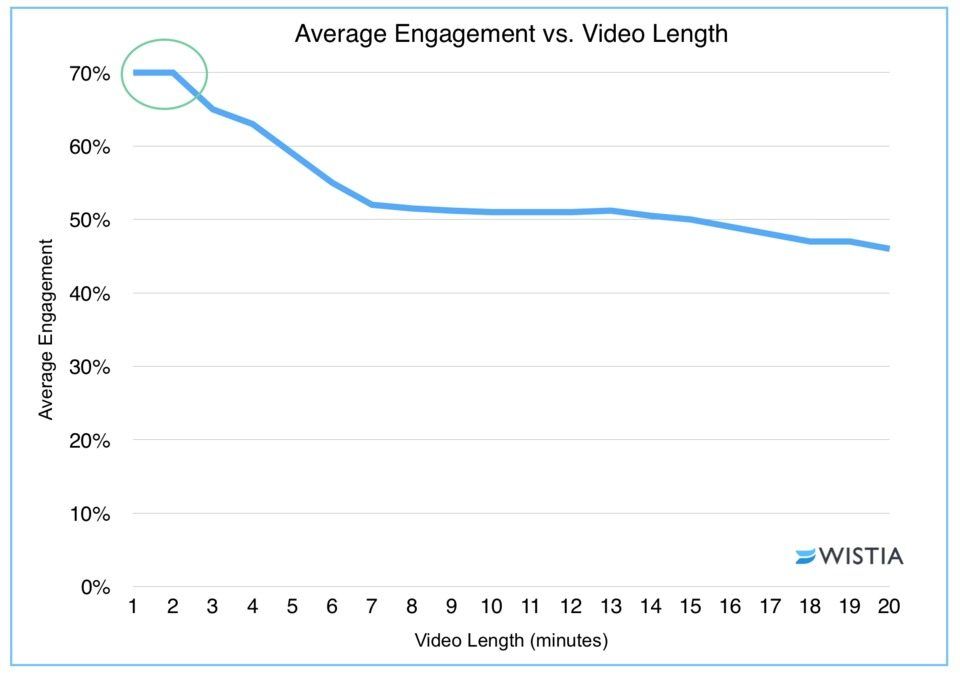
18) Videos up to 2 minutes long get the most engagement (Wistia, 2016). Tweet
19) 65% of people who watch the first three seconds of a Facebook video will watch for at least 10 seconds, and 45% will watch for 30 seconds (Facebook, 2016). Tweet
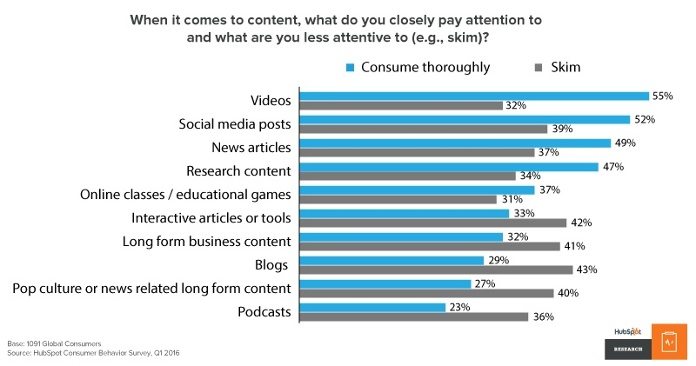
20) 55% of people consume videos thoroughly — the highest amount all types of content (HubSpot, 2016). Tweet
21) 85% of Facebook videos are watched without sound (Digiday, 2016). Tweet
22) More than 50% of videos are watched on mobile (Ooyala, 2016). Tweet
23) 93% of Twitter videos are watched on mobile (Twitter, 2016). Tweet
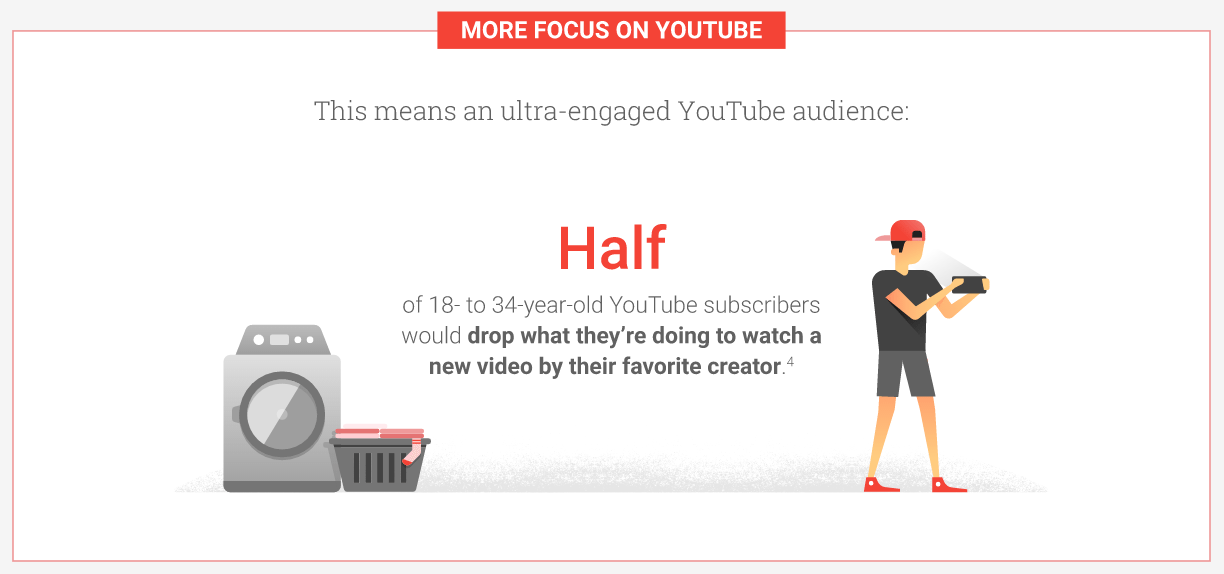
24) Half of 18- to 34-year old YouTube subscribers would drop what they’re doing to watch a new video by their favorite creator (Google, 2016). Tweet
—
4. Engagement
25) Facebook is rated as the most impactful social channel for video — 8.4X higher than any other social channel (Animoto, 2016). Tweet
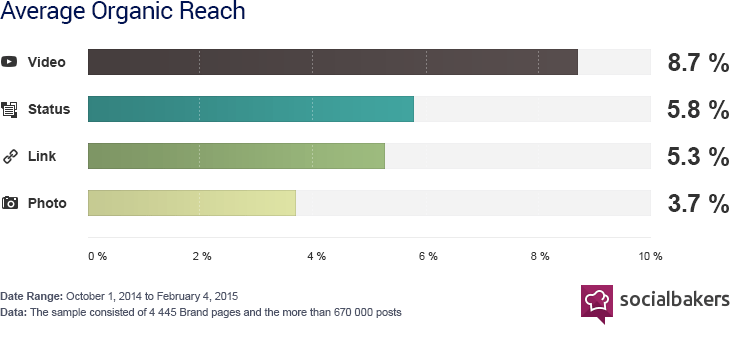
26) A Facebook video receives, on average, 135% more organic reach than a Facebook photo (Socialbakers, 2015). Tweet
27) In an average week, YouTube reaches more 18+ year-olds on mobile alone during prime-time TV hours than any cable TV network (Google, 2016). Tweet
28) 43% of people want to see more video content from marketers in the future (HubSpot, 2016). Tweet
29) Native videos on Twitter drive 2.5X replies, 2.8X retweets, and 1.9X favorites than third party players (Twitter, 2015). Tweet
30) Videos are 6X more likely to be retweeted than photos and 3X more likely than GIFs (Twitter, 2016). Tweet
—
5. Live videos
31) People spend, on average, more than 3x more time watching a Facebook Live video than a video that’s no longer live (Facebook, 2016). Tweet
32) Facebook users comment 10X more on live videos than they do on regular videos (Facebook, 2016). Tweet
33) 80% of Lifestream’s survey respondents would rather watch live video from a brand than read a blog (Livestream, 2016). Tweet
34) 82% of Lifestream’s survey respondents prefer live video from a brand to social posts (Livestream, 2016). Tweet
35) Video of a live event increases brand favorability by 63% (Twitter, 2016). Tweet
—
6. Video ads
36) Captions on Facebook video ads increase video view time by an average of 12% (Facebook, 2016). Tweet
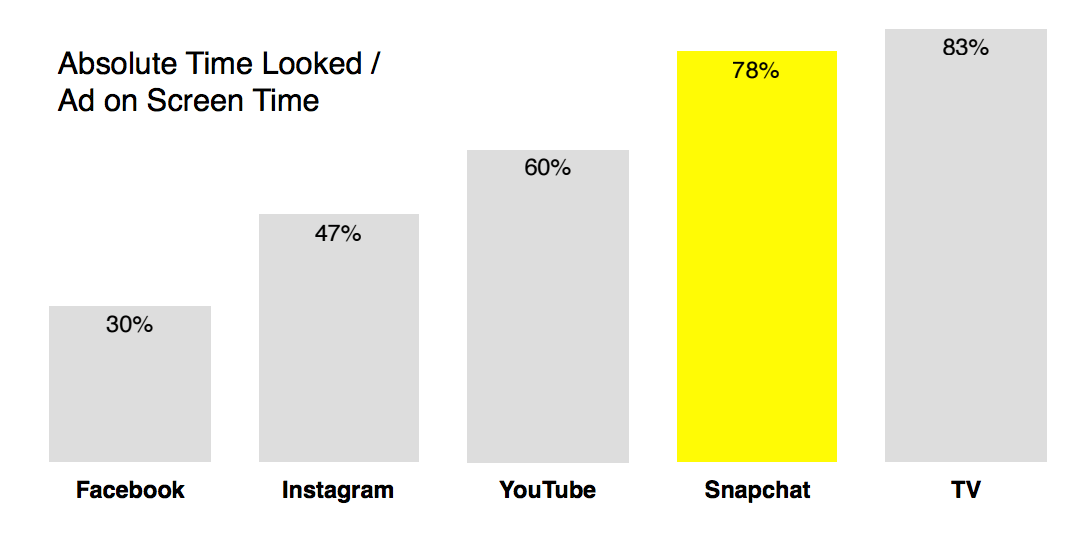
37) Snapchat video ads capture over 2X visual attention than Facebook video ads, over 1.5X than Instagram, and 1.3X than YouTube (MediaScience, 2016). Tweet
38) Snapchat video ads deliver over 2X the lift in purchase intent compared to TV, YouTube, Instagram, and Facebook video ads (MediaScience, 2016). Tweet
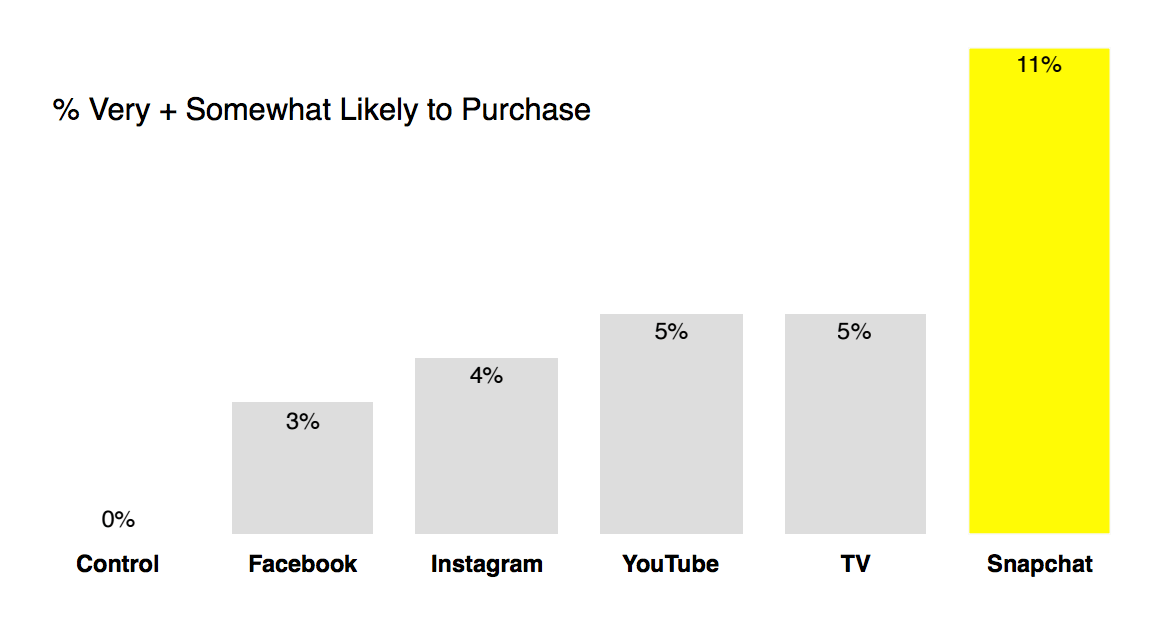
39) Snapchat video ads receive 5X more swipe up rate than average CTR on comparable platforms (Snapchat, 2017). Tweet
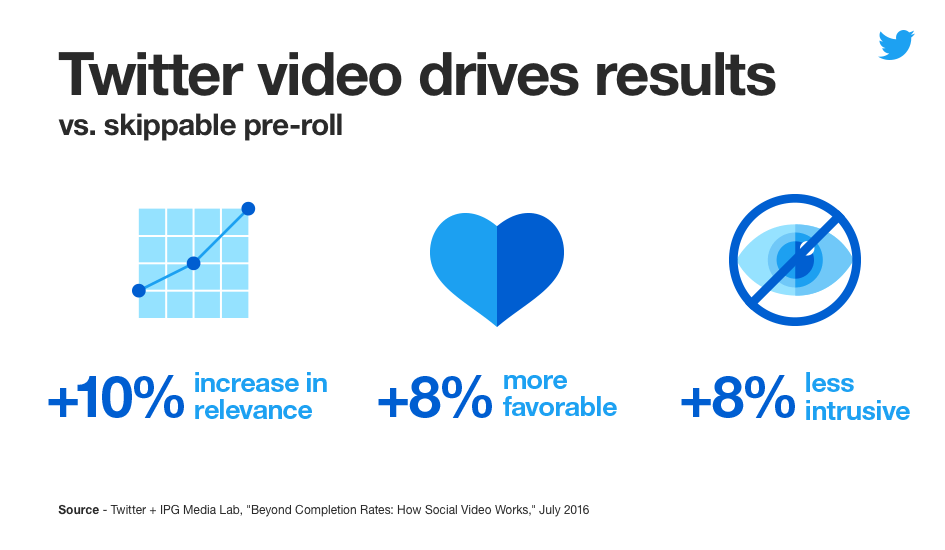
40) Twitter video ads are deemed to be 10% more relevant, 8% more favorable, and 8% less intrusive, compared to similar skippable pre-roll ads on publisher sites (Twitter, 2016). Tweet
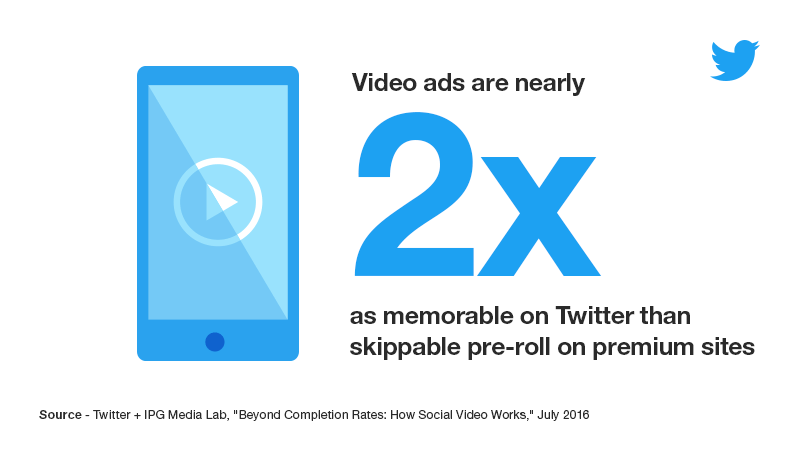
41) Video ads are nearly 2X as memorable on Twitter than skippable pre-roll ads on premium sites (Twitter, 2016). Tweet
—
7. Purchasing behavior
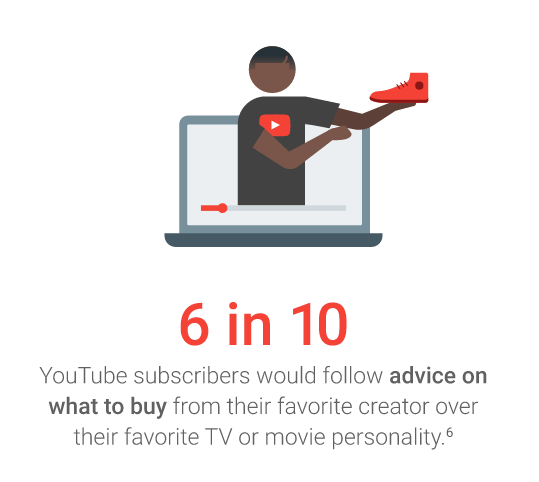
42) 6 in 10 YouTube subscribers would follow advice on what to buy from their favorite creator over their favorite TV or movie personality (Google, 2017). Tweet
43) 4X as many consumers would rather watch a video about a product than reading about it (Animoto, 2015). Tweet
44) 4 in 5 millennials consider video content when researching a purchase decision (Animoto, 2015). Tweet
45) 70% of millennials are likely to watch a company video when shopping online (Animoto, 2015). Tweet
—
8. ROI
46) Companies which use videos in their marketing grow revenue 49% faster year-on-year than those which don’t (Aberdeen Group, 2015). Tweet
47) 76.5% of professional marketers and SMB owners are seeing results with video marketing (Animoto, 2016). Tweet
48) 73% of B2B marketers say that video positively impacts marketing ROI (Tubular Insights, 2015). Tweet
49) Having a brand logo in a video can increase purchase intent by 9% (Twitter, 2016). Tweet
50) Companies which use videos in their marketing enjoy 27% higher CTR and 34% higher web conversion rates than those which don’t (Aberdeen Group, 2015). Tweet
—
How will you be using video in 2017?
Wow, that’s a lot of video marketing statistics! Hope you are now pumped about video marketing and have found a tip or two (or 50) to improve your video marketing efforts in 2017.
How will you be using video as a part of your marketing strategy in 2017? We’d love to hear in the comments below.
Thank you!
Try Buffer for free
140,000+ small businesses like yours use Buffer to build their brand on social media every month
Get started nowRelated Articles

With the newsletters on this list, you'll be able to stay on top of all developments in social media and learn from amazing experts

How to source the best audio clips for your TikToks while they’re still popular, plus examples of TikTok sounds with staying power.

Discover how to find content ideas for your social media posts that get engagement and love from your audience.