At Buffer, we’ve always marched to the beat of our own drum when it comes to how we pay our team. We make our salaries transparent to the whole world. We calculate all salaries with a fully transparent (and publicly available) formula. And we’ve been proud to be part of the Equal Pay Day conversation for the past two years, by sharing our full data in a transparent pay analysis.
For Equal Pay Day 2018, we are excited to take part again by sharing our 2018 pay analysis at Buffer. Here’s all that this report entails; feel free to jump to any of these sections:
1. Adjusted Pay And Unadjusted Pay
2. Buffer’s 2018 Pay Analysis
3. Comparing Buffer to Other Companies
4. Segmenting By Team And Skill Type
5. How Does Location Impact Pay?
6. Why Do We Have A Gap?
7. The Case for Transparent Salaries
We’re thrilled to continue participating in the discussion around Equal Pay Day and to bring more light to the topic of the gender pay gap. We hope that sharing more about our past and future journey with pay will be a valuable part of this conversation!
We’re going to share a little bit more about equal pay day for all races and ethnic groups, all of our data from our 2018 pay analysis, and dive into the “why” behind the numbers.
First, a quick note about equal pay day related to diversity …
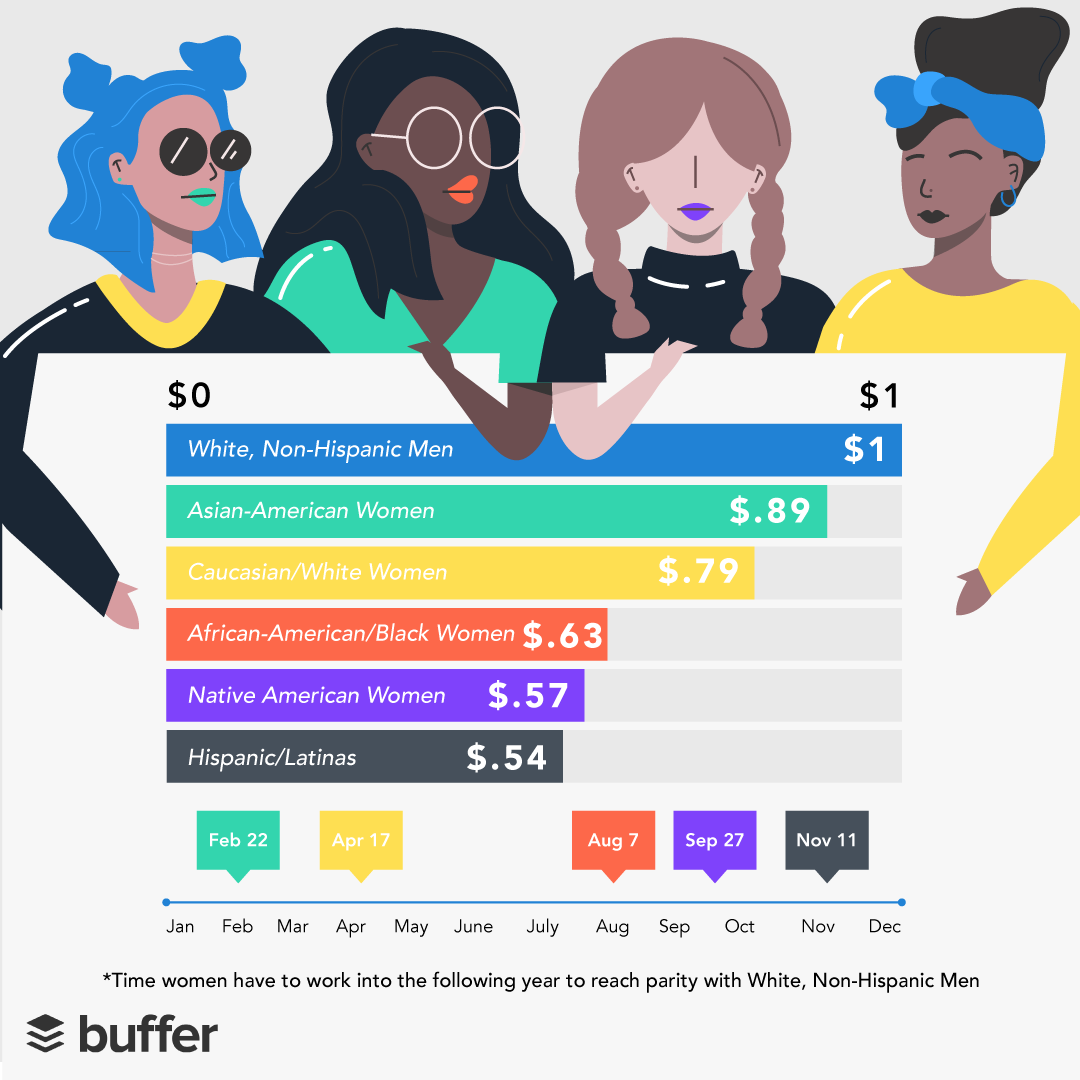
The chosen day for equal pay day signifies how far into the year women must work to earn what men earned in the previous year. The April 10 date for Equal Pay Day 2018 in the U.S. represents the average pay for all women compared to the average pay for men. However, we also wanted to recognize that Equal Pay Day is different for women of different races and ethnicities.
The graphic below provides more context on the exact dates and pay differences, based on data from Equal Pay Day Campaign.
The Difference Between Adjusted Pay And Unadjusted Pay
There are many ways to look at pay information.
Most companies calculate the pay gap by adjusting for people in similar roles who perform similar work. This type of calculation is commonly referred to as the adjusted number.
The unadjusted number is calculated by looking at what all men and women make at a company, regardless of their position, experience level, or type of work.
Unadjusted pay is a number that we pledged to report when we signed the White House Equal Pay pledge in 2016. This unadjusted number is what the UK government is requiring all companies with more than 250 workers to report starting this year. We’re grateful for the transparency and accountability that this is providing into the pay gap.
Let’s take a look at our adjusted and unadjusted numbers for the pay gap in 2018!
Note: These are sometimes called controlled and uncontrolled pay, which means the same as adjusted and unadjusted pay.

Buffer’s 2018 Pay Analysis
At the time of this analysis (April 4th, 2018) we have 48 men on the team (70% of the team) and 21 women (30% of the team.)
Adjusted
When we remove location and assume that people are placed in the right experience level, men and women in the same role are paid the same because we use a salary formula to determine pay and there is no negotiating. This has been the case at Buffer since 2013 when we first started using a formula.
Unadjusted
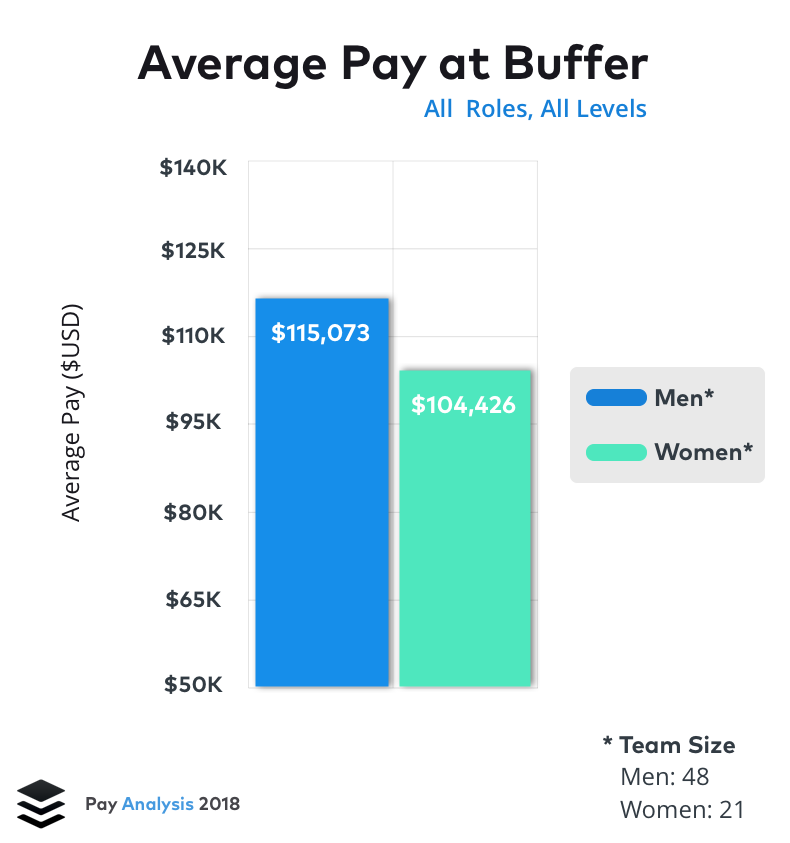
Average
Men: $115,073
Women: $104,426
Women earn 9.25% less than men.
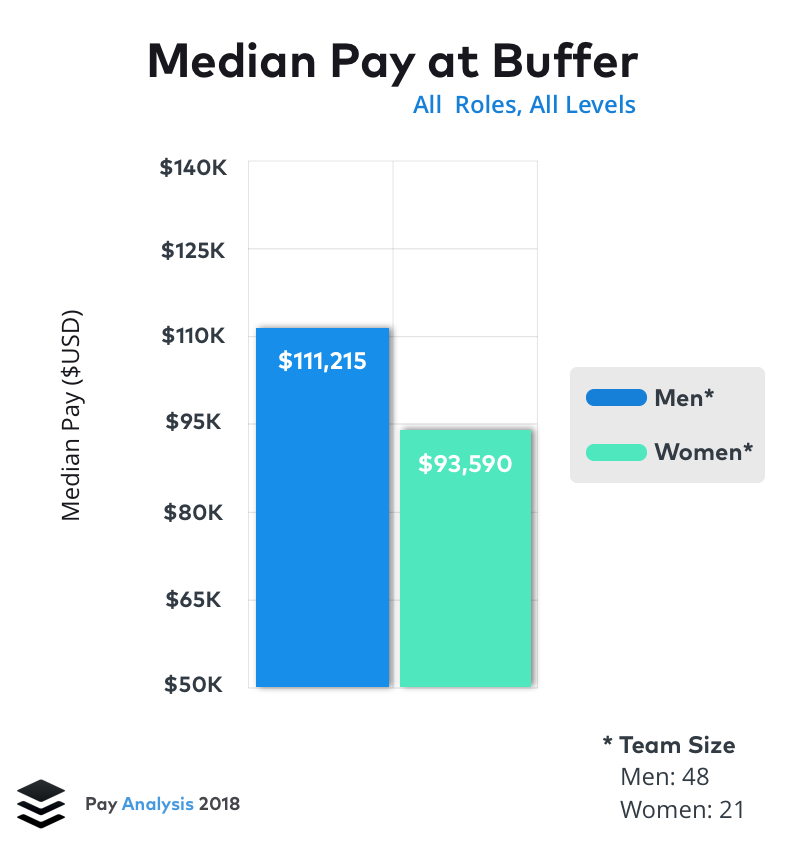
Median
Men: $111,215
Women: $93,590
Women earn 15.8% less than men.
Comparing Buffer’s Pay Analysis to Other Companies
We’re very excited about the gender pay data that the UK government requires because previously very few companies would share their unadjusted numbers.
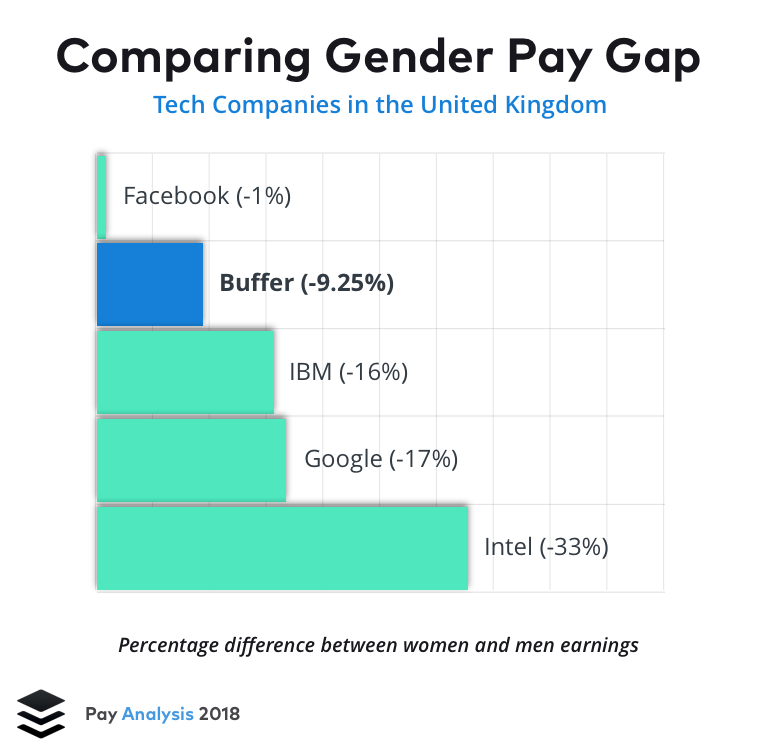
Although there are some key differences between us and these UK companies (we have fewer employees and our workforce is spread around the world) it is still nice to have a more accurate benchmark of how Buffer is doing compared to other tech companies.
Wired found that from 18 tech companies in the UK, women earn an average of 15% less than men. Here’s a look at how Buffer’s average unadjusted pay gap compares to a few of these companies:
Segmenting Our Pay Analysis By Team and Skill Type
Our 9.25% pay gap that we see within all of Buffer, differs from team to team. We took unadjusted pay and incorporated two adjustments. One is skill type, technical and non-technical, and the other is breaking apart various teams.
By Skillset
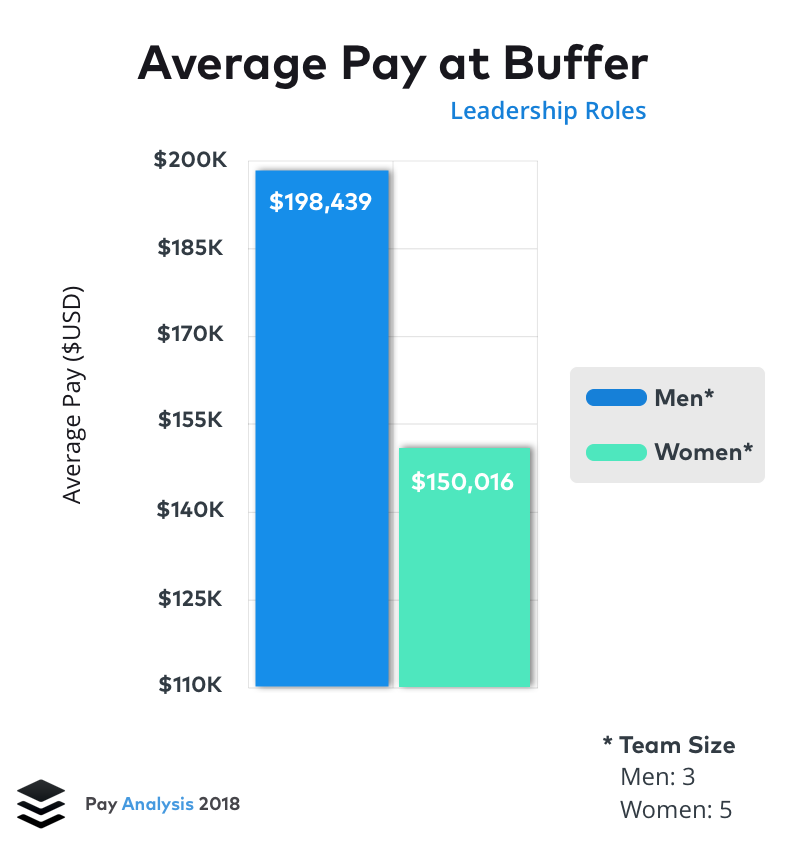
Leadership
Salary for men: $198,439
Salary for women: $150,016
Women earn 24.4% less than men.
Technical
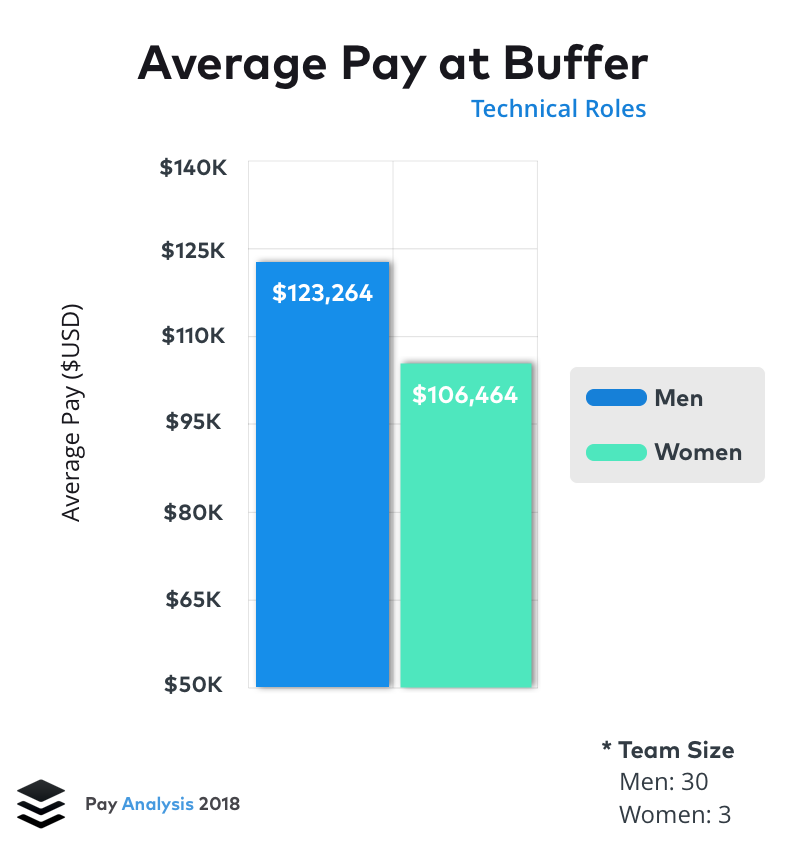
Salary for men: $123,264
Salary for women: $106,464
Women earn 13.6% less than men.
Non-technical
Salary for men: $82,017
Salary for women: $86,421
Men earn 5% less than women.
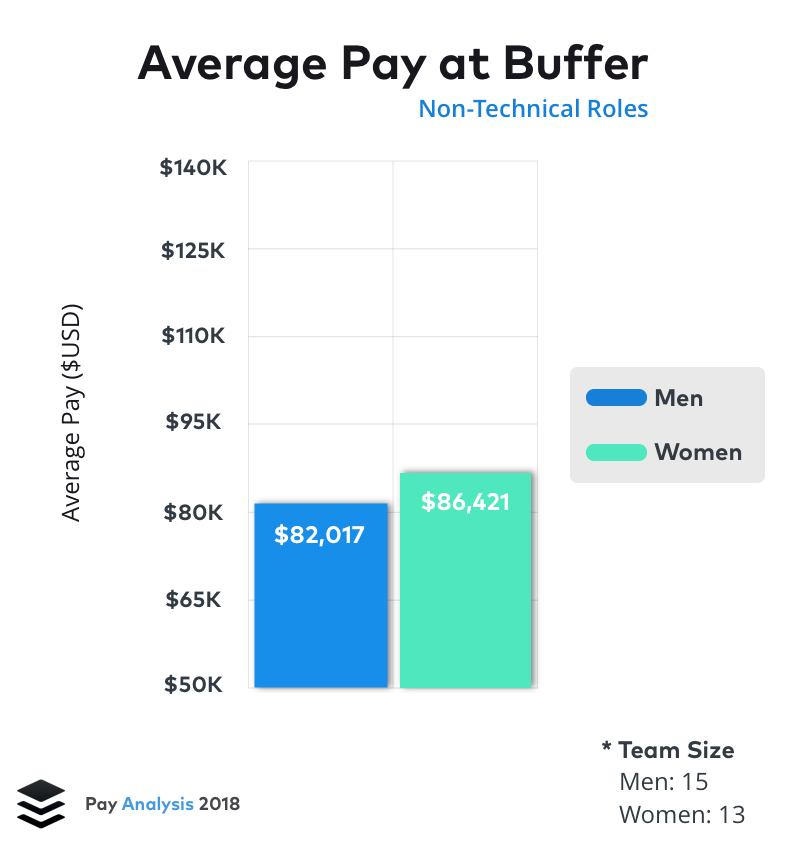
What we can see here is in non-technical, which is closest to having a 50/50 gender split, women earn slightly more than men. On the technical side, where there are far more men than women, men earn more. And on the leadership team, although there are more women than men, men earn more. This is due to our CEO being included here as well as having one man in a higher paying city, without any women in higher paying cities.
By team
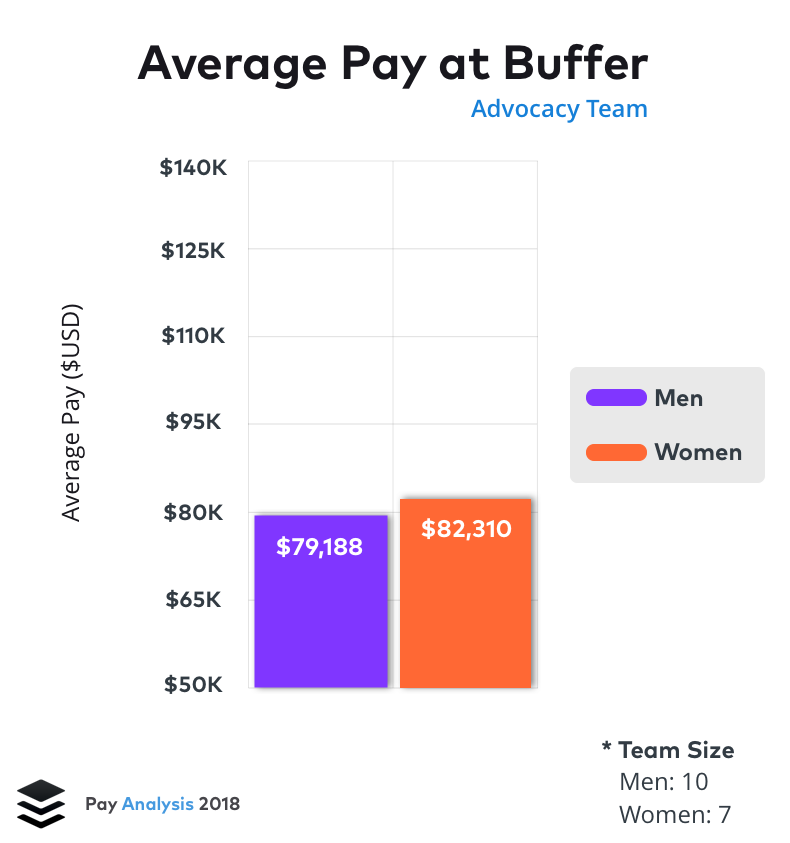
Advocacy
Men: $79,188
Women: $82,310
Men earn 3.7% less than women.
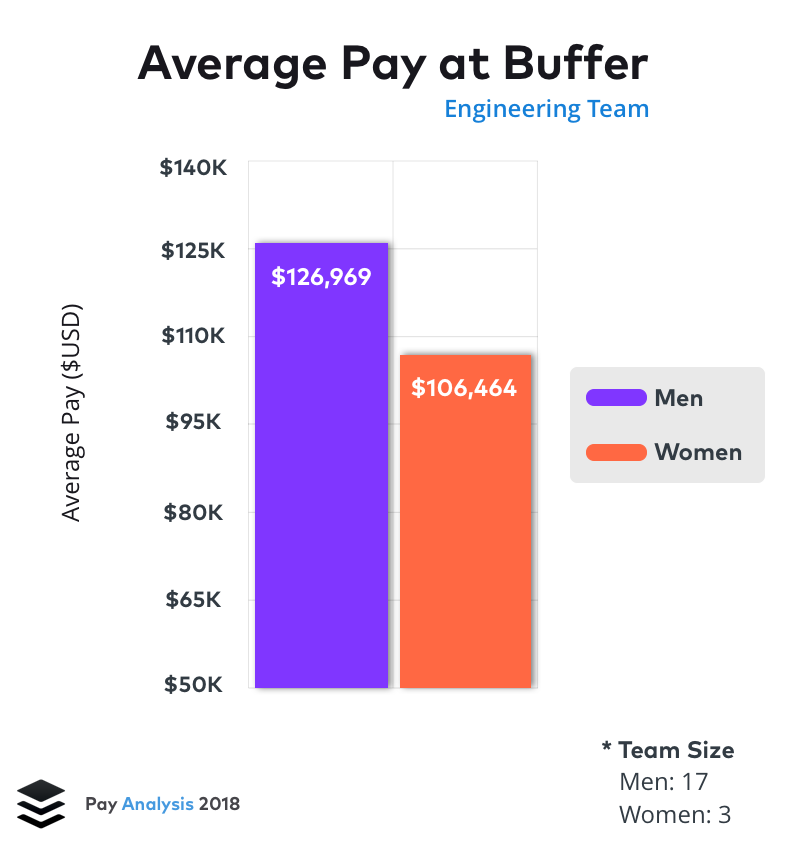
Engineering
Men: $126,969
Women: $106,464
Women earn 16% less than men.
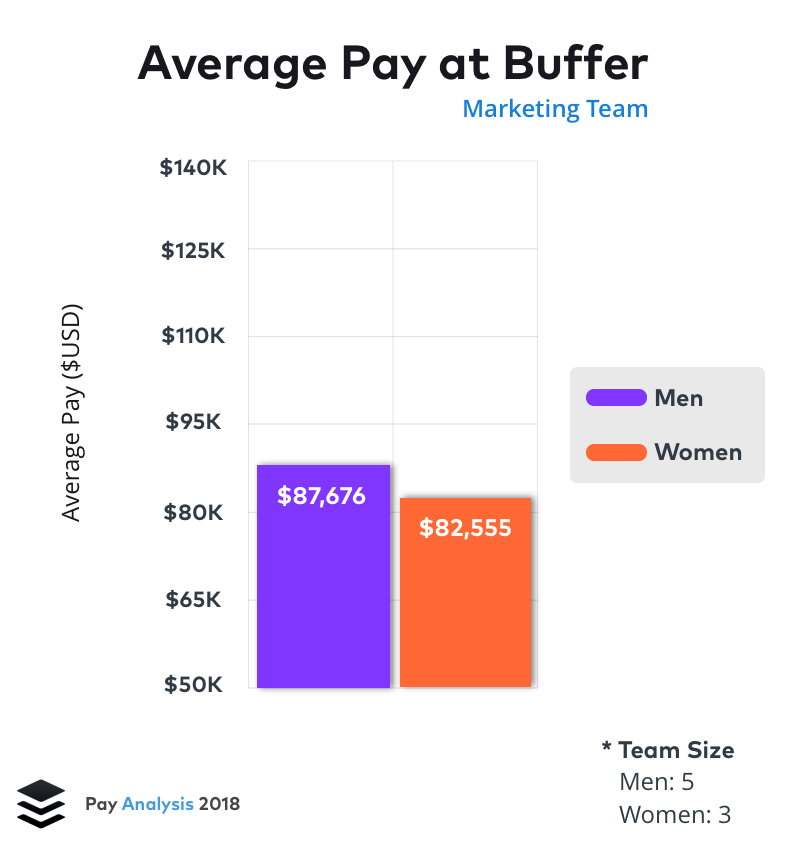
Marketing
Men: $87,676
Women: $82,555
Women earn 5.8% less than men.
A few teams weren’t represented here because they consist only of one gender. Our product and data teams consist of 12 men total and no women. Our finance and people teams consist of five women total and no men.
In the case of the marketing team and advocacy teams, where there is closer to an even split of men and women, the gap is much smaller. In advocacy’s case, the gap favors women. This is likely because we hired more women on the advocacy team early on and have several women in high experience levels on this team.
For the engineering team, the number has changed slightly because the product and data teams aren’t included in these calculations as they were when we looked at technical teammates.

How Does Location Impact Pay?
As we mentioned, there are several factors that go into our salary formula like location, experience, and even an old option to take more salary.
One of the more impactful factors in our salary formula is location. We take location into account to help our salaries remain competitive in cities where roles may be in high demand and cost of living is especially high.
There are three tiers of location multipliers: a low cost of living (0.75 is the multiplier), an average cost of living (0.85), and a high cost of living (1.0).
Notably, our distribution of men and women in high-cost-of-living areas is quite stark. Only one woman at Buffer works in a city with high cost of living. Nine men work in cities with high cost of living — almost 20% of the men at Buffer.
One of the common factors in adjusted pay analysis at other companies is the removal of location. With this in mind, here is what the average salaries would be if we controlled for location (assuming everyone has a location multiplier of one).
Men: $130,482
Women: $122,948
Women earn 5.7% less than men.
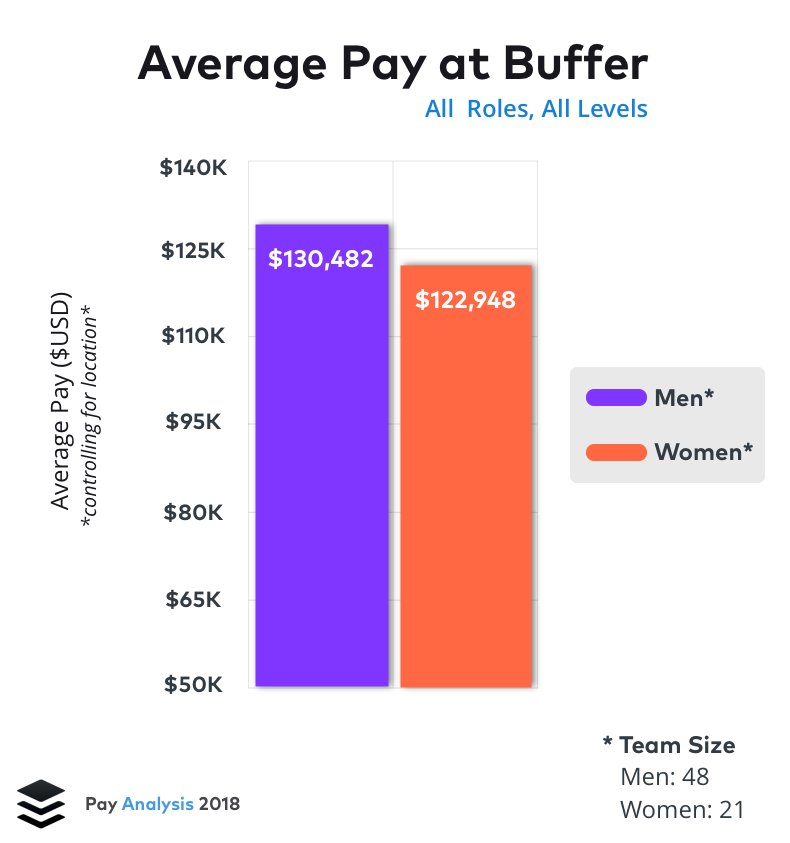
This has had the most impact on the numbers because the only remaining factor in our salary formula is role and experience level. We do still have more men in higher paying technical roles, which is why location doesn’t close the gap completely. In the next section, we’ll look at what we’re doing about that.

Why Do We Have an Unadjusted Pay Gap?
We are really grateful for the impact that our salary formula and salary transparency have had on our gender pay gap and the ability to confidently compensate men and women who do the same work equally.
Knowing this, it helps us approach the question of unadjusted pay gaps from a unique perspective. We’re fortunate that the way that we determine compensation for employees isn’t the reason we have an unadjusted pay gap. There are other factors.
Here are a few reasons we believe we’re seeing a pay gap and what we’re doing about them:
Diversity and Hiring
The main element that affects the pay gap at Buffer is the diversity of our team.
Many of our longest-tenured Buffer employees are men: of the 20 teammates who have been with Buffer the longest, 16 are men and four are women. In theory, this means that the men who started early at Buffer and who have stayed with us have had the opportunity to advance to higher experience levels and positions, not to mention they’ve been part of the earlier salary formula variables like salary-equity choice.
Another factor with diversity is that we have more men in higher-paying, technical roles. We have 30 men in technical roles and just three women.
One of the ways we’re excited to make an impact on diversity is through our hiring efforts in 2018. Last year, we hired very slowly; only one new person joined our team. Already this year, we’ve hired three new people, one of which is a woman in a technical role, the other two are non-technical roles. We have three more technical roles we’re hiring for at the moment.
We’ve refined our hiring process to be focused on finding diverse talent, and we believe that continuing to focus on diversity in our hiring process help enormously with the pay gap we’re seeing.
Experience and Promotions
One of the factors in our salary formula is a teammate’s experience level. In many cases, experience level can be a subjective choice; we’re making strides toward removing subjectivity by including more process with our promotions.
For example, in 2016 when we initially started these pay analyses, we didn’t have explicit frameworks for experience levels. We’ve since developed specific career frameworks so that anyone at Buffer can easily understand the level they are currently at and what they need to do to get to the next level.
Performance reviews are another element here. They aren’t included in our salary formula but they do influence promotions. We developed a consistent performance review process that is specifically designed to reduce bias and is overseen by our People team.
When it comes to promotions that affect one’s salary, we are creating “calibration” periods for these promotions to make sure timing doesn’t factor into any decisions. We did the first calibration in January 2018 and have two more periods planned for this year. This is a period in which the executive team gathers all salary change proposals together and discusses them at one time instead of throughout the year. Calibrations are designed to put salary change decisions in context and remove the isolation of single-area decisions.
This, combined with our new consistent review process for performance feedback, ensures that Buffer-wide, team members are having a consistent experience in terms of growth opportunities for merit-based salary increases, role changes or promotions.

The Case For Transparent Salaries and a Salary Formula
We wholeheartedly believe that transparent salaries do a massive amount of good, especially in the context of the gender pay gap. Having transparent salaries for us means that any teammate joining knows exactly what other people in their role make at Buffer and are guaranteed to be paid fairly for their work.
We believe that if transparent salaries were more widely adopted, it would help with a whole range of issues, equal pay included. And we aren’t alone in thinking transparency impacts organizations in a positive way, one study found that salary transparency “results in higher wages for workers after adjusting for profit and productivity levels and a range of other workplace and worker characteristics.”
If we considered what our gender pay gap would be without transparent salaries and a salary formula, we can almost guarantee it would be much larger. This is because employees would have less insight into what their counterparts in the same role make, and everyone would have to negotiate for higher pay, which isn’t always a strength for women and minorities.
Here are a few companies with transparent salaries that we admire, we hope to see this list continue to grow in the future. If there are any companies we missed, please comment with them below so we can check them out!
- SumAll
- WholeFoods (since 1986)

We’re committed to continuing to share our pay analysis every year and are excited to keep working hard to diversify our team and see the results improve our pay analysis each time. ❤
Resources
If you’re keen to learn more about the gender pay gap, here are some great resources for you:
- PayScale’s State of the Gender Pay Gap 2018
- Hired’s State of Wage Inequality 2018
- Guardian, The Difference Between Equal Pay and the Gender Pay Gap Video
- The UK’s Gender Pay Gap Database
Over to you
- Do you know the difference between what men and women make at your company?
- Did we miss any awesome companies with transparent pay?
Cover photo by rawpixel.com
Try Buffer for free
190,000+ creators, small businesses, and marketers use Buffer to grow their audiences every month.


