
The world of paid ads can sometimes feel a little overwhelming, especially if you’re new to the game and wondering where to even start.
Wouldn’t it be nice to find a nice and easy (and effective) way of dipping your toes in?
I’m only a few months removed from this post exploring paid ads as a total noob, which I remain, and I’ve done my very best since to be a sponge for all the paid ads experiments and strategies I can find.
We just so happened to come onto a neat one here at Buffer.
It’s simple and quick, powerful and effective, and I’d love to share it with you to get your thoughts.
—
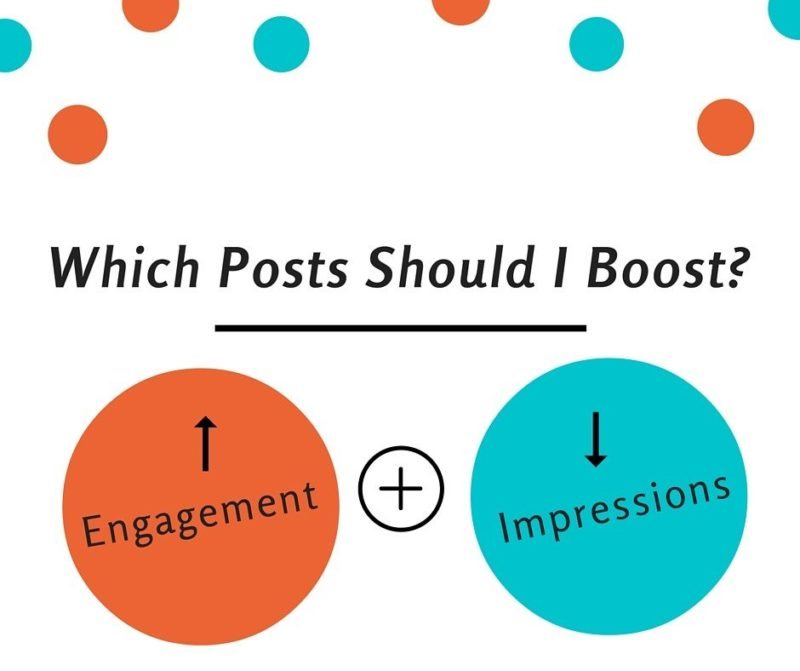
If you only have $5 to spend …
A simple tip for maxing your social ads
Details are below, fully written out with the complete strategy here. I thought I’d also add things into a quick video as sometimes it’s a bit easier to see someone step through things!
Here’s the gist …
- Log in to your social media stats at Twitter or Facebook.
- Check out your most recent day/week’s posts, looking specifically for impressions and engagement.
- Gawk in wonder at the ones with high engagement + low impressions.
- Boost those!
Here’s the complete detail
How to find the impressions and engagement data for your posts
On Facebook
One of the big challenges for marketers on Facebook is the question of reach: Where’s it all gone and how to get more? One of the nice benefits of this conundrum is that we all know — perhaps know too well in some cases! — where our reach currently stands.
Facebook makes it easy to see Reach.
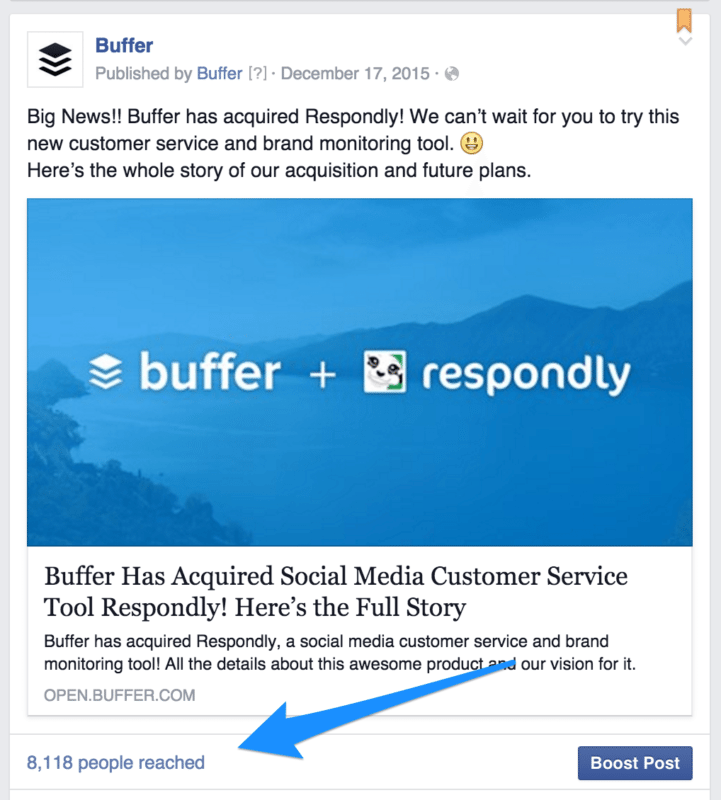
And Facebook Reach is the same as impressions.
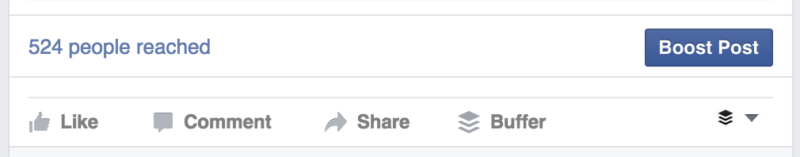
To get the engagement data on a particular post, you can click on the “xx people reached” link to see lots more data. After clicking, a popover will appear with all the vital stats from your post, including a total for engagement of likes, comments, and shares, as well as data on clicks. You can combine these two numbers (in the example below, it would be 23 plus 150) to get your total engagement.
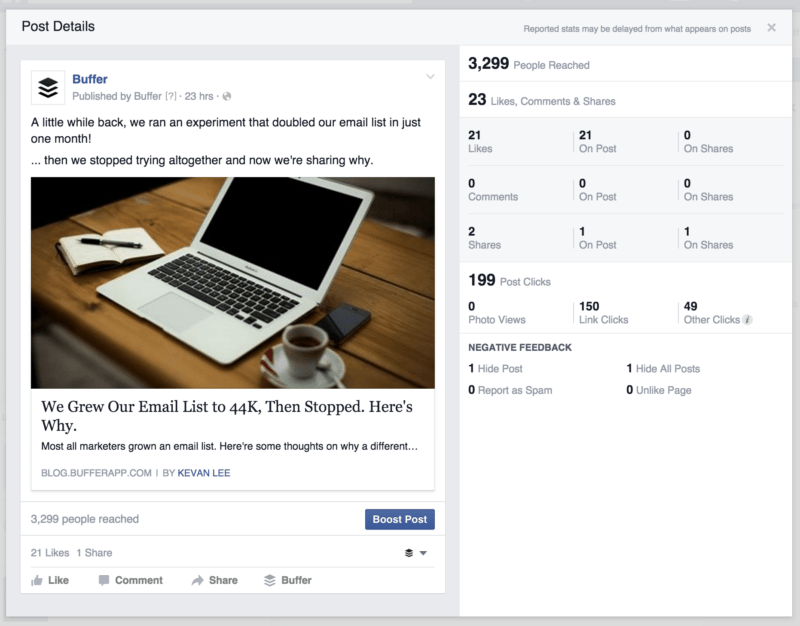
Then to calculate engagement-per-impression, take the total engagements and divide by the number of people reached.
In the example above, it would be 173/3,299, for a total of 5.2%. (Not bad!)
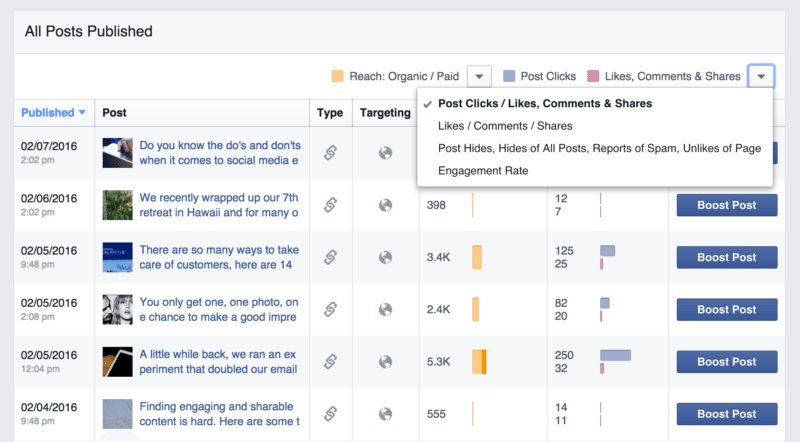
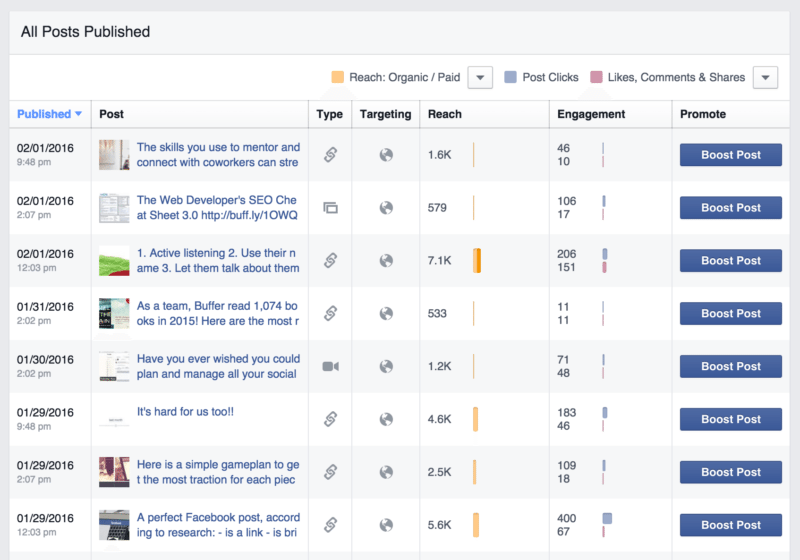
To check these per-post stats in bulk, you can navigate to your Facebook Insights at the top of the screen (available for all page admins). The Posts tab has all the data on each of your posts, and you can run some quick math or cast a quick eyeball to see which posts fall into the “low impression, high engagement” window.
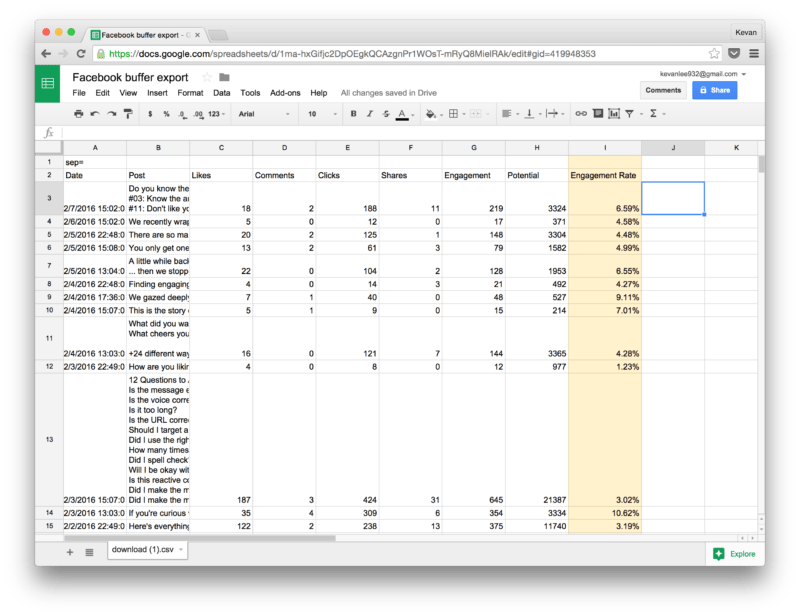
You can also get this data from an export and run the calculations through a spreadsheet.
For Buffer users, all this Facebook info is available automatically in your Buffer Analytics.
Free users can scroll through post history, looking at engagement stats and reach.
Business users can export all this data and calculate the engagement-per-impression rate with a simple formula:
(Here’s a sample spreadsheet.)
On Twitter
Twitter impression stats (a relatively new feature) appear in the Twitter Analytics section of the site. All users can access this for free by clicking on Analytics from the drop-down menu at top right.
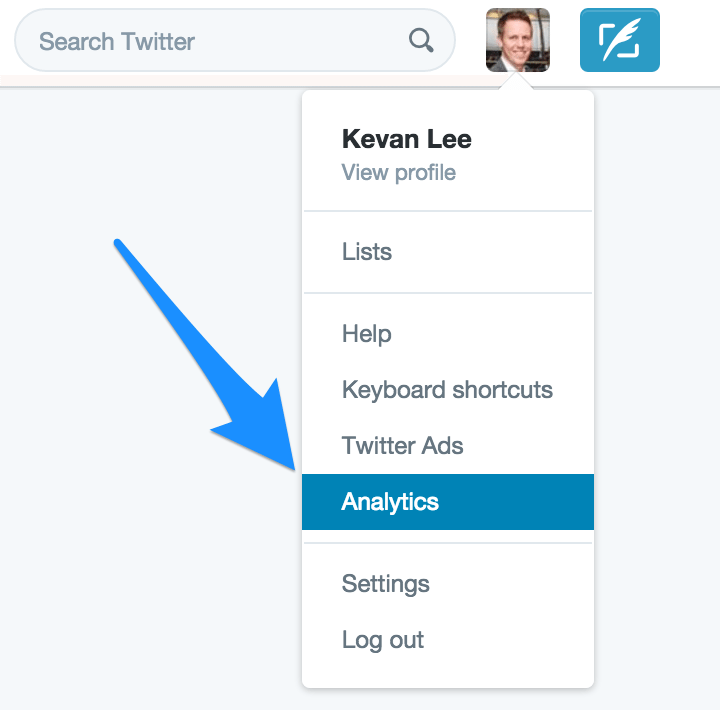
Once inside analytics, click over to the Tweets tab.

The Tweets tab shows all your recent tweets in a big long list, along with some quick stats beside each. Impressions live here, as well as an Engagement Rate, which Twitter calculates by dividing total engagement with impressions.
Voila! Just what we’re looking for!
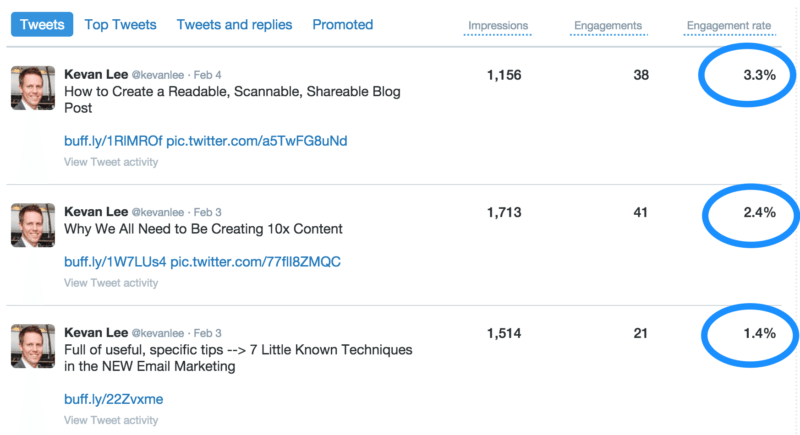
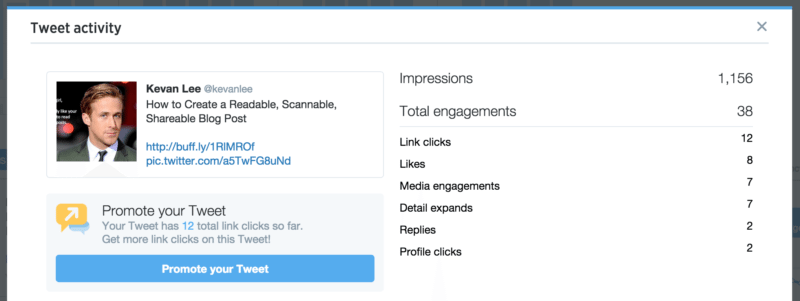
To dig a little deeper, you can click for details on any tweet to see the precise breakdown of engagements: how many clicks, retweets, likes, profile clicks, media plays, follows, and tons of other minutiae.
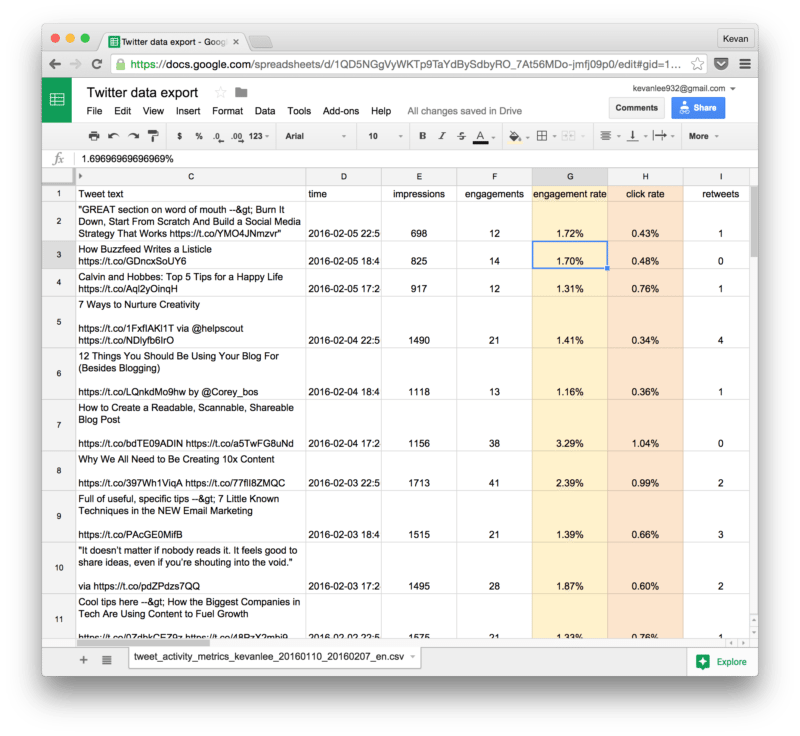
For a large-scale look at engagement and impressions, Twitter offers an export, which contains columns for each of these major stats.
Here’s an example export along with a simple calculation to find the best engagement-per-impression rate.
(I added a column in peach that calculates click rate, in case you’re particularly keen on click stats.)
Note: Twitter has thus far held its impression data pretty tight to its chest. We’d love to get this into your Buffer Analytics just as soon as we can!
How to boost a post on Facebook and Twitter
On Facebook
If you’ve ever visited your Facebook page when logged in as a page admin, you’ve likely seen how easy Facebook makes it to boost a post.
Scrolling through your feed, each post has a blue “Boost Post” button at the bottom.
When you click this button, you’ll see a popup that shows all the different settings for targeting, budget, timeframe, and more.
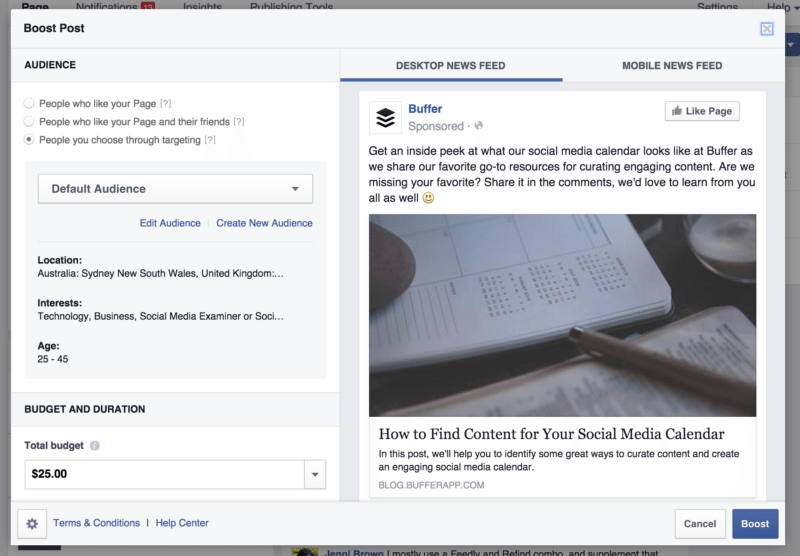
- Audience: Choose to boost the post to 1) your fans, 2) your fans and their friends, or 3) a custom audience or segment.
- Budget and duration: Choose how much you’d like to spend and how long to run the campaign
- Tracking conversions: To see purchases and signups on your site that started made from this ad, you can install a Facebook tracking pixel and select it from the list (more on tracking pixels here)
- Payment
You can also quickly boost a Facebook post from the Facebook Insights section, right from the default dashboard. All your recent posts are listed in a table, with a big blue Boost Post button to the right.
On Twitter
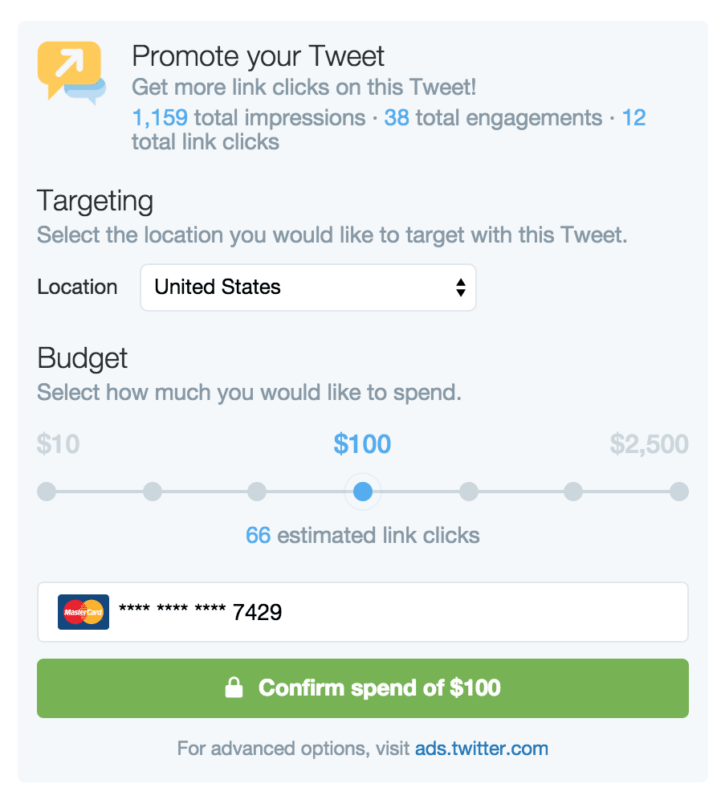
Twitter’s Promoted tweets options are available from within the analytics dashboards and not, like Facebook, shown on the updates in your timeline.
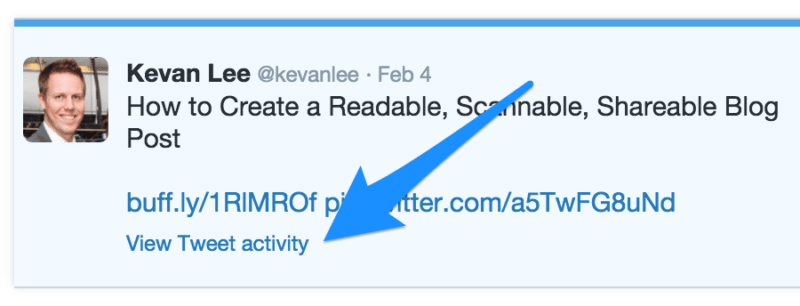
Once you’ve identified a tweet you’d like to promote, one that has high engagement and low views:
1. Click the “Tweet Activity” link underneath any update on the Tweet stats page
2. Click the blue “Promote your Tweet” button that appears in the left column.
From here, you can customize a handful of high-level settings for your tweet: Location targeting for your local area, country, or worldwide; and budget, along with an estimate of clicks you could expect to receive. (And then the payment info of course.)
Impressions: One of our favorite stats here at Buffer (and why)
One of the early lessons I learned on social media — and I learned it the hard way — was in making a distinction between followers and reach.
Followers (and fans) are all those folks who have clicked to like or follow your profile.
Reach is the number of folks who actually see an individual post that you share.
For example, at Buffer we have 47,000 likes on Facebook and our posts reach an average of 1,600 people. We reach 3.4% of our audience!
Knowing about this difference in fans vs. engagement, it’s made a big difference for me in the way that I analyze campaigns. Instead of comparing every result to the number of people who’ve liked or followed our profiles, the more accurate data is going to come from assessing a campaign based on how many people actually saw it.
We’re experimenting with ways to increase our reach, too. Here’re a couple of early thoughts:
- Get more followers! Sounds a bit counterintuitive in this context, right? The idea here would be that if we reach 1,600 people per post (3.4% of our fans), then we’d theoretically reach 3,400 people per post if we could get to 100,000 followers.
- Pay for reach. We’re looking to learn fast with paid ads on social, and we’ll love to pass along our takeaways!
- Encourage organic, viral boosts. We’d also love to find ways to make content that people will love to share with others: reshare on Facebook, retweet, repin, etc.
What if you’re not into total engagement?
The paid ads strategy we’ve outlined here is quite dependent on a certain performance stat: engagement.
And I recognize that not everyone might be into total engagement!
It’s completely fine to adjust this to whatever stats best suit your business and your goals. If clicks is most important to you, then perhaps clicks-per-impression could be a good route to try. If you’re hoping to build brand awareness and positive sentiment, then maybe likes or reshares matters more.
In general, the idea behind this ads process is a data-tracking, goal-setting method called Intriguing Metric. It sees metrics as fitting into one of four buckets:
- High traffic, low conversion
- Low traffic, high conversion
- High traffic, high conversion
- Low traffic, low conversion
The first two buckets are the ones where you’ll find the biggest opportunities for growth. Bucket No. 3 isn’t half bad either. Bucket No. 4 is best to be left alone.
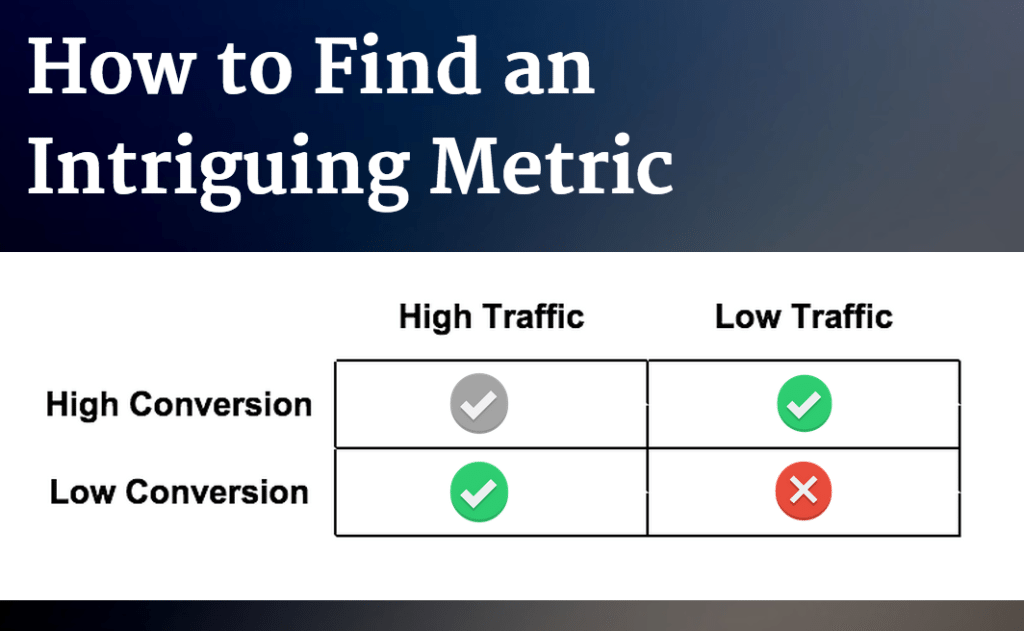
In the case of the particular ads strategy we’ve laid out here, engagement represents the high conversion square and impressions the low traffic square.
You can run through this matrix with anything — social ads or otherwise.
Would love to learn if you happen upon any neat metrics to chase!
Over to you
What have you been experiment with for your social advertising?
Does this method ring true for you? Anything you’d change or alter?
I’d love the chance to discover more here and to get any tips on ways we could improve. Excited to continue the conversation in the comments!
Try Buffer for free
200,000+ creators, small businesses, and marketers use Buffer to grow their audiences every month.