This is a guest post by Amar Zagorica from Helpjuice, makers of awesome knowledge base software. More about Amar at the bottom of the post.
We respond to 93% of our customer support emails within 5 minutes!
Caught your attention, right? That’s one of the beautiful things about knowing and promoting your company’s metrics, they grab attention and draw customers to you.
One of the best ways to accelerate your support and provide an exceptional customer experience is to understand what your customers want and need from your company. You don’t need to necessarily ask them straight out, tracking metrics gives an unbiased and honest representation of their overall experience and satisfaction.
“It’s like a cheat sheet!”
In parallel, you could be measuring your performance, to determine what is working and what needs improvement. For example, how many times you answer the same support email; If it’s too much, you might want to automate it using some kind of knowledge base/faq for customers.
You’re getting data on what your customers want and how well your support works and with so many online metrics tools available, you’re doing it with minimum effort and a great return on investment.
Above all, customer satisfaction is the most important metric your company needs to be aware of, everything else is secondary!
Applying Your Metrics to Customer Support
Like with any page on your website, performance metrics can provide great feedback on the support your customers are getting and what they’re demanding.
A good customer support metrics system is like a well planned brainstorming chart and detailed design/research before investing in an experimental design. It can save you time and money with future customer relations.
Your support metrics measure 3 main quality points; the customer experience, problem resolution and the call process/channel itself.
To start out with, we can use these contact points as a baseline measure for establishing metrics;

What are the customer support metrics you should track? Let’s start off with the obvious one: how long it takes to respond to an email/call
1. First Response Time
“84% response rate within 24 hours” – Sound familiar?
This first point is one that everyone is probably most familiar with. It’s simple, customers expect you to respond to their issues in a timely manner. And if we fail to meet expectations we’re likely to bring down our customer satisfaction considerably. The Buffer crew has realised that first hand.
Getting Back to You in 3…2…1…
Telephone
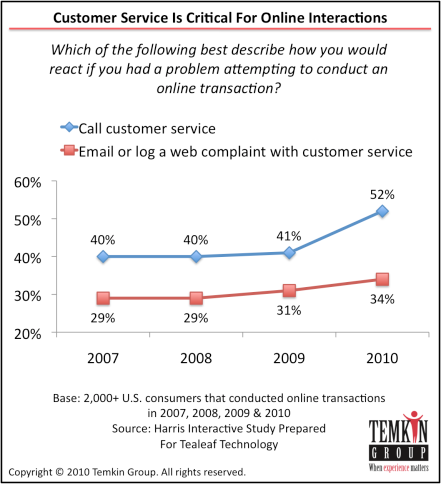
As noted in the graph above, support by telephone continues to be the most prefered means of support contact. This is primarily true because customers find telephone service more engaging and personal, and at times quicker. Studies show that roughly 53% of customers find 3 minutes to be a reasonable response time while waiting for a support agent.
Email support satisfaction is a little trickier to measure, simply because expectations are growing by the year. A couple years back, the rule of thumb was receiving an inquiry response within 24 to 48 hours. Many companies still go by this guideline, but as an online company you NEED to strive for more impressive times. As an example of Buffer’s response time, they are working with replying within 60 minutes. So it’s become quite clear that competitors have ramped up their expectations and promise a response of four to eight hours, or LESS.
Studies indicate that customers believe up to 24 hours is reasonable for an email response. However, a quicker response is a good way to stand out from competition and prove to customers that you value their business.
50 percent of consumers give a brand only one week to respond to a question before they stop doing business with them. ~ Oracle study
What we’ve found at HelpJuice from tracking our own data is that timeliness and speed we see a direct correlation with satisfaction!
2. Problem Resolution Time
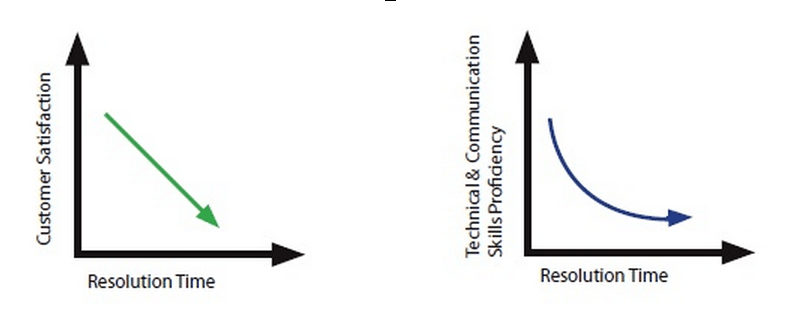
The following is probably going to sound slightly counter intuitive: companies that provide rapid and accurate fixes to issues have far higher customer satisfaction ratings than companies that do not pose any issues for their customers, at all. These findings demonstrate how highly customers are influenced by a company’s problem resolution time and your commitment to them.
Your Customer Satisfaction is Dropping by the Second!

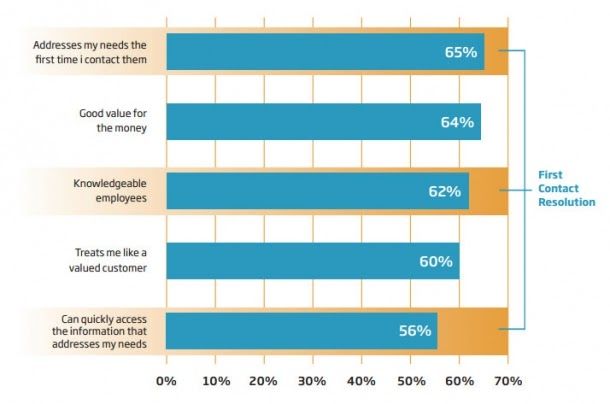
Research shows 62% of correspondents think that having knowledgeable employees is the third most important aspect needed, for a company to provide good customer service. (Conversocial)
Here is something we’ve learned very early on: Speed is a single variable you need to factor in, but do not pat yourself on the back for answering questions within 1 minute if you’re not doing it efficiently.
Instead, we try to ask ourselves: How many interactions between the customer and company staff are necessary to resolve the issue?
The best answer is… 0, if you can avoid issues, but realistically it’s 1. If it takes five interactions, on average, in order to solve an issue, it could mean that the customer is not being put in touch with the right individual to solve the problem. This is wasting the customers time and your company’s time.
3. Was the Customer Able to Find What They Were Looking For?
55% of customer commit to a company because of the ability to easily find the information or help they need.
A key question we’ve learnt to always ask is this: why is it that a customer contacted you in the first place? Because they had a problem and you’re the one with the solution.
Keeping track of whether or not a proposed solution was helpful is very important for future issue resolutions. If a representative was not able to assist a customer now, how could they assist someone with the same problem later on?
No matter how much money you pour into your support team and resources, it all gets cancelled out if you’re not efficiently taking advantage of it.
Support metrics allow you to monitor whether a customer was successfully able to solve an issue either by phone or your knowledge base. Monitoring time spent on each online article you offer tells you whether or not it was actually helpful. If a customers views and article for 10 seconds, you know something is wrong and they weren’t able to find a helpful solution.
Of course, Social Media!
I bet you love tracking all of your customer complaints through social media, right? Well we do, especially when we’re trying to keep track of how helpful your proposed solutions are.
The simplest way to track your issues is to ask about them. Asking your followers for feedback about certain weak areas you’ve detected is a great way to figure out which areas you can improve in and which channels need more attention. When it comes to online interaction, customers certainly aren’t shy about letting their opinions be known, all you have to do is listen and provide them with a means of expressing themselves.
Build a community, connect your customers with each other
Not something you see very often, is it? That’s the beauty of social media, it allows customers to connect with one another. Your customers can be your support team if you let them answer the questions of other users. Not only are you not paying them, you’re beefing up your support team without putting in any additional work yourself.
Since problems are common with many online businesses, chances are someone else has had the same problem your customer is experiencing now. First hand experience with problems is often times the best way to come up with a solution.
4. Overall Customer Experience Rating
86% of consumers will pay more for a better customer experience.
One of the most important feedback points we’ve discovered is how a customer would rate the overall customer experience.
What to Look for in Your Rating
- Measure the overall customer experience through relationship and transactional surveys to get a prioritized sense of what customers’ value most
- Understand the loyalty a customer has towards your company and the strength of your relationship – Wufoo called this the “marriage vs. relationship” moment. If you are on the first date (the first customer exchange), you need to behave differently then if you are married for a few years (loyal user for several months).
- Identify the most powerful experience opportunities for improvement at every interaction point
Customer experience and loyalty are important determinants in your hopes of business growth. Companies who have mastered the ability to manage the experience are capitalizing on a powerful marketing tool, simply because customers are more likely to believe what they experience and feel rather than what they read in an advertisement.
The Key to Improving Customer Experience Ratings
65% of Customer Want Their Problem Resolved the First Time
What we’ve found is quite simple and also obvious: the ultimate support goal is to have a customer’s issue resolved in one phone call/email. Generally, if a customer or company must continue to make phone calls to get the issue resolved, the customer’s satisfaction decreases.
First contact resolution
How many issues are resolved upon initial engagement? We’ve found that increasing this metric is a key factor as to whether your customer happiness rises over time:

Happy customers tell 3 friends – Unhappy customers tell GOOGLE
There is a high degree of correlation between customers’ experiences and how likely they are to recommend a company and consider purchasing more products and services from that company in the future.
Keeping your customer experience rating high not only saves you from losing a single customer, it saves you the bad rep you get from word of mouth. Information is quickly passed on and bad support rumors are spread quickly. Get on top of your customer happiness and you’ll be bringing in new customers through referals.
5. Contact Volume by Channel
The last crucial area that we’ve found to increase customer happiness greatly is to pay attention to volumes of calls and inquiries you receive. Stepping back and checking for any spikes that many indicate a rush of support traffic at certain times of the day. This is a great indicator of when you should be devoting the most amount of service employees and resources to be on hold and waiting for customer interaction.
Having an appropriate buffer allows you to account for any unpredicted support demands and ensures you are staying on top of issue resolution.
This is one of the more custom metrics you should be monitoring. Each company has business hours at various times of the day and their customers run on very different time schedules, especially when you’re operating an online business.
“Best Time to Reach Me”
Customers tend to have a general idea of when they can call you and get ahold of a representative immediately. The rule of thumb is that the best times to call are early in the morning (8am-9am) and late in the day, before close (4pm-5pm)
Is that the case for you?
Most times the answer is no… A customer calls immediately after a problem arises because they need immediate attention.
Pay close attention to the most-frequently-called times, and prepare for it. You can’t impress, unless you prepare.
Tracking the frequency of each channel gives you an idea of what YOUR customers prefer most and what kind of questions they’re asking.
If you’re tracking the number of repetitive support emails (i.e emails that come in with more or less the same question) you get an idea of how useful and cost effective it would be to implement a knowledge base and if it’s worth the cost.
Here is another list of “mini-metrics” that we try to track internally as much as we can, which gives us a great outlook as to how well we are doing:
- How easily was the customer able to access the information they were looking for
- How easy was the knowledge base/support page to navigate
- How helpful was the answer/Does it meet expectations
- Does the support page have relevant information
- Look at self-service page views to determine whether they are helpful
Over to you!
What are some additional points you would add for measuring customer support metrics? Does your company have all of these metrics calculated, or plans on integrating a system to do so?
I hope you enjoyed the post and found it helpful, I’ll see you in the comments with some feedback!
About the author:

This is a guest post by Amar Zagorica from Helpjuice, makers of awesome knowledge base software.
He writes gives more awesome insights about customer happiness at the Helpjuice customer support blog. Be sure to say hello, Amar is a super nice guy.
Try Buffer for free
190,000+ creators, small businesses, and marketers use Buffer to grow their audiences every month.
