
How do the best-performing Facebook pages get all that amazing engagement?
And how can you and I do the same?
The Facebook pages that are doing wonderfully well with likes, shares, and comments on their posts have so much to teach about new tactics and worthwhile strategies. Our friends at BuzzSumo analyzed 500 million (!) of these Facebook posts, and we’ve learned some amazing takeaways that you can implement on your page today.
(I’ll be joining BuzzSumo’s Steve to chat with you live about this great research! I’d love to invite you to join us this Thursday.)
I’m excited to share with you what we found and the great new tests to try in order to boost engagement on Facebook!
tl;dr – Introduction and Takeaways
We had the absolute privilege to work with the BuzzSumo team on gleaning insights from 500 million Facebook posts from over 3 million Facebook pages worldwide, collected over the past eight months. It’s been one of the biggest Facebook research studies to date, and we’re really excited to have learned (and to be able to share) our takeaways from the data.
A couple of notes beforehand:
- With a dataset of this size, there’s a fair bit of figuring out to do when it comes to the many ways to analyze the data. We were able to collect average interactions per post for a great deal of different categories and post types, though even still — given the wide variety of pages in this study — we aren’t 100% confident that those averages are meaningful. Large, popular pages with enormous reach can tend to influence the data strongly.
- Whenever possible, we chose to share the “most popular” findings rather than the “best” findings, choosing volume and popularity over interactions and engagement.
In terms of the specifics, here are some of the data findings from the study that I’ll be happy to go into more detail with further below:
- The most popular time of day to post is the late morning and lunch hour.
- The least popular time to post is late evening and into the night.
- Tuesday and Wednesday are the most popular days.
- Sunday and Saturday are the least popular.
- We found 7 popular post types: Photos (with no link), Question Posts, Video, Giveaway Posts, Links (with or without image), Coupons/Promotions
- The seven types of questions to ask: What, Why, Who, When, Which, Would, How
- The most popular ways to post to Facebook are through Facebook itself, Hootsuite, Instagram, Twitter, and Buffer
Note: When we use the word “engagement”, it means likes + shares +comments. We’ve not included clicks in this metric since some of the updates here did not have links.
1. Test a new strategy around the most (and least) popular times of day to post
One of the first places we looked for insights into the Facebook data was noticing when these 500 million updates were published.
As you might expect, the majority of posts are published during the workday, and far fewer — up to 1/3 fewer updates — into the late evening and late into the night.
The most popular time to post is between 10:00 a.m. and 1:00 p.m. Eastern.
The least popular time to post is between 11:00 p.m. and 2:00 a.m. Eastern.
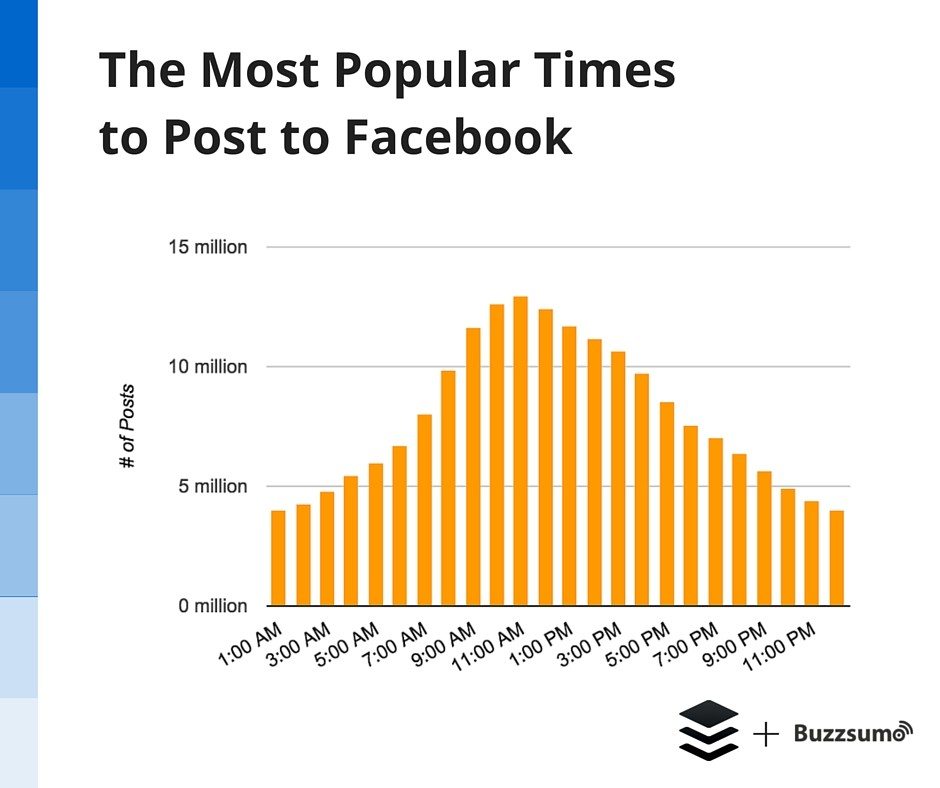
Here’s the complete breakdown of posting volume at different times of the day:
- 1:00 a.m.: 3,992,938 posts
- 2:00 a.m.: 4,252,584
- 3:00 a.m.: 4,793,412
- 4:00 a.m.: 5,467,362
- 5:00 a.m.: 6,016,886
- 6:00 a.m.: 6,705,801
- 7:00 a.m.: 8,057,272
- 8:00 a.m.: 9,867,708
- 9:00 a.m.: 11,626,048
- 10:00 a.m.: 12,649,227
- 11:00 a.m.: 12,991,817
- 12:00 p.m.: 12,440,312
- 1:00 p.m.: 11,680,244
- 2:00 p.m.: 11,200,169
- 3:00 p.m.: 10,673,145
- 4:00 p.m.: 9,711,319
- 5:00 p.m.: 8,533,286
- 6:00 p.m.: 7,561,044
- 7:00 p.m.: 7,050,473
- 8:00 p.m.: 6,405,524
- 9:00 p.m.: 5,682,640
- 10:00 p.m.: 4,939,076
- 11:00 p.m.: 4,387,240
- 12:00 a.m.: 4,011,171
Some possible takeaways
There are many different directions you might go with looking at this data — many different perspectives even among your teammates. We found that my interpretation differed quite a bit from our co-founder Leo’s.
When I look at this data, I see a huge opportunity for added engagement by posting when no one else is posting — the Late Night Infomercial effect where your post might thrive with less competition.
Posting when there’s less competition seems to me that it would help surface your post in the News Feed of more people. And from what I know about the Facebook News Feed algorithm, one factor for virality and reach is getting likes and shares on your content. The more likes and shares you might get during the night, perhaps the better head start you’ll get on News Feed content during the day.
Leo’s take was the opposite. He saw the most popular times to post and made a great inference that those times are likely also to be the times when the greatest number of people are actively engaged with Facebook.
Popular times equal large audience.
Both paths are wonderful options, made all the better in that they’re based on some great data here.
If you truly want to test the Late-Night Informercial effect, you can look at the numbers here and see when exactly is post volume at its lowest: 1:00 a.m. Eastern (and then schedule your post in Buffer, so you don’t have to stay up all night.)
If you’re interested in trying your posts when the audience is largest, you can check the data and see that 11:00 a.m. Eastern is the most popular time.
A couple further clarifications
1. We did look at the average engagement per post sent at each time and found there to be a strong rise toward the end of evening with a peak from 10:00 p.m. to 11:00 p.m. Eastern. We’re excited to dig into this data further as right now we feel it might not quite account for the varying reach numbers of the pages in this study – i.e., if posting volume is lower in the late evenings and a majorly popular Facebook page like Business Insider posts then, it’s quite possible that engagement could be inflated as a result.
2. The times listed here are in Eastern time, though it’s possible that the posting volume generally follows the same pattern for most any time zone. Eastern time figures to appear here as that’s where a large number of these Facebook pages exist.
When we generalized a subset of this data to look into posts sent just from French Facebook pages, we found that the numbers in this small subset matched those in the Eastern time zone.
So if you find yourself several hours removed from Eastern time, it could be great to test not only a schedule that fits with an Eastern time audience but also one that assumes your local posting volume would match the data here.
2. Which day of the week is most (and least) popular?
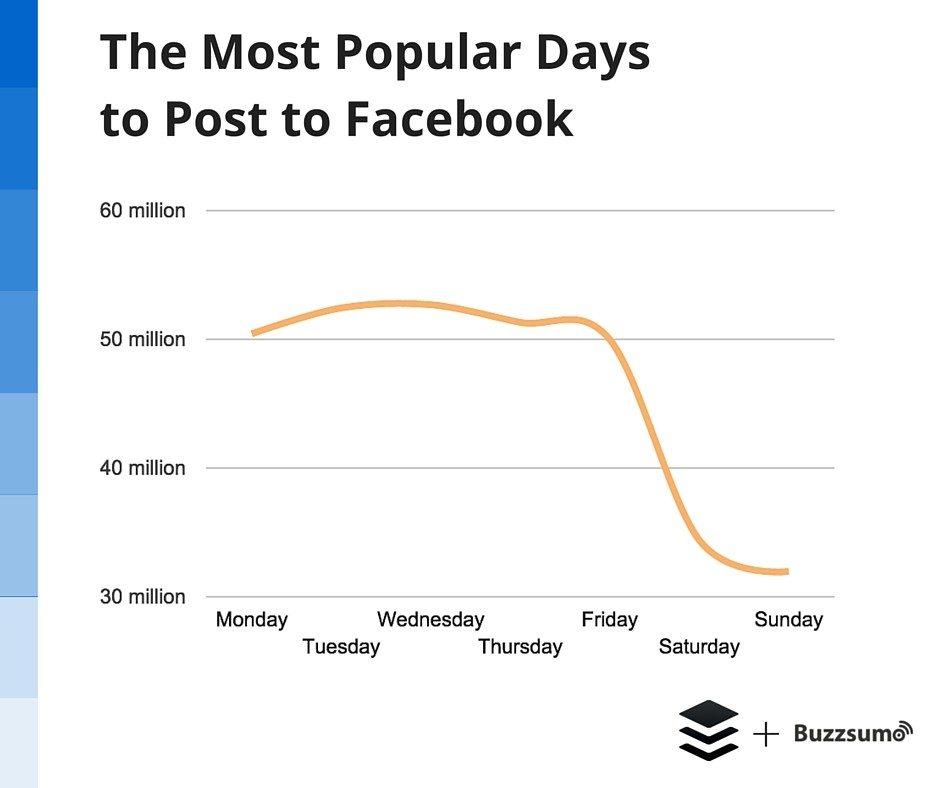
The next layer of the most popular time to post is looking a bit broader at the most popular day.
As you might expect, the vast majority of updates are sent during weekdays.
Tuesday and Wednesday are the most popular days of the week.
Saturday and Sunday are least popular, with about 40 percent fewer updates being published.
Some possible takeaways
Again, similarly to the above takeaways for the most popular time of day to post, when it comes to the most popular day of the week there could be a couple different directions here as well:
Experiment with posting on the most popular days (Tuesday and Wednesday), when you might assume the most people are online to see your update.
Experiment with posting on the least popular days (Saturday and Sunday), assuming there’s less competition and a greater chance to shine on those days.
You could even combine the two data sets to see the ultimate most popular time to post: 11:00 a.m. on Wednesday.
Same for the ultimate least popular time: 10:00 p.m. on Sunday.
A couple further clarifications
As with the time of day stats, we did notice that average engagement was highest on the days when post volume was lowest. We imagine there could be many different explanations for this, including the weighted influence of popular pages that publish during these non-peak hours.
3. Ideas on what type of Facebook post to try next
You can share a lot of amazing content on Facebook in a lot of amazing ways. And these different post types — text updates, video, images, links, etc. — may impact the amount of engagement you can expect to receive on an update.
Looking through the 500 million posts in our study, a few main categories emerged of different post types on Facebook. In our study, the most popular categories we saw were:
- Photos (with no link)
- Question Posts
- Videos
- Giveaway Posts
- Links (with or without image)
- Coupons/Promotions
Some possible takeaways
When I see this list, my mind already starts spinning.
How many of these post types do you have in your Facebook strategy?
I often end up bundling multiple categories here together. For instance, I’ll share a photo with a link and I’ll ask a question in the update text. That’s three post types in one!
What we found in the study is that people had success posting from each of these different types. It might be worth testing and experimenting to see which type does well for you and your page or seeing what’s possible and available for mixing up your main posts.
A couple further clarifications
In thinking about the Facebook News Feed algorithm, we’ve noticed that visual content has been a big winner when it comes to getting more reach. Looking at the results from our study here, we see that visual content is indeed some of the most-engaged content, along with questions.
What this data doesn’t quite tell us is the effect that popular pages might have on the types of content here. If, for instance, CNN is sharing super high-quality photos and videos with its big audience, you might expect to see the interaction numbers being high for photos and videos. And if lower-quality pages are sharing lots of coupons/giveaways, you might expect interactions to be low there.
4. The 7 Different Ways to Ask a Question on Facebook
Question posts were one of the more frequent post types we noticed in this study, and many seemed to do quite well (our early data suggested that they might be the most popular post type for pages).
Breaking down the questions even further, we found there to be seven main ways being used to ask questions in Facebook posts.
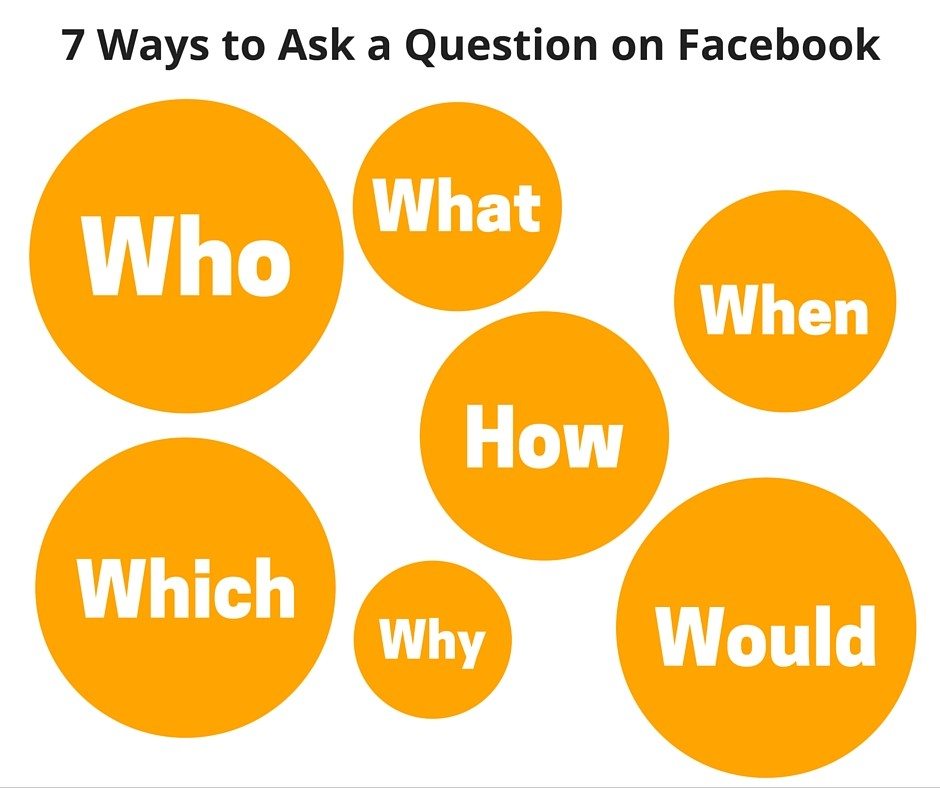
- What
- Why
- Who
- When
- Which
- Would
- How
Some possible takeaways
The list here reminds me of the Power Words we often reference when thinking about ways to craft our social media posts. The specific words you use — even when it comes to a quite general one like a question opener — can make a big difference in capturing the reader’s attention.
Secondly, a thought comes to mind here that one reason in favor of questions like “who” and “which” and “would” is they are simple questions that are easy to answer (often with a multiple choice or yes/no), and they also help strengthen the identity of the person commenting on the question—a key element of the psychology of sharing to Facebook.
5. Could a longer or shorter update work for you?
Seeing that Facebook’s character limit per post (reported to be as high as 60,000 characters) leaves tons of room for experimentation, we were eager to explore what length of posts tended to be most commonly used.
We ended up with seven different buckets of character counts:
- 0-50 characters
- 50-100
- 100-150
- 150-200
- 200-250
- 250-300
- 300+
Some possible takeaways
In thinking about potential action steps here, I find it interesting to note where these buckets fall. I’m sometimes tempted to either go really long or really short with my Facebook posts – either multiple paragraphs or a short-and-sweet update. What I’m seeing here is that most Facebook pages tend to experiment on the lower end of the spectrum, 300 characters or fewer.
What does a 300-character post look like? Here’s one from Brain Pickings that comes in near 275 characters (another line of text would have likely made it 300).
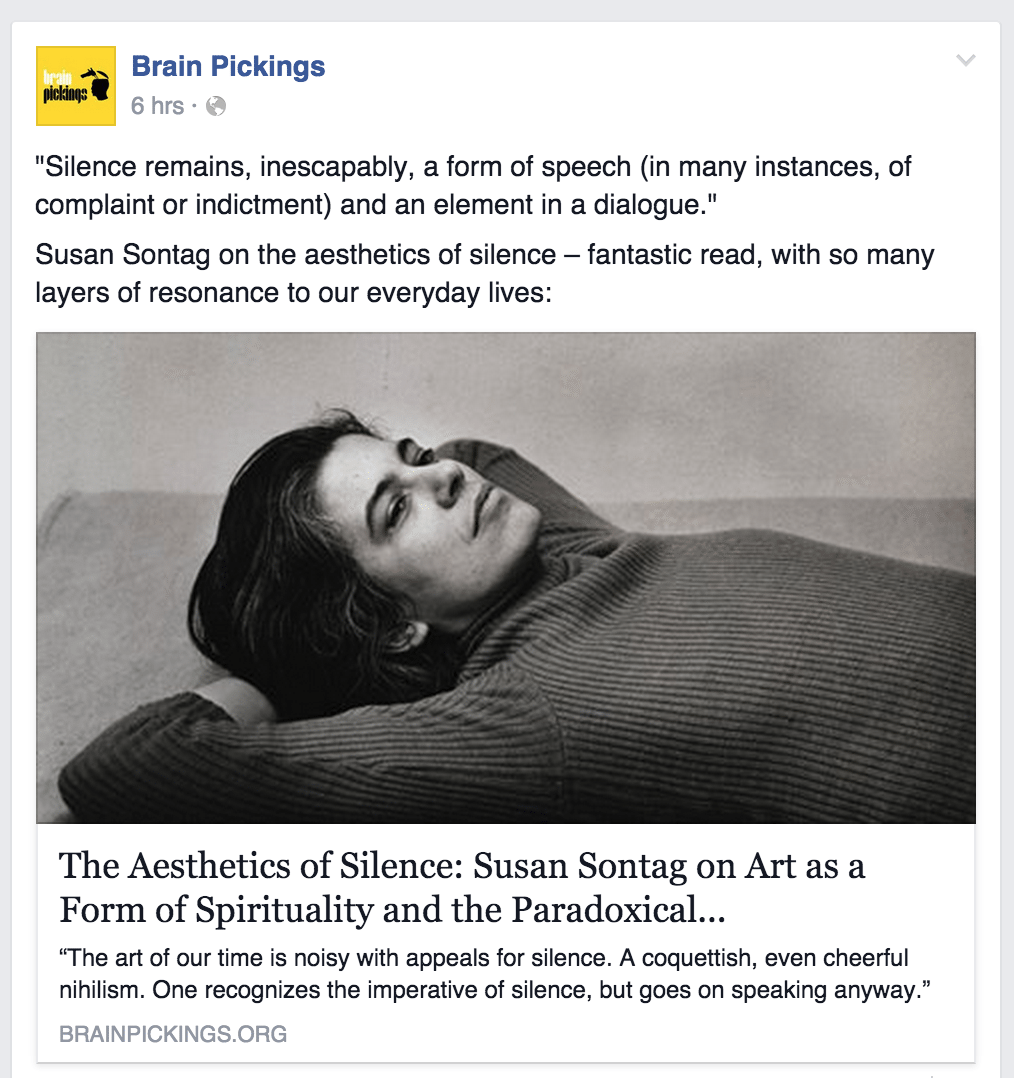
Thinking of this another way, could it be better to write shorter Facebook posts that fit with the majority of content being published by other pages?
Or might it be worthwhile to experiment with longer posts that are a bit less common?
6. The most popular tools people use to post to Facebook
One of the really interesting bits of data we were able to pull from our study was the applications used to post to Facebook (e.g., Hootsuite, Buffer). Here were the top 20 applications used to post to Facebook, ordered based on market share:
- No application: 75.64%
- Hootsuite: 5.12%
- Instagram: 3.14%
- Twitter: 2.74%
- Buffer: 1.31%
- WordPress: 1.08%
- dlvr.it: 0.9%
- Pages Manager for iOS: 0.88%
- Sprout Social: 0.77%
- Facebook for iPhone: 0.72%
- Photos: 0.66%
- Links: 0.65%
- IFTTT: 0.56%
- twitterfeed: 0.55%
- RSS Graffiti: 0.44%
- NetworkedBlogs: 0.38%
- Facebook for Android: 0.37%
- SocialFlow: 0.33%
- Pages Manager for Android: 0.31%
- Share_bookmarklet: 0.29%
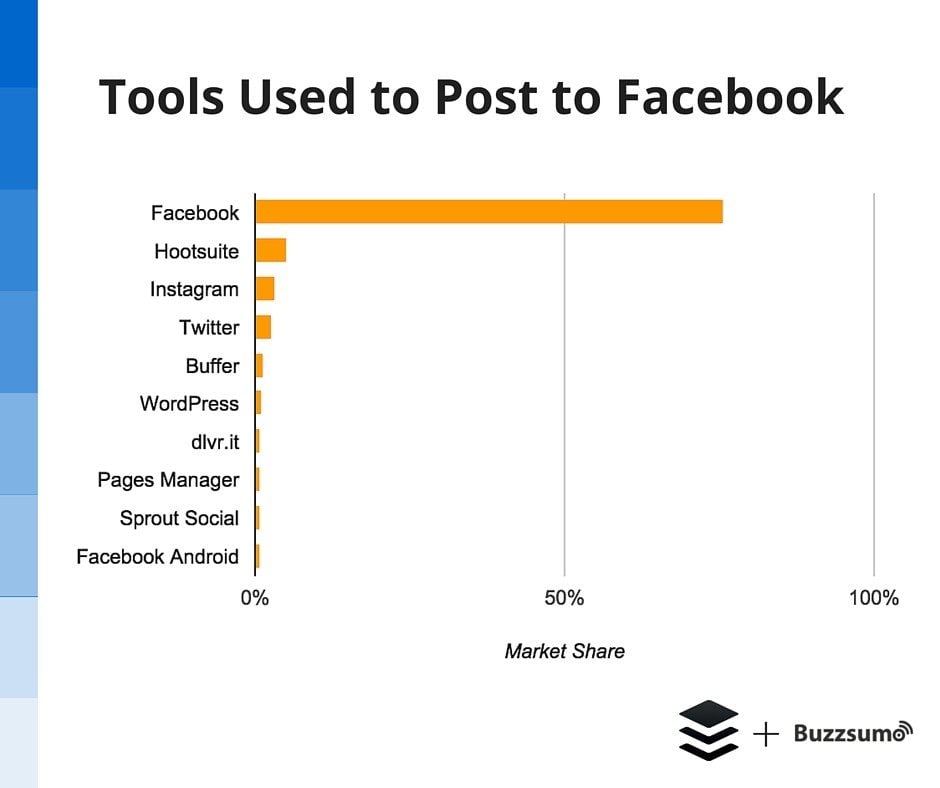
Far and away, the most popular way to post to a Facebook page is with Facebook.
A couple further clarifications
One thing that this data does not account for is the impact of popular pages on these numbers. In looking at such a big dataset, we ended up reviewing both enterprise businesses and small businesses, each of which has its own engagement levels and own tools it uses.
For instance, here were the top applications used by individuals/small businesses, ranked by engagement.
- Post Planner: 921.8 average engagement
- Buffer: 180.67 average engagement
- Sprout Social: 166.28 average engagement
- Edgar: 83.53 average engagement
- Hootsuite: 78.45 average engagement
- CoSchedule: 75.53 average engagement
Here were the top applications used by enterprises (bigger pages, more reach), ranked by engagement:
- Adobe Social: 1420 average engagement
- Spredfast: 1270.89 average engagement
- Sprinklr: 991.26 average engagement
- SocialFlow: 881.11 average engagement
Overall, posts that did not use an application averaged 216.766 average engagement, while posts that did use an application averaged 113.88 average engagement. (Buffer posts had an average engagement of 180.67).
Does this mean that you should rush out and get Adobe Social? It’s a great product, for sure; my hunch here is that the engagement numbers are so large because the tool serves some really big pages with lots of reach.
7. How to think about the articles you link to
One additional tidbit we were able to pull from the data here was looking at the articles people clicked to read. Did linking to longer articles or shorter articles lead to more interactions on a Facebook update?
Sounds like a fantastic test to try. ?
In our study, we noticed four lengths of blog posts that were linked to most often:
- 0-1000 words
- 1000-2000 words
- 2000-3000 words
- 3000-10000 words
(For reference, the article you’re reading here is about 2,500 words long.)
The early data seems to suggest that longform content gets the best shares on Facebook, though we’d love to examine that a bit more before making any confident assertions.
For the time being, this feels like a great one to test and experiment with for your own page, noticing the effect on likes, shares, and comments when you send folks to short-form versus longform articles.
Even more: Further tools and talks
We’d love to share even more about this data and research and to make it really easy for you to start experimenting right away with some Facebook strategies.
We’re hosting a webinar with the BuzzSumo team this Thursday at 11:30 a.m. Eastern!
I’ll be sharing some further info about the study as well as answering any questions you might have. It’d be a fantastic privilege to have you join! (We’ll make the full replay available also if you RSVP and can’t make it.)

Check out out our complete guide to the Facebook News Feed, including all the available information (up-to-the-minute) on how the algorithm works.
Try out BuzzSumo’s brand new Facebook insight tool, SumoRank. Enter any Facebook page (yours or others’) and see data on their Facebook rank and content engagement.
Over to you
I’d love your thoughts and input on this research.
What findings stood out to you?
What did you learn here that might shape your upcoming strategies and experiments?
I’ll be hanging out in the comments, eager to hear from you!
Image sources: IconFinder, Pablo, Pexels
Try Buffer for free
180,000+ creators, small businesses, and marketers use Buffer to grow their audiences every month.
Related Articles

In this article, Nupur Mittal shares insights into four research methods that help her find content ideas and identify unique takeaways.

Facebook marketing in 2019 isn’t dead. On the contrary, it’s far from it. Now removed from the dim outlook that businesses faced at the beginning of 2018, Facebook has and will remain an essential tool for brands’ marketing strategies moving forward. In our big State of Social Media 2019 Report, we found that 93.7 percent of businesses use and are currently active on Facebook — the most among any other social media network. And although we continue to see a dramatic rise in the usage