
LinkedIn Analytics: Key Metrics to Track to Boost Your Growth
An overview of how to use LinkedIn analytics to build brand awareness, grow your following, and shape your LinkedIn marketing strategy.

Social Media Manager
LinkedIn has evolved beyond a simple job and networking website to become a bustling social media platform. In fact, Microsoft revealed LinkedIn saw “record levels in engagement” in 2024, with the platform becoming a more and more popular choice for creators and brands looking to grow their audiences.
If you’ve scrolled through your LinkedIn feed recently, you've probably seen some interesting discourse about work but also a variety of other topics, broadening the scope of the platform. Still, LinkedIn’s unique focus on career growth makes it a brilliant place to boost the reach of your business and your personal brand as a professional by creating content.
That said, as the platform becomes more and more crowded, creating content that stands out is becoming tougher — which is where LinkedIn analytics come in.
There's no better way to understand what kind of content resonates the most with your target audience, and in turn, what to create more of (or less of) in the hope of growing your LinkedIn following.
In this article, we'll explore how to uncover this essential data in LinkedIn analytics and which important LinkedIn metrics you should be paying the most attention to.
Here’s an overview of how to use LinkedIn analytics to build brand awareness, grow your following, and shape your LinkedIn marketing strategy.
What are LinkedIn analytics?
LinkedIn analytics are native social media metrics that you can use to better understand how your page and content are performing. LinkedIn analytics include engagement rates on your posts, information about your followers, data on who visits your page, and a whole lot more.
It's important to note that there are two different types of LinkedIn analytics, and what you have available to you will depend on the kind of profile you have: a LinkedIn page or a LinkedIn personal profile.
LinkedIn is a little different from platforms like Instagram in that you can't really pick and choose what kind of account you want, depending on your needs. People have LinkedIn Profiles, while businesses have LinkedIn Pages.
If you're a business owner or a marketer managing a business page, you'll have access to both the page LinkedIn analytics and personal profile analytics within a single account. LinkedIn personal accounts are tied to brand accounts in the same way that Facebook pages are. In other words, no need to log in and out to toggle between them.
If you don't manage a business page, you'll have access to LinkedIn's analytics tools for personal profiles (which is all you'll need). Previously, you'd have had to turn on LinkedIn Creator Mode in order to activate these and a few more features. Now, the platform has phased this mode out and made creator features available to all personal profiles.
Why LinkedIn analytics matter
Tracking LinkedIn analytics is essential to building an effective content strategy and ensuring you’re getting the most out of the social media site.
If you don’t monitor these LinkedIn metrics closely, you’re doing yourself and your personal brand-building or marketing efforts a massive disservice. Flying by the seat of your pants might have worked on LinkedIn several years back when only a handful of brands and creators were leveraging the platform, but now you need to get strategic about the platform if you want your hard work to pay off.
By understanding your post and page performance — and who exactly your primary audience is — you can create content that your audience loves. The more your content resonates with them, the more they'll engage with it (comment, like, or reshare it to their own network).
Engagement like this is a strong signal to the LinkedIn algorithm that your content is valuable, and it increases your chances of appearing in the LinkedIn feed of non-followers.
The greater your reach, the faster your following will grow, and hopefully, more opportunities will come your way on LinkedIn — whether that is more customers for your business or exciting new job offers.
Using native LinkedIn analytics (or LinkedIn analytics tools) is the best way to figure out what content is working and boost your efficiency on the platform. I'll explain exactly how to do this below.
LinkedIn Page analytics
On your LinkedIn analytics dashboard for your business page, you'll find detailed metrics on:
- Content
- Visitors
- Followers
- Leads
- Newsletters
- Competitors
- Employee Advocacy
While all of these metrics can be useful, it can be pretty overwhelming to track all of these numbers all the time — which is why I’ll highlight the three most important ones below.
How to access LinkedIn Page analytics
Before we get into the nitty-gritty of what exactly LinkedIn analytics are for your business page, let’s go over how you can access them.
You must be a page admin or be assigned an “analyst” role to see these metrics.
1. Log in to your LinkedIn account
2. Click on the Me icon at the top right of the page
3. Select Manage and then select Company. You will then be taken to your business page
5. Click on the “Analytics” tab on the left side menu

Content analytics
LinkedIn content analytics allows you to gauge how well your LinkedIn posts are performing with your followers and visitors. Here are the various post analytics under this category.
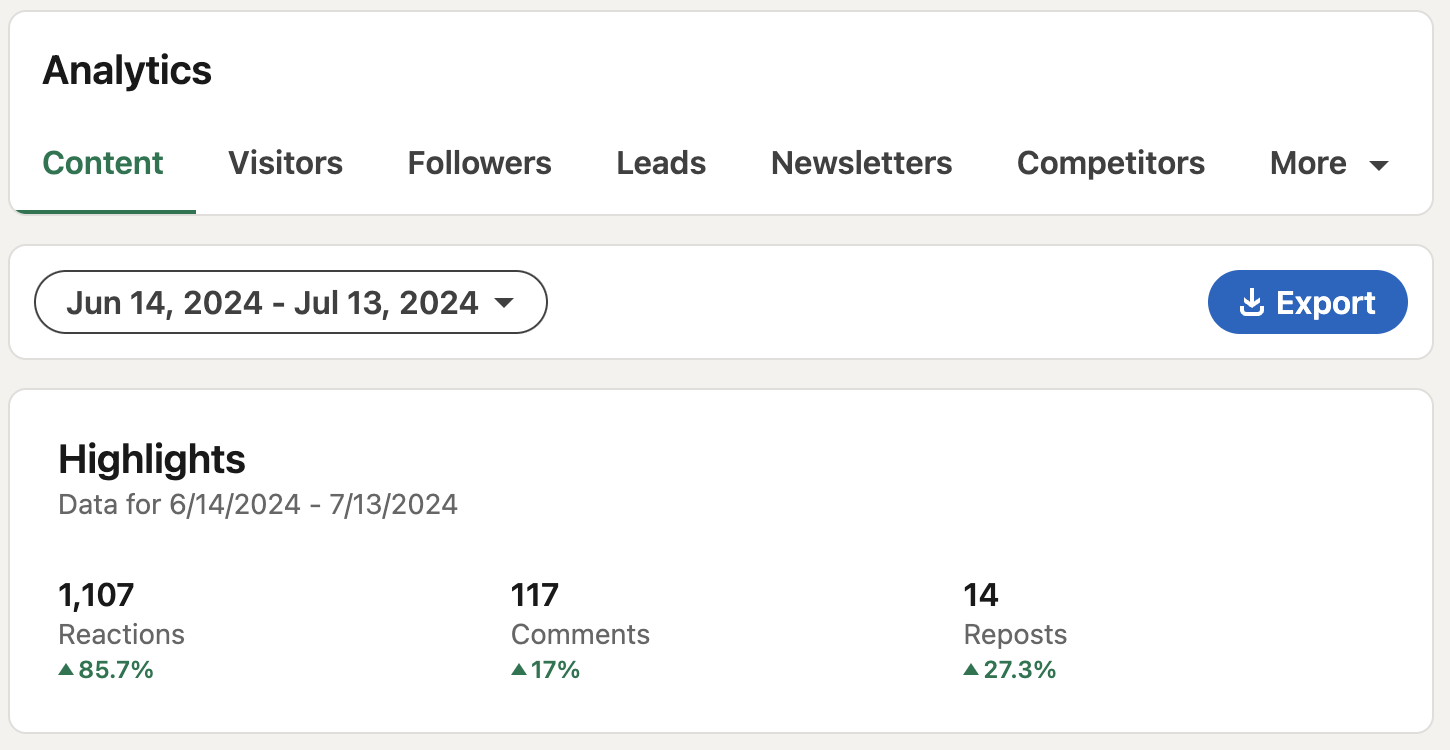
Highlights
To begin, on your dashboard, you will see a highlights section that provides you with a roundup of the total number of reactions, comments, and reposts you received in the last 30 days.
This is a great way to quickly gauge the success of your LinkedIn posts.
Metrics
Beneath highlights, you'll find the metrics section. Here, you’ll see a graph of the performance of both your organic and sponsored content on LinkedIn over time. You can also filter specific time ranges you want to view data for.
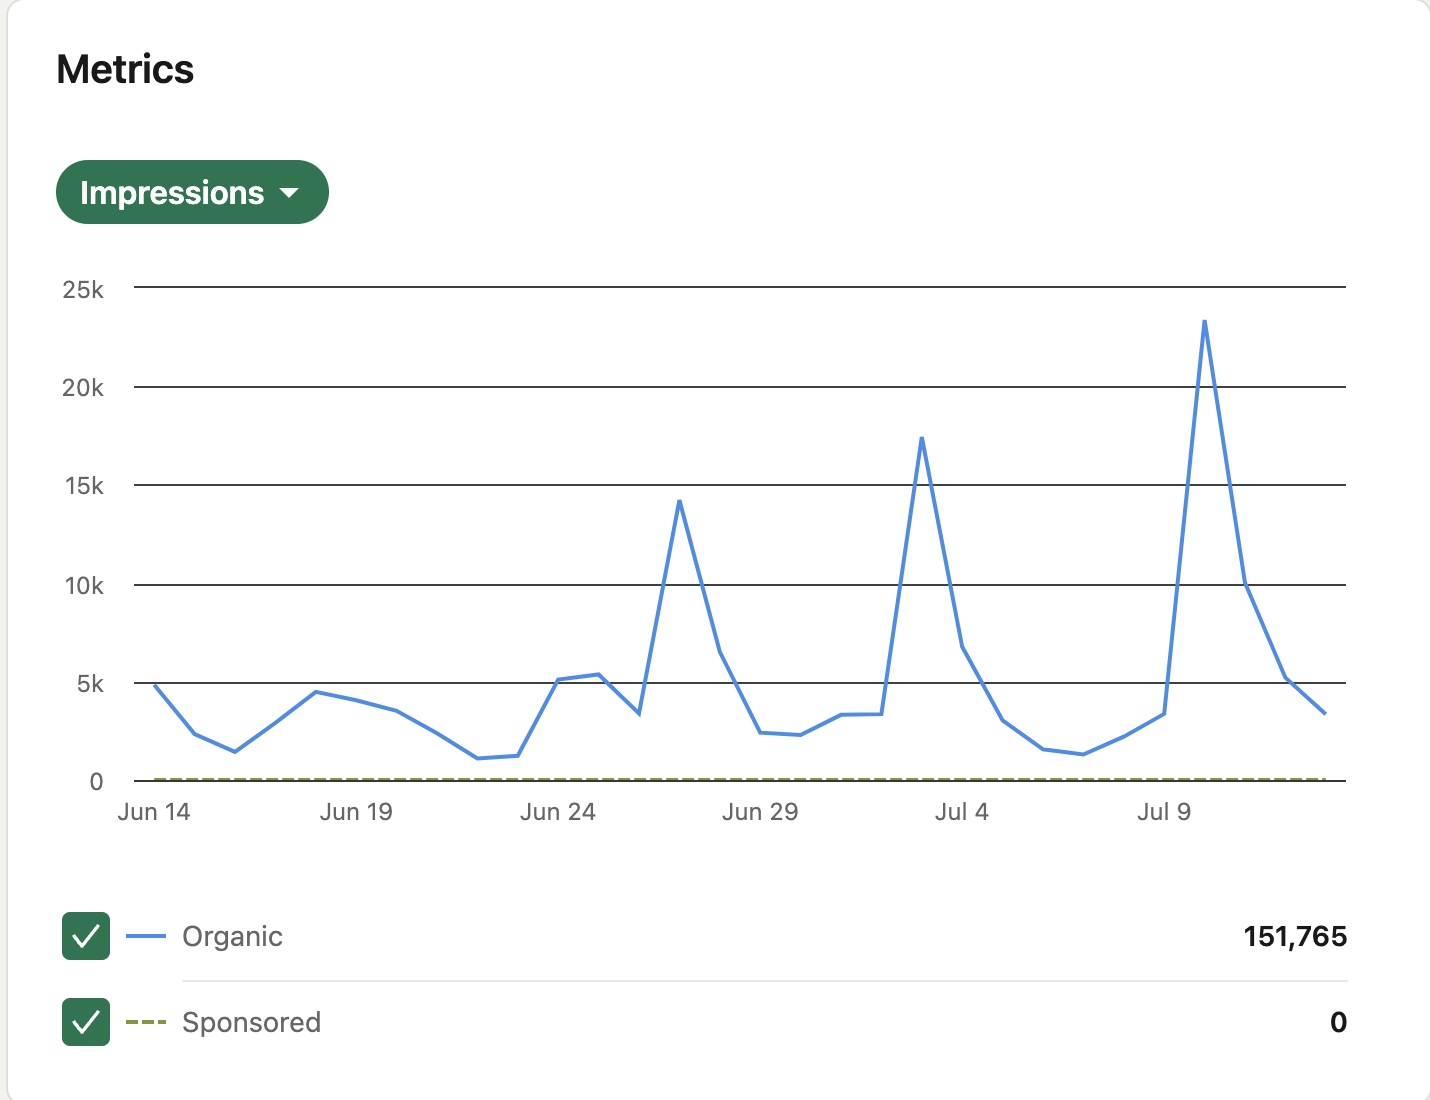
You’ll be able to select several data points to view on the graph, including:
- Impressions: the number of times each post is visible
- Unique views: the number of times your posts were shown to signed-in members
- Clicks: the number of clicks on your content, company name, or logo by a signed-in member
- Reactions: the number of reactions your post received
- Comments: the number of comments on your post
- Reposts: the number of times your content was reposted
- Engagement rate: your engagement rate is the number of interactions you’ve received, along with the number of clicks and followers gained, divided by the number of impressions
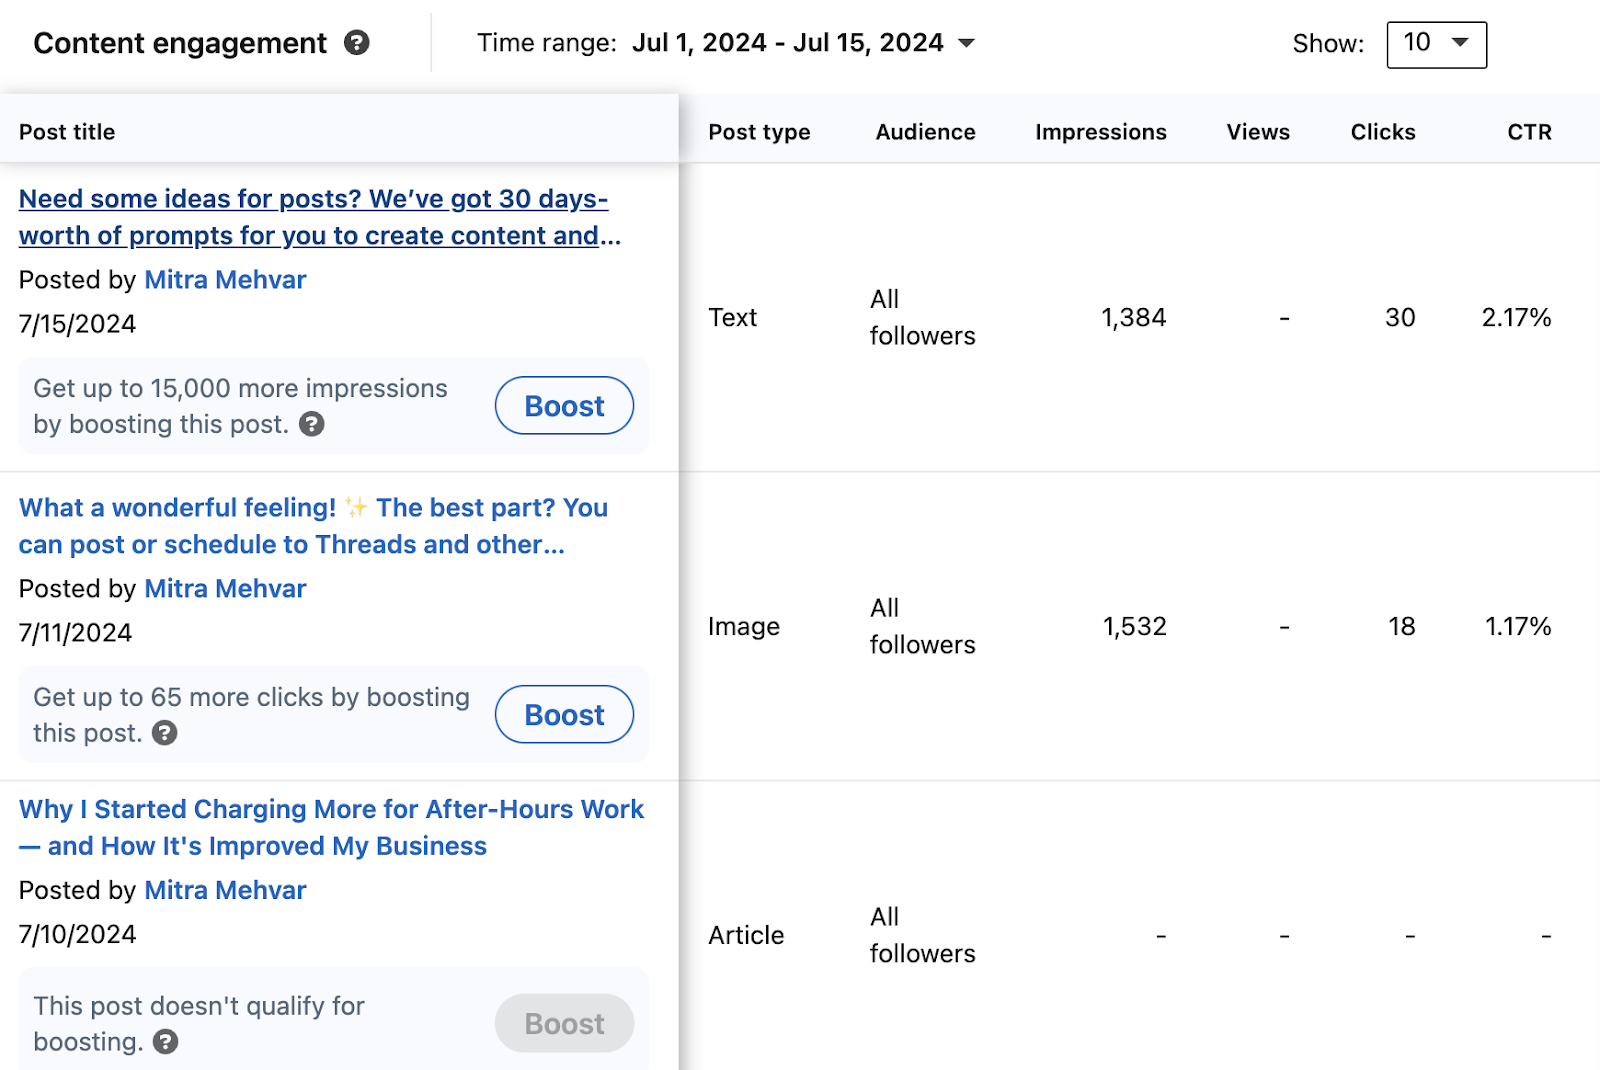
Content engagement
While the metrics section gives you an overview of all of your LinkedIn content performance, the content engagement tab breaks down the performance of each individual post and can also be filtered by dates.
Here is the data that you can see for every post:
- Post title: The first few words of your post
- Post author: Who created the post
- Post type: Whether the post was an image, video, or text
- Audience: Who your post is visible to
- Impressions: The number of times a post is visible
- Views: The number of times the post was viewed for at least 3 seconds
- Clicks: The number of times the post was clicked
- CTR (clickthrough rate): The number of clicks divided by impressions the post received
- Reactions: The number of reactions your post received
- Comments: How many comments the post received
- Reposts: How many times the post was reposted
- Follows: How many follow clicks your post received (Only sponsored posts include follow buttons)
- Engagement rate: The total number of clicks, likes, comments, reposts, and follows divided by impressions
You'll be able to measure just how well your LinkedIn content is performing using these metrics.
Follower analytics
With follower analytics, you can get a better sense of who is already following your page. This will give you an idea of who is interested in your company and who resonates with your content.
On the flip side, if you find that you’re not reaching your targeted audience, you can strategize how to create content that is more compelling to that demographic.
Let's go over the various metrics you’ll see in this section.
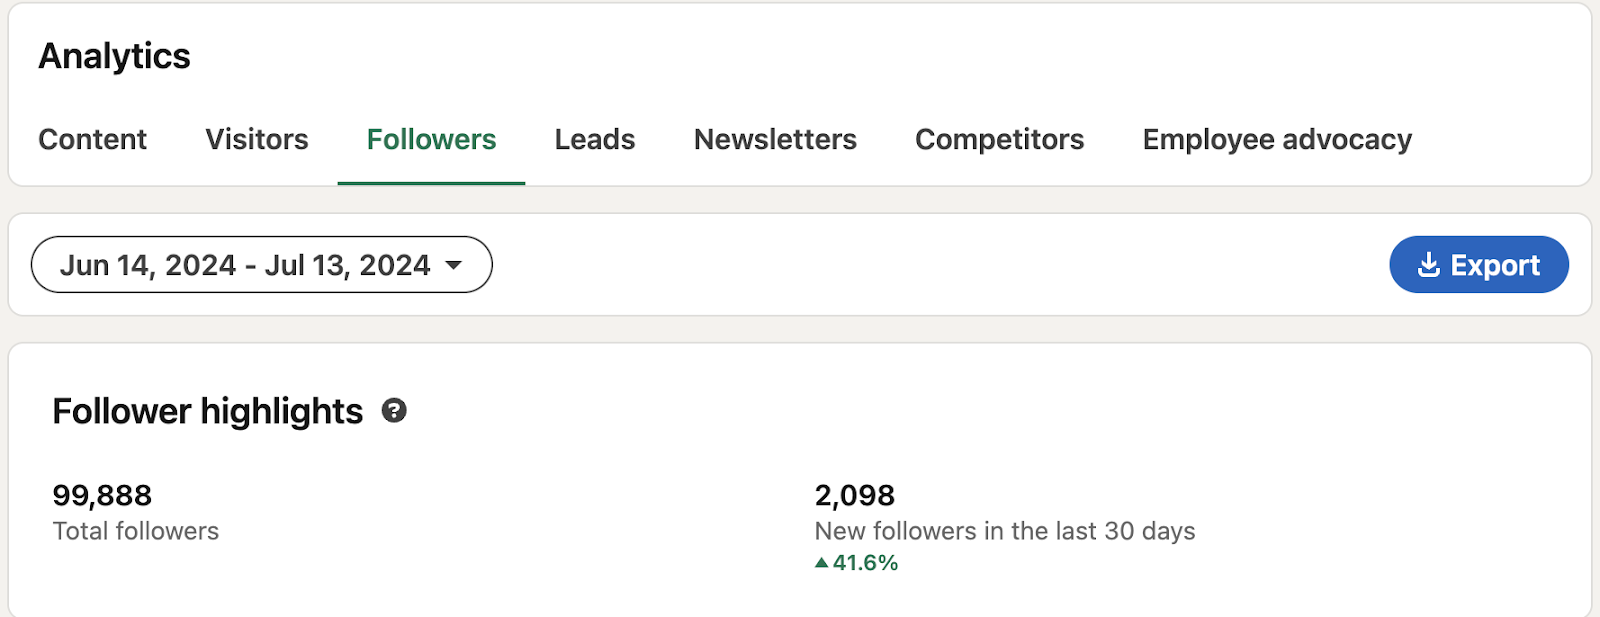
Follower highlights and trends
Here, you’ll see your total number of followers along with the number of followers you gained and the percentage change of your followers in a given time range.
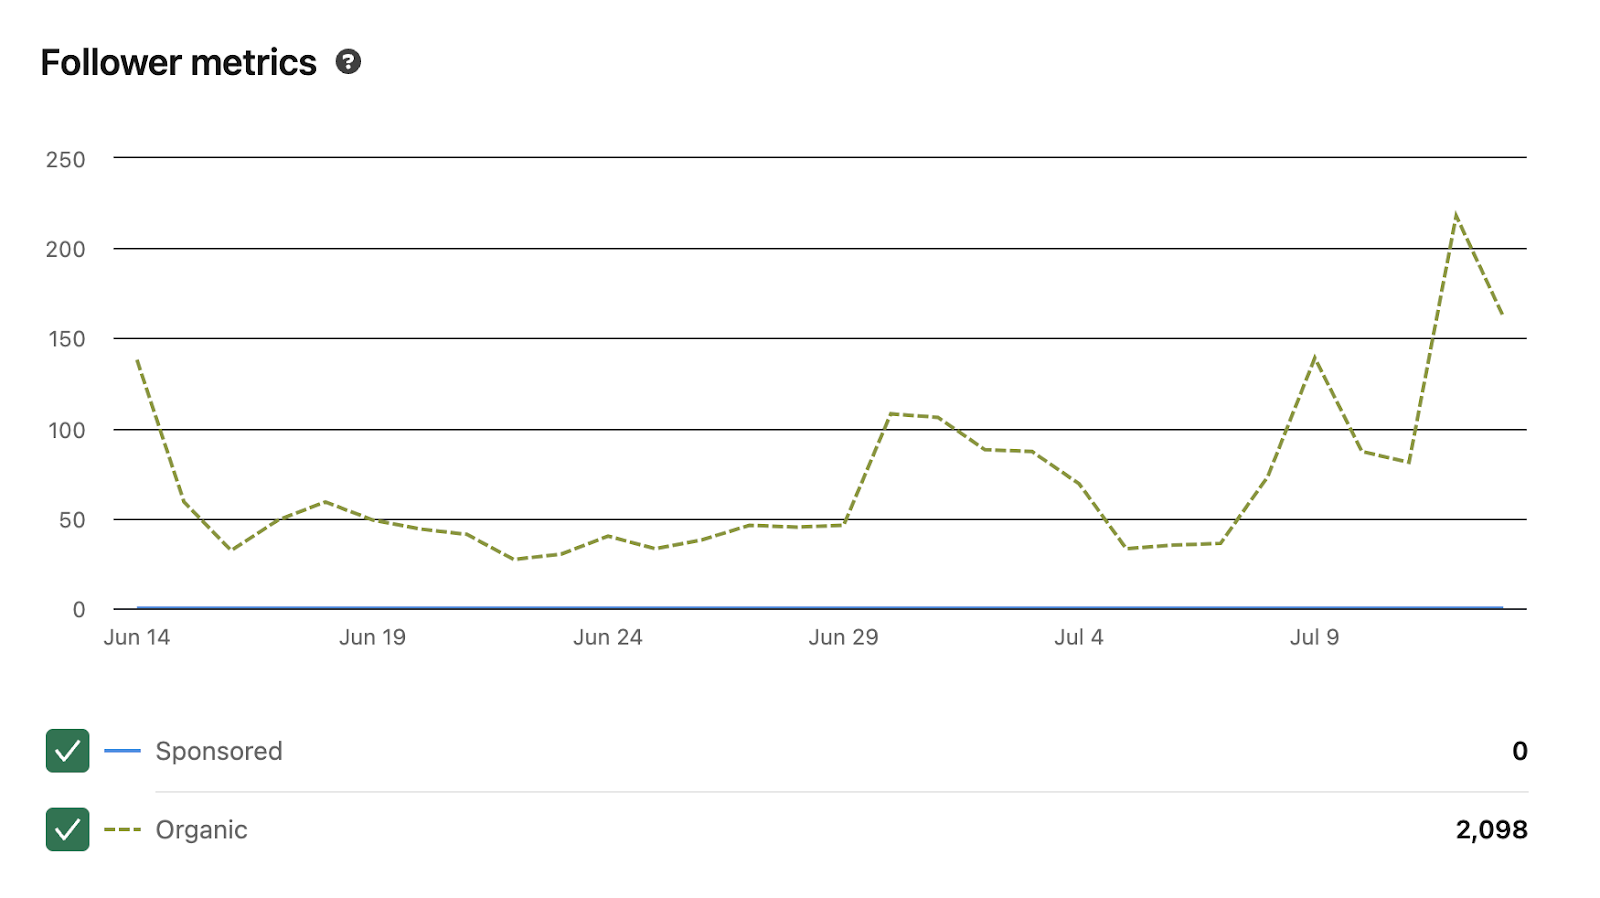
Follower metrics
In follower metrics, you’ll see a graph depicting how your number of followers has changed over time. You can also see the difference between organic followers versus sponsored followers.
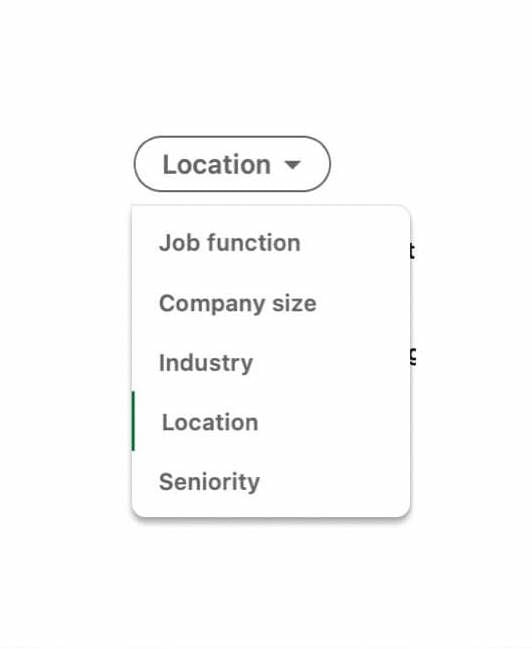
Follower demographics
Follower demographics provide demographic data to give you a detailed look into who exactly is following your business page on LinkedIn. Here are the details you can view:
- Job function
- Company size
- Industry
- Location
- Seniority
All followers
This section provides a list of everyone who is following your page listed in order of recency, their current place of employment, and the month they followed you.
Visitor analytics
Similar to follower analytics, visitor analytics provides a deep dive into LinkedIn users who have visited your business page but have not yet become followers.
Here’s an overview of the analytics you’ll see in this section.
Visitor highlights
This section will showcase the number of total page views, unique visitors, and custom button clicks in the last 30 days. You will also see the percentage of change in your followers over the last month.

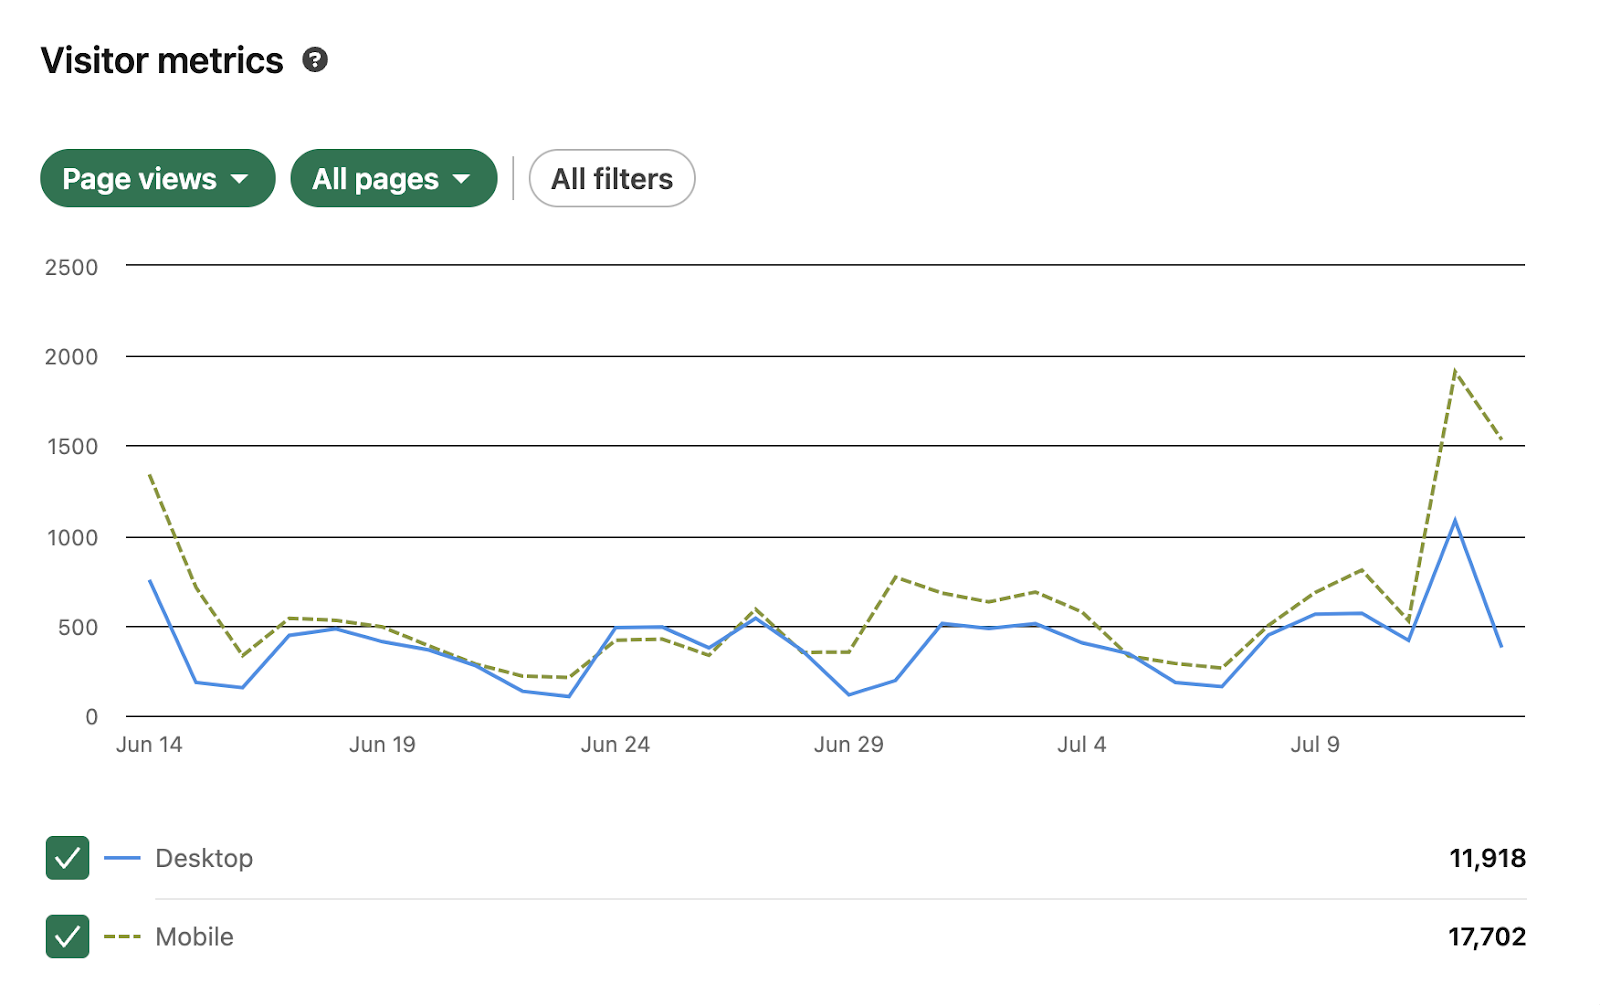
Visitor metrics
Visitor metrics show two key metrics: page views and unique visitors. You can also filter the data by specific page sections and time ranges.
Visitor demographics
Here you’ll get a breakdown of the users who have visited your LinkedIn page and view this data:
- Job function
- Company size
- Industry
- Location
- Seniority
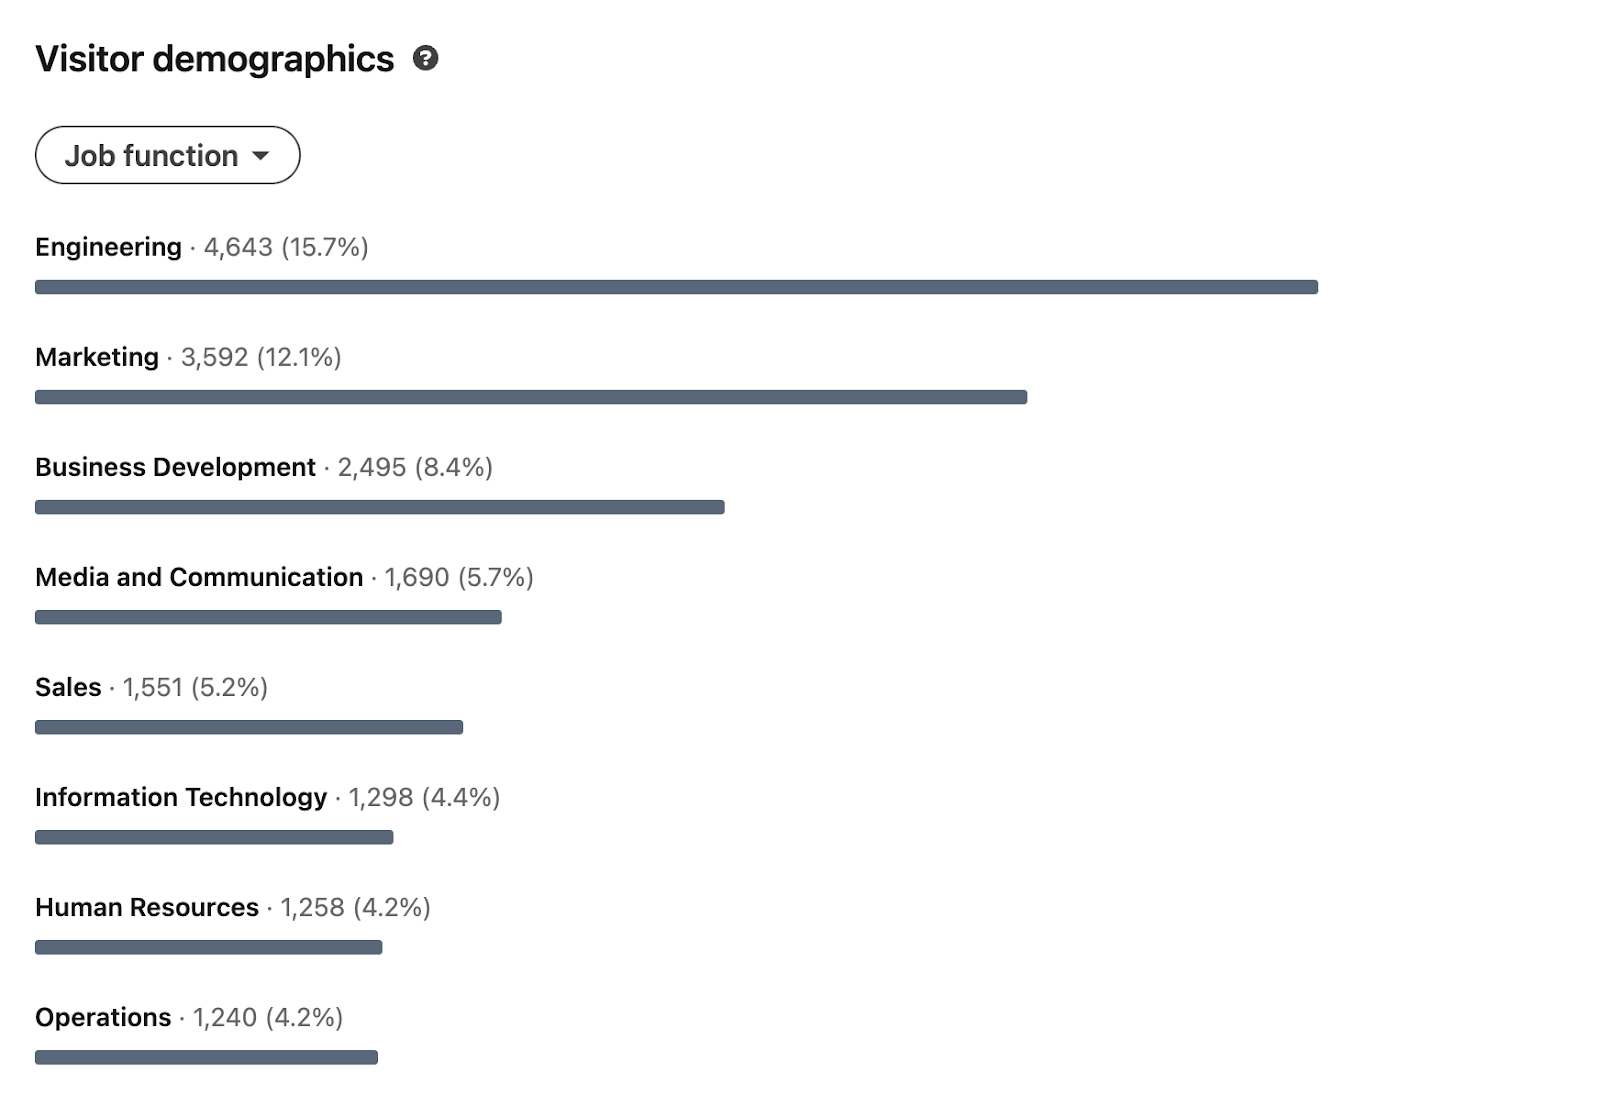
With this information, you'll have a better idea of who is interested in your page, and figure out how you can convert these viewers into actual followers.
LinkedIn Profile analytics
LinkedIn Profiles have access to slightly less metrics that pages, though they're still incredibly helpful.
How to access LinkedIn analytics for your personal profile
Accessing LinkedIn analytics for your personal page is simple.
1. Click the Me icon at the top of your LinkedIn Homepage
2. Click View Profile
3. Scroll until you find “Analytics”
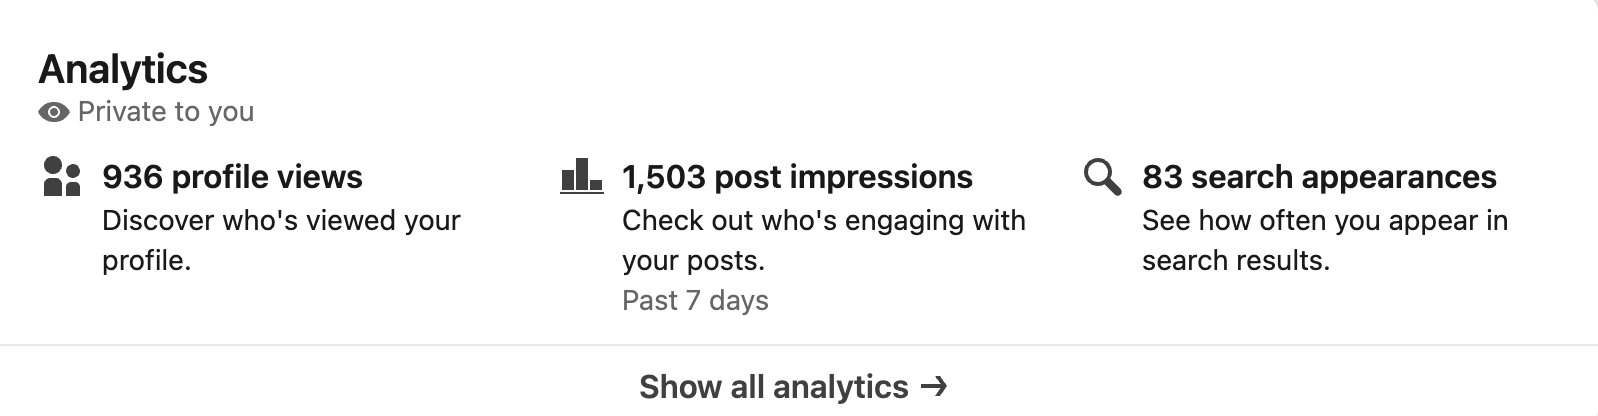
Once there, you will see basic data for your page, including:
- Profile views: how often your profile was viewed in the previous 90 days
- Post impressions: the overall number of impressions you’ve received on all of your posts
- Search appearances: how often your profile appeared in search results for the previous seven days
How to find LinkedIn Analytics for your individual posts
LinkedIn also provides analytics for each of your individual posts.
1. Log in to your LinkedIn account
2. Click on the Me icon at the top right of the page
3. Select Manage and then Posts & Activity
4. Click the Posts tab
Here, you’ll be able to see a detailed breakdown of each one of your posts' performance. Let’s take this post I created on my LinkedIn account, sharing my weekly social media tip.
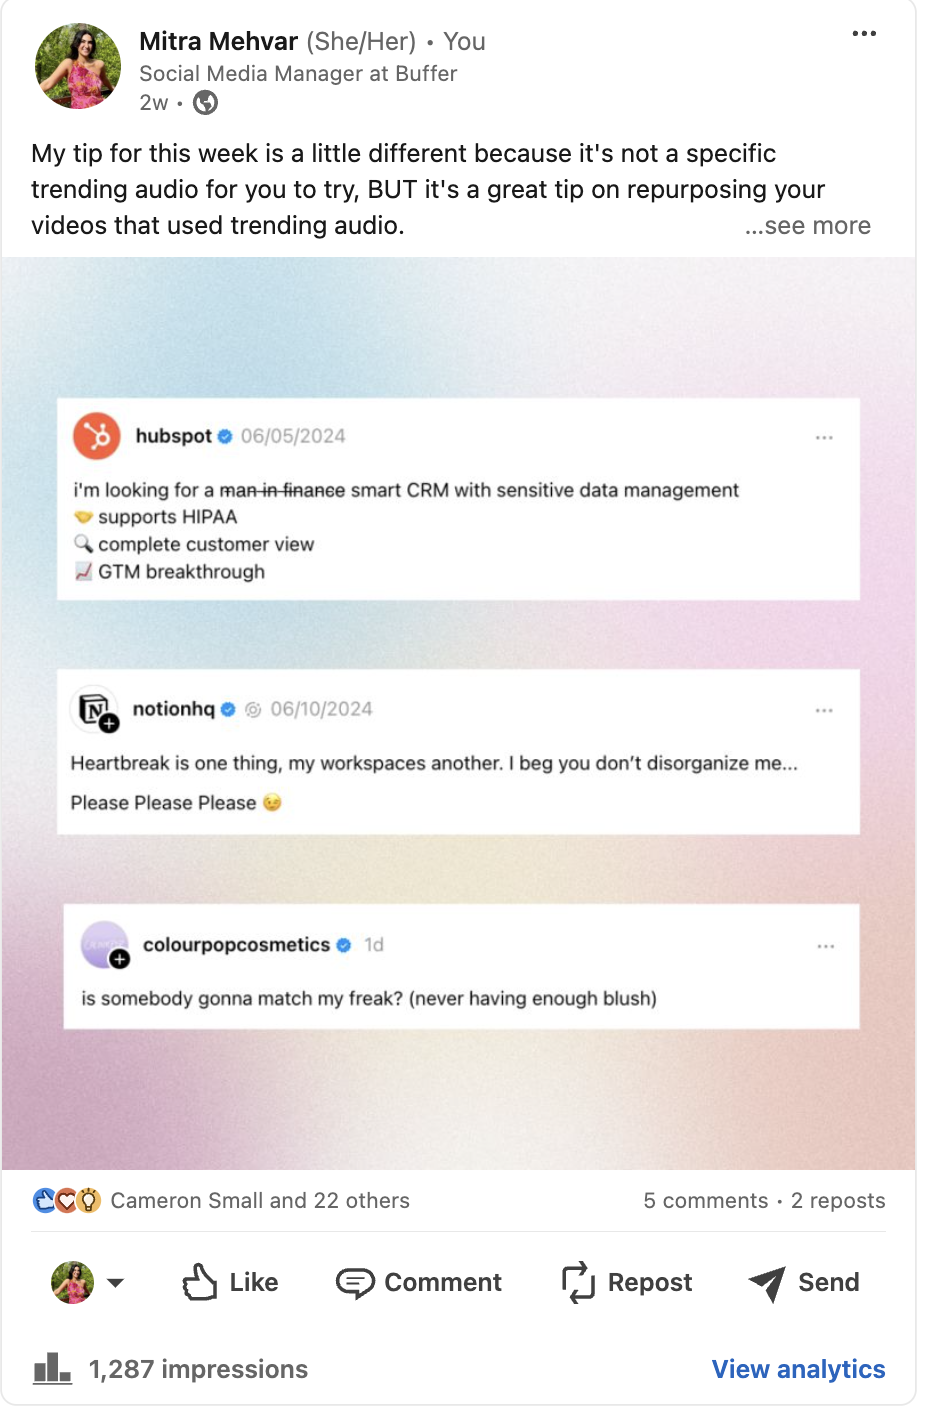
You’ll see the post impressions above the comments (if your post is a video, it will show video views instead), and you’ll find the full breakdown of your post once you click “View analytics.”
Clicking this provides a few additional metrics, including:
- Discovery: shows the total number of impressions of a post
- Engagements: shows engagement metrics like how many reactions, comments, and reposts your post received
- Top demographics of people reached: you can see the company size, job titles, locations, companies, and industries,of the individuals who viewed your post.
Not only can these metrics help you gauge the performance of your content, but they also give you some valuable insight into who is interacting most with your posts.
Using Buffer to supercharge your LinkedIn analytics tracking
While LinkedIn does have helpful native tracking, leveraging LinkedIn analytics tools can be game-changing when it comes to keeping tabs on and (most importantly) making sense of all the data. This is especially true if LinkedIn isn't the only social media platform you're active on.
Along with the ability to schedule and cross-post your content, LinkedIn analytics tools are baked right into Buffer.
Not only does this take the headache out of tracking all your social media analytics across platforms, but — and this is the best part — it will also interpret that data for you.
For LinkedIn Pages, you'll be given recommendations on a number of things, including which content type tends to perform best, the best time to post on LinkedIn
To top that off, you can also create LinkedIn analytics reports to help prove the value of your marketing efforts.
On LinkedIn posts from personal profiles, Buffer offers an at-a-glance overview of your post performance, including all the engagements your post received, impressions, and more.
Here’s a quick rundown of the LinkedIn analytics tools in Buffer:
LinkedIn Page Analytics in Buffer
To access analytics for your LinkedIn Page in Buffer, log into your account and click on the Analyze tab at the top. From there, choose LinkedIn from the channels list on the left.
Overview
Within the Overview tab, you will be shown key metrics that help to assess how your LinkedIn content is performing. These metrics can be filtered by specific time ranges, including weekly or monthly.
- Performance: In the performance tab, you will see the following data points: total followers, new followers, posts, impressions, clicks, and engagement rate.
- Average performance: In this section, you can see a bar graph with the following metrics: Total followers, clicks, comments, engagements, engagement rate, and impressions.
- Metric insights: Metric insights are charts that show the following data: Total followers, clicks, comments, engagements, engagement rate, and impressions per post.

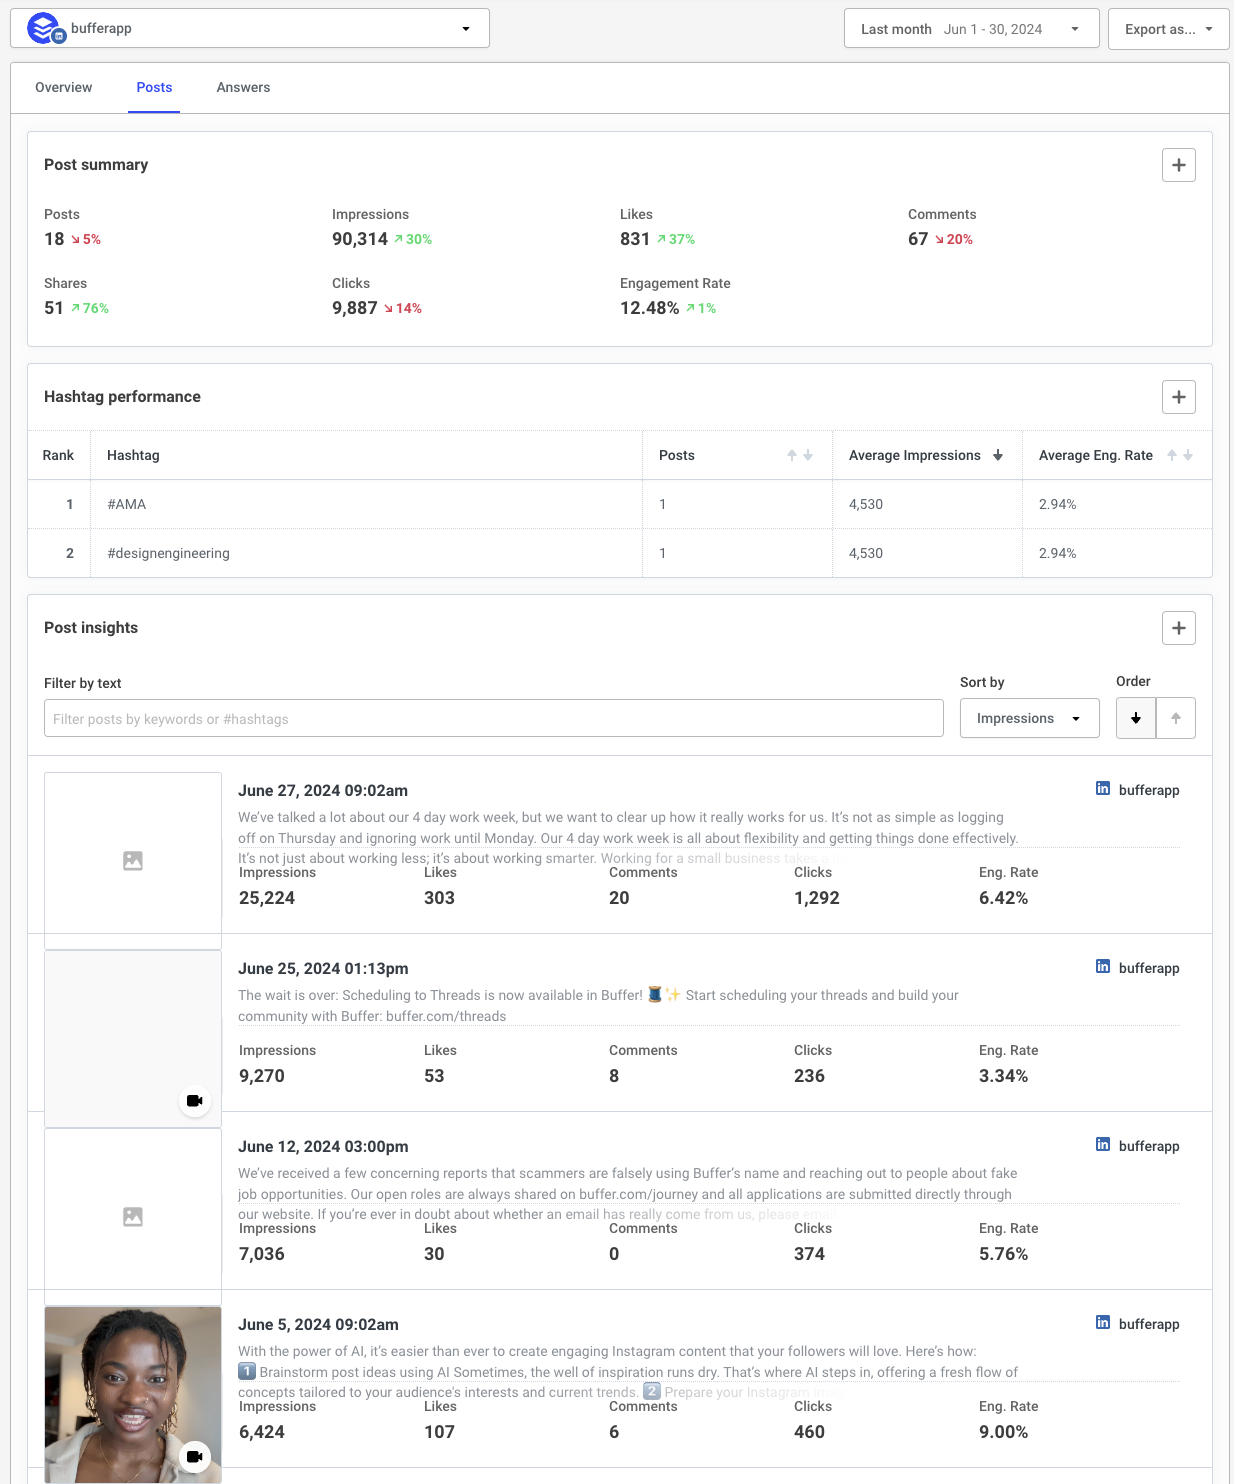
Posts
The posts tab looks specifically at important metrics on your posts in a specific time range.
- Post summary: Posts summary looks at the total number of posts in a given time period and provides a rundown of key metrics.
- Hashtag performance: Buffer’s hashtag performance section ranks the performance of hashtags used in your LinkedIn posts and provides the average impressions and engagement rate of each one.
- Post insights: Post insights provides the following data for individual posts: impressions, likes, comments, clicks, and engagement rate. You can sort by whichever metric is the most important to you, whether it’s likes, impressions, clicks, or engagement rate.
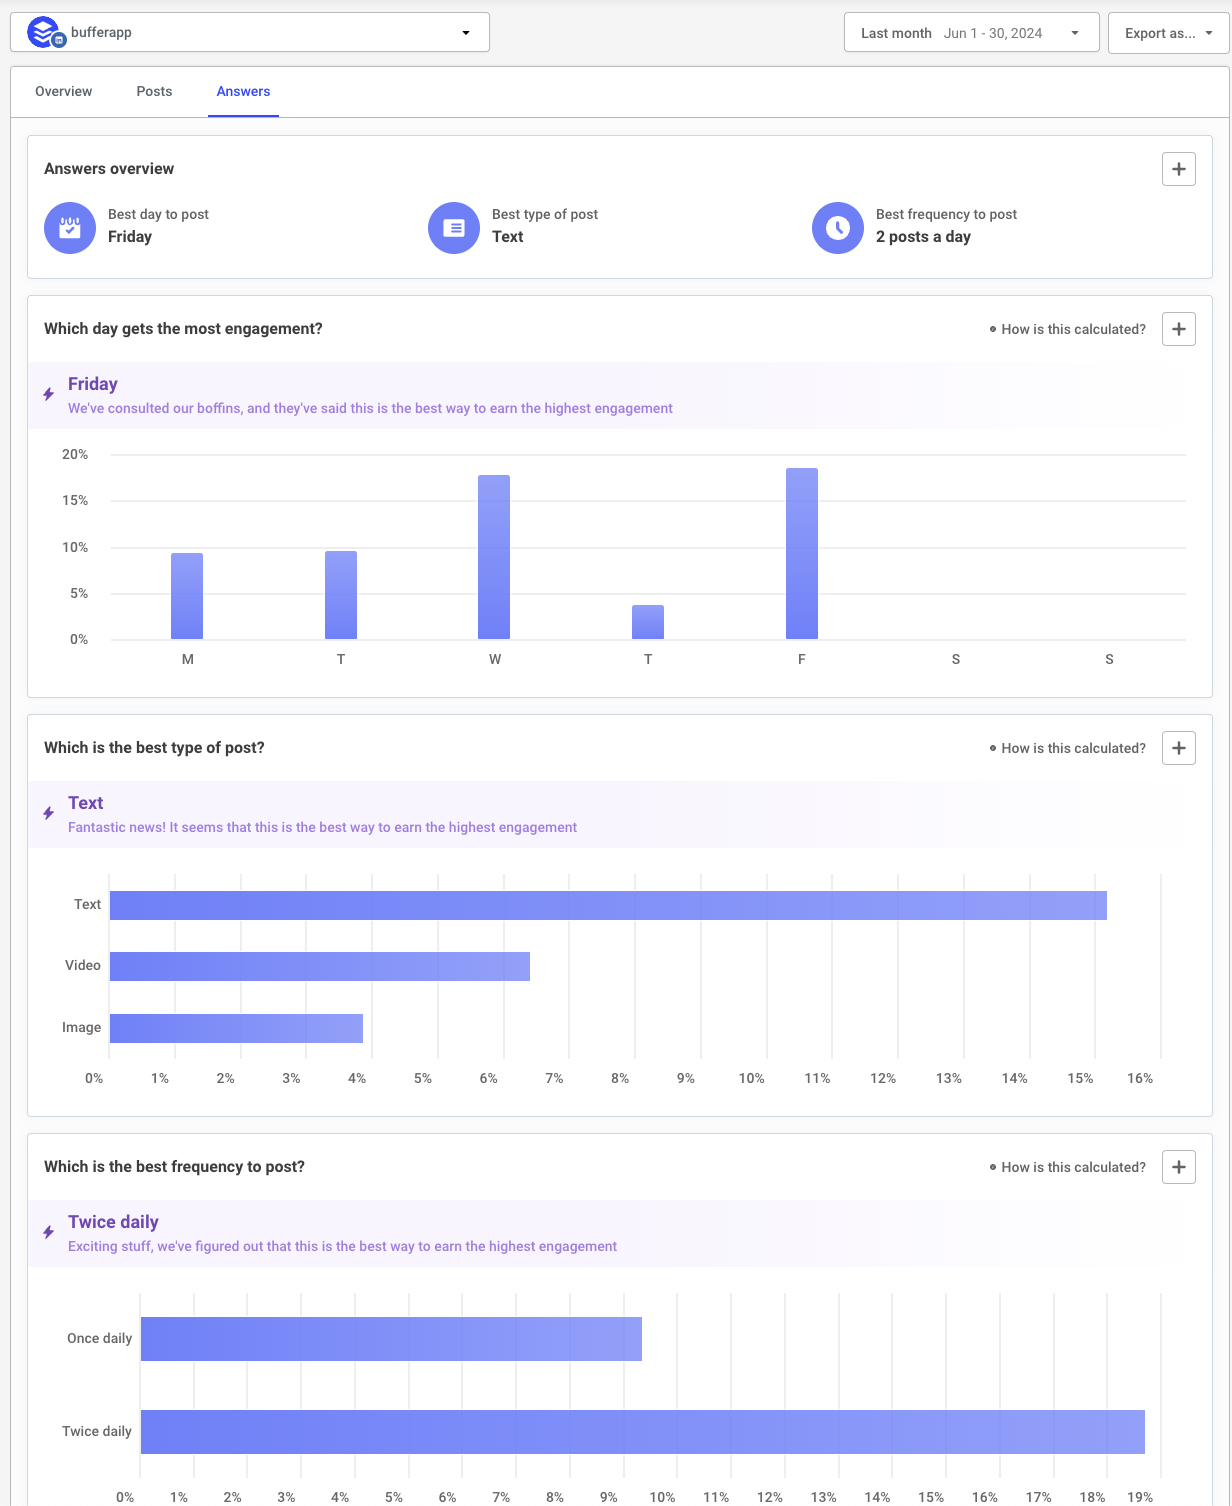
Answers
The answers tab is a super helpful section that analyzes your LinkedIn content to provide suggestions to help elevate your LinkedIn performance.
You’ll receive suggestions on the best days to post, the best type of content to post, and how frequently you should post. In this dashboard, you'll also find data showing how your posts perform at other times and days.
LinkedIn post analytics in Buffer
On all your sent posts for your personal LinkedIn profile in Buffer, you'll find a host of helpful stats at a glance.
To find them, navigate to your queue by clicking on the 'Publish' tab at the top of the screen, then choose LinkedIn from the channels list on the left-hand side.
From there, click 'Sent' just above your lists of posts to filter them by the posts that have already been published.
Beneath each post you'll find a host of helpful metrics to measure the success of that piece of content including likes, comments, impressions, shares, and engagement rate.
More LinkedIn resources
I hope this guide has helped you get a better understanding of how exactly to leverage LinkedIn analytics.
If you’re looking for more on creating a LinkedIn strategy, check out these resources to level up:
Try Buffer for free
180,000+ creators, small businesses, and marketers use Buffer to grow their audiences every month.
Related Articles

Everything you need to know about YouTube Studio, including how to edit a video or Short and analyze its performance — essential for growing a healthy YouTube subscriber base.
Here's a list of the best social media collaboration tools out there, including the ones we enjoy using here at Buffer.
Pinterest is the underdog of all social media sites. * It marries the social media aspect with a visual search engine * It’s one of the most rapidly growing social media platforms * It gives you a fertile ground to grow your website traffic If that wasn’t enough, Pinterest ads also give you twice as much return on ad spend (ROAS) compared to other social media marketing channels. Pinterest advertising is also more cost-effective than other digital marketing avenues. Given all the benefits,