I truly believe our value of transparency makes Buffer a better company than we might be otherwise.
There wasn’t one specific reason why we began to share so openly about nearly everything we do, like:
- Salaries of all team members
- Revenues of Buffer’s combined paid plans, consisting of the Awesome and Business plans
- Equity and ownership breakdown of the company
- Fundraising details and valuation
But as a result, we’ve seen many specific benefits of transparency: We trust one another more. We come closer to creating equality in the world. And we get lots more feedback on our decisions, which helps us reflect, adjust and improve.
Our current spending breakdown
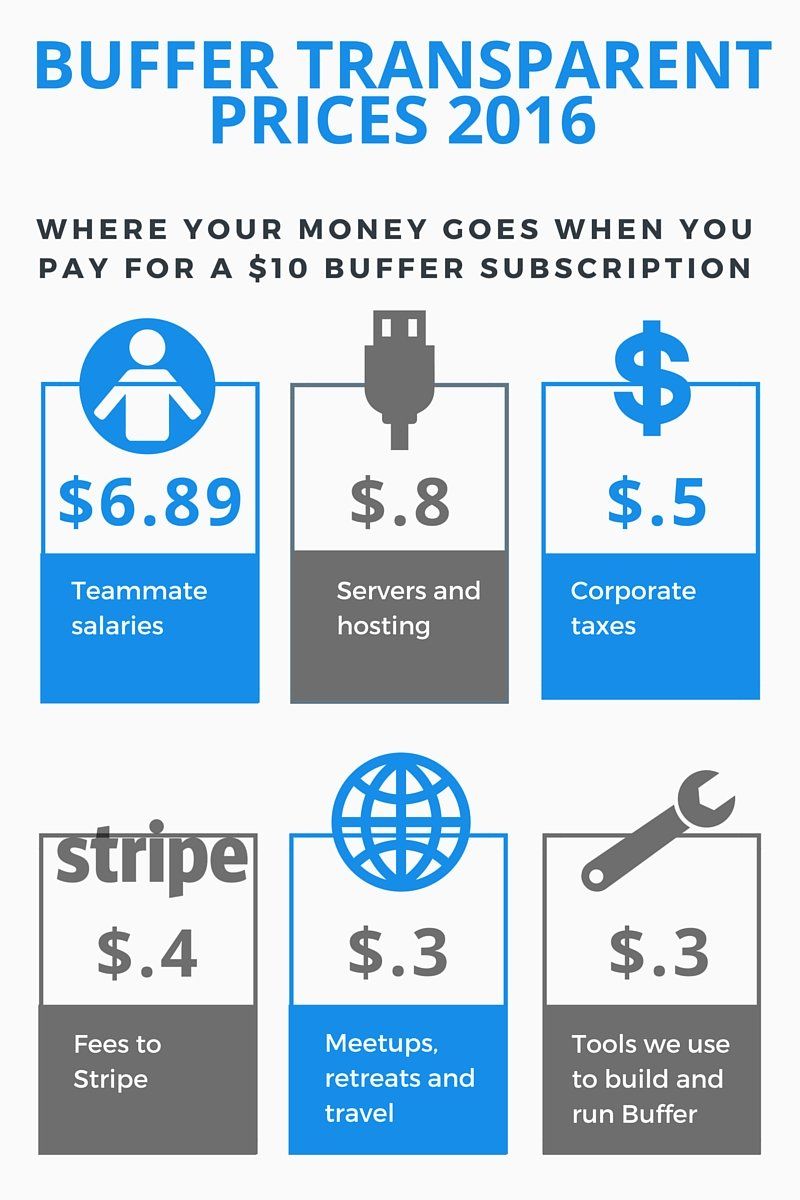
For the first time last year, we tried to think hard about what exactly someone pays for when they purchase a Buffer subscription. Where does the money go? What and whom within Buffer does it support?
It felt awesome to break it down and share that information with you, and we want to keep going!
This year, we wanted to share again with our most updated numbers and show you exactly what has changed as we’ve grown and evolved.

For even more details, the sortable table below breaks down our monthly costs and shows what each element makes up as a portion of a $10 Awesome Plan subscription payment:
| Expense | Monthly Cost | Percentage of monthly cost | Portion of $10 Awesome plan |
|---|---|---|---|
| Total | $584,969 | 100% | $10.00 |
| Team Member Salaries | $403,000 | 68.89% | $6.89 |
| Servers | $47,853 | 8.18% | $0.82 |
| Meetups and Travel | $19,267 | 3.29% | $0.33 |
| Fees to Stripe | $23,319 | 3.99% | $0.40 |
| Advertising & Marketing | $6,650 | 1.14% | $0.11 |
| The Tools We Use | $17,000 | 2.91% | $0.29 |
| Insurance | $8,000 | 1.37% | $0.14 |
| Rent/Co-working space | $9,558 | 1.63% | $0.16 |
| Legal and Accounting | $5,846 | 1.00% | $0.10 |
| Computer and Equipment | $10,973 | 1.88% | $0.19 |
| Employee Benefits | $2,255 | 0.39% | $0.04 |
| Telephone & Internet | $1,900 | 0.32% | $0.03 |
| Taxes | $28,000 | 4.79% | $0.48 |
| Postage & Shipping | $203 | 0.03% | $0.00 |
| Other | $1,145 | 0.20% | $0.02 |
Compared to last year
Here’s what the breakdown looked like the last time we did this, just a bit over a year ago:
| Expense | Monthly Cost | Percentage of monthly cost | Portion of $10 Awesome plan |
|---|---|---|---|
| Total | $341,202.56 | 100% | $10.00 |
| Team Member Salaries | $223,939.74 | 65.6% | $6.56 |
| Servers | $22,890.76 | 6.7% | $0.67 |
| Meetups and Travel | $17,588.15 | 5.2% | $0.33 |
| Fees to Stripe | $13,885.42 | 4.1% | $0.41 |
| Advertising & Marketing | $6,302.40 | 1.8% | $0.18 |
| The Tools We Use | $14,161.79 | 4.2% | $0.42 |
| Insurance | $6635.93 | 1.9% | $0.19 |
| Rent | $7175.53 | 2.1% | $0.21 |
| Legal and Accounting | $5,883.06 | 1.7% | $0.17 |
| Computer and Equipment | $2,577.81 | .8% | $0.08 |
| Employee Benefits | $1,593.5 | .5% | $0.05 |
| Telephone & Internet | $1,292.58 | .4% | $0.04 |
| Office Supplies and Community | $1120.48 | .3% | $0.03 |
| Other | $488.79 | .1% | $0.01 |
| Profit | $15,666.63 | 4.6% | $.46 |
What’s changed?
Many of the elements of these two charts look pretty similar so I wanted to take a minute to highlight some of the key differences from last year to this one.
Profit: We’re putting more money back into the company
One noticeable change from last year’s report is that the profit area is now missing.
Though Buffer’s revenue right now exceeds our costs, we don’t feel that accumulating a profit at this stage is the best thing to focus on. As a result, we’re keen to invest as much money back into the company as possible.
In an ideal world, we’d like to have revenue and company spending trailing on the same trajectory, so we can be sure to put our money to the best use and share the good news about Buffer’s product with the rest of the world.
Salaries: We’ve grown the team 156% since our last report
The biggest chunk of a Buffer subscription by far is teammate salaries, and that number has grown a bit from $6.56 of a $10 monthly subscription to $6.89.
This is because
Buffer more than doubled in team size in 2015, rocketing from 25 teammates at the time of our last transparent pricing report to 64 teammates at the time of this analysis—a change of 156%! (This might also provide some context to the higher spending in the computers/equipment area, as new teammates often need a few supplies to work their best).
We’re hiring for many more roles as well, with the idea that the team could be well above 100 members by the end of the year. That means lots of new teammate salaries, which could likely grow this area even more.
Rent: We closed our office
It’s a small bit of a Buffer subscription, but perhaps it’s still worth sharing that the “rent” portion decreased from $.21 to $.16 and now includes coworking space subscriptions for teammates as well.
This is because Buffer closed our office last year!
After we tallied up all our costs last year, we noticed that office space was a not-insignificant element of our overall expenditures each month—more than we paid for health insurance, or advertising and marketing.
And yet, only a few people on our distributed team were using it.
As a result, we made the decision to close the office and go fully remote, with no permanent office anywhere. Teammates who prefer a fixed office environment are welcome to join a coworking space and expense it, which now makes up the bulk of this segment.
Taxes: We’re averaging them out over the year
Corporate taxes (Buffer is registered as a C corp) did not quite make it into our last analysis.
With our awesome finance planner Karim now on board with us, we are now spreading the cost of quarterly taxes out over the year in order to forecast ahead and set the appropriate money aside to pay taxes. As such, we now see a 48-cent portion of the Awesome subscription going toward those taxes.
(A quick note here: This represents corporate taxes only; payroll taxes for U.S. teammates are included in the salaries category.)
Sharing our finances with Inc.
It’s a great privilege to share what we do and be lucky enough to get feedback on it, so we were delighted when the magazine Inc. asked if we’d like to be involved in a feature about our transparent finances.
For Inc.’s February issue, author Victoria Finkle grabbed all of our transparent data, asked tons of great questions and even pulled in some awesome experts in their field to weigh in on our costs.
The result is an amazing feature you can read here (below is what it looks like in the magazine).
We were pretty excited to see Buffer in a print magazine, and even more so that the topic was something we’re so passionate about: Extending transparency to our community, our customers, and the world (well, as much of the world as is interested, at least).
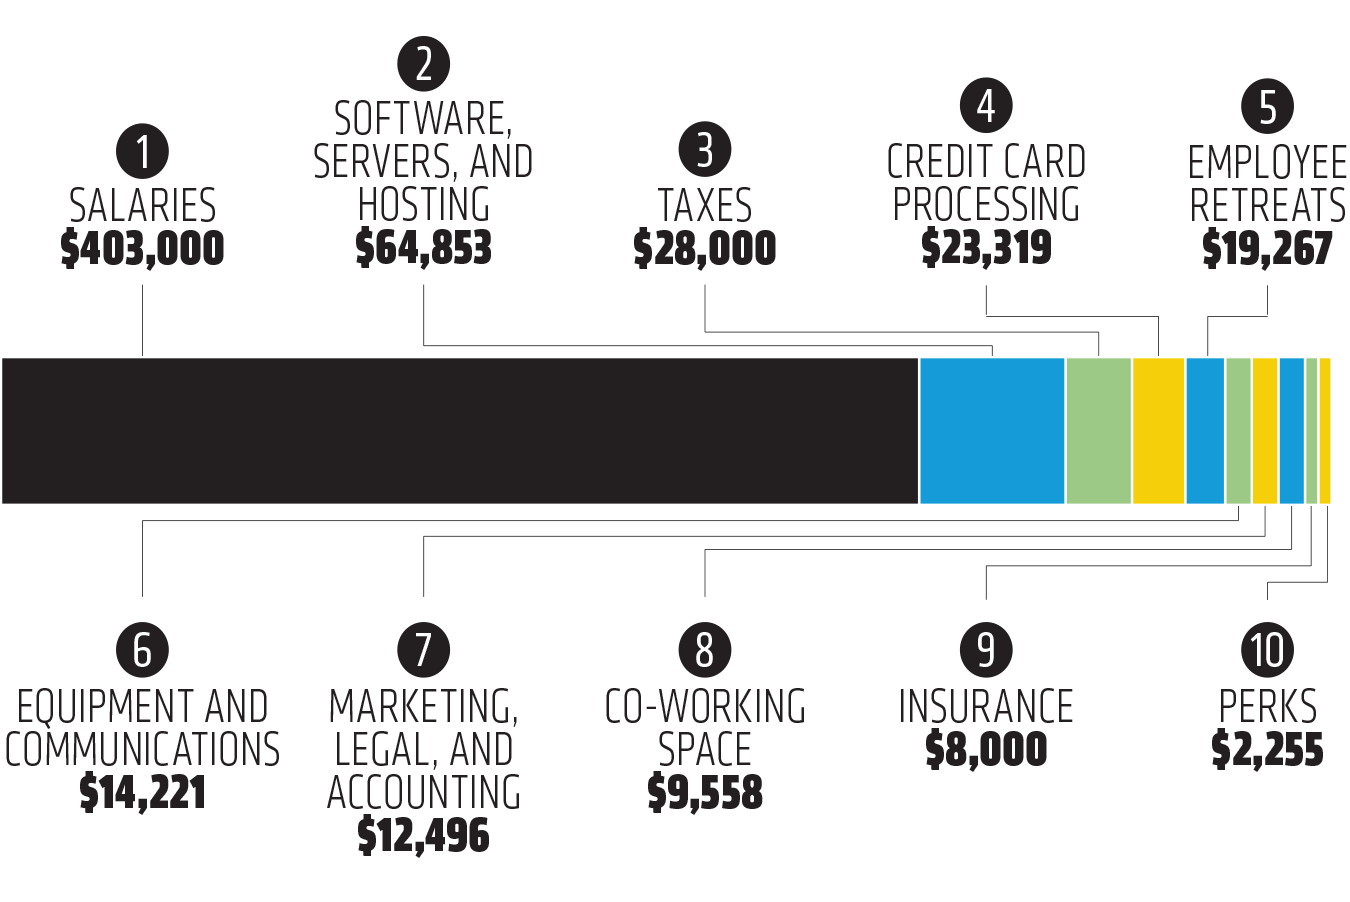
We also wanted to share with you the below infographic, which breaks down our average monthly spending in a very easy-to-understand bar chart that we like a lot:

What did Inc. find in its super deep dive into our monthly spending? Some amazing recommendations on how we could improve in areas like salaries, marketing spending, and software vendor negotiation.
Transparency continues to find new ways to make us better.
Over to you!
We always want to charge our customers a price that is fair and that allows us to keep working hard on Buffer.
What things stand out to you about our costs and how we operate? Are there things you see we could improve on? I’m keen to hear your thoughts so we can keep improving.
And thanks for being part of this incredible journey with us.
Try Buffer for free
190,000+ creators, small businesses, and marketers use Buffer to grow their audiences every month.


