At Buffer, every product decision we make is driven by quantitative metrics. We have always sought to be lean in our decision making, and one of the core tenants of being lean is launching experimental features early and measuring their impact.
Buffer is a social media tool to help you schedule and space out your posts on social media networks like Twitter, Facebook, Google+ and Linkedin. We started in late 2010 and thanks to a keen focus on analytical data, we have now grown to over 1.5 million users and 155k unique active users per month. We’re now responsible for sharing 3 million social media posts a week.
When I started at Buffer in September 2012, we were using a mixture of Google Analytics, Kissmetrics and an internal tool to track our app usage and analytics.
We struggled to move fast and effectively measure product and feature usage with these disconnected tools. We didn’t have an easy way to generate powerful reports like cohort analysis charts or measure things like activation segmented by signup sources over time.
Third-party tracking services were great for us early on, but as we started to dig deeper into our app insights, we realized there was no way around it—we needed to build our own custom metrics and event tracking.
We took the plunge in April 2013 to build our own metrics framework using MongoDB. While we’ve had some bumps and growing pains setting this up, it’s been one of the best decisions we’ve made. We are now in control of all metrics and event tracking and are able to understand what’s going on with our app at a deeper level. Here’s how we use MongoDB to power our metrics framework.
Why we chose MongoDB
At the time we were evaluating datastores, we had no idea what our data would look like. When I started designing our schema, I quickly found that we needed something that would let us change the metrics we track over time and on the fly. Today, I’ll want to measure our signup funnel based on referrals, tomorrow I might want to measure some custom event and associated data that is specific to some future experiment.
I needed to plan for the future, and give our developers the power to track any arbitrary data. MongoDB and its dynamic schema made the most sense for us. MongoDB’s super powerful aggregation framework also seemed perfect for creating the right views with our tracking data.
Our metrics framework architecture
In our app, we’ve set up an AWS SQS queue and any data we want to track from the app goes immediately to this queue. We use SQS heavily in our app and have found it to be a great tool to manage messaging at high throughput levels.
We have a simple python worker which picks off messages from this queue and writes them to our metrics database. The reason why we’ve done this instead of connecting and writing directly to our metrics MongoDB database is because we wanted our metrics set up to have absolutely zero impact on application performance.
Much like Google Analytics offers no overhead to an application, our event tracking had to do the same. The MongoDB database that would store our events would be extremely write heavy since we would be tracking anything we could think of, including every API request, page visited, Buffer user/profile/post/email created etc. If, for whatever reason our metrics db goes down, or starts having write locking issues, our users shouldn’t be impacted.
Using SQS as a middleman would allow tracking data to queue up if any of these issues occur. SQS gives us enough time to figure out what the issue is, fix, it and then process that backlog. We’ve had quite a few times in the past year where using Amazon’s robust SQS service has saved us from losing any data during maintenance or downtime that would occur when creating a robust high throughput metrics framework from scratch.
We use MongoHQ to host our data. They’ve been super helpful with any challenges in scaling a db like ours. Since our setup is write heavy, we’ve initially set up a 400GB SSD replica set. As of May 16, we have 90 collections and are storing over 500 million documents.
We wrote simple client libraries for tracking data for every language that we use (PHP, Python, Java, NodeJS, Javascript, Objective-C). In addition to bufferapp.com, our API, mobile apps and internal tools all plug into this framework.
Tracking events
Our event tracking is super simple. When a developer creates a new event message, our python worker creates a generic event collection (if it doesn’t exist) and stores event data that’s defined by the developer. It will store the user or visitor id, and the date that the event occurred. It’ll also store the user_joined_at date which is useful for cohort analysis.
Here are some examples of event tracking our metrics platform lets us do.
Visitor page views in the app
Like many other apps, we want to track every visitor that hits our page. There is a bunch of data that we want to store to understand the context around the event. We’d like to know the IP address, the URI they viewed, the user agent they’re using among other data.
Here’s what the tracking would look like in our app written in PHP:
Here’s the corresponding result in our MongoDB metrics db:
Logging User API calls
We track every API call our clients make to the
Buffer API. Essentially what we’ve done here is create query-able logging for API requests. This has been way more effective than standard web server logs and has allowed us to dig deeper into API bugs, security issues and understanding the load on our API.
Experiment data
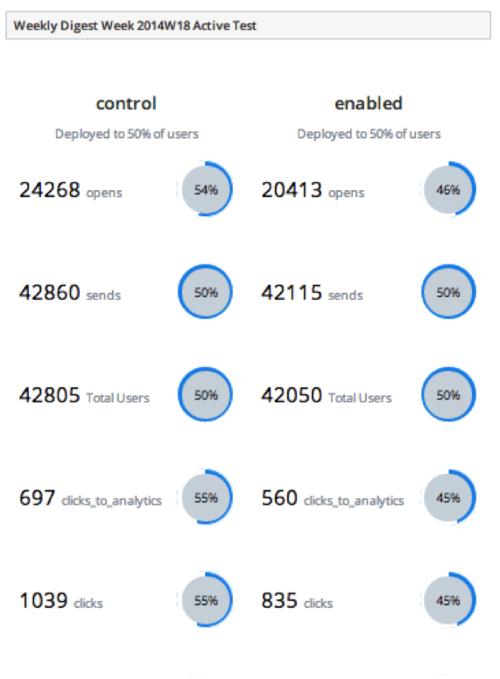
With this type of event tracking, our developers are able to track anything by writing a single line of code. This has been especially useful for measuring events specific to a feature experiment. This frictionless process helps keep us lean: we can measure feature usage as soon as a feature is launched. For example, we recently launched a group sharing feature for business customers so that they can group their Buffer social media accounts together. Our hypothesis was that people with several social media accounts prefer to share specific content to subsets of accounts. We wanted to quantifiably validate whether this is something many would use, or whether it’s a niche or power user feature. After a week of testing this out, we had our answer. This example shows our tracking of our ‘group sharing’ experiment. We wanted to track each group that was created with this new feature. With this, we’re able to track the user, the groups created, the name of the group, and the date it was created.
Making sense of the data
We store a lot of tracking data. While it’s great that we’re tracking all this data, there would be no point if we weren’t able to make sense of it. Our goal for tracking this data was to create our own growth dashboard so we can keep track of key metrics and understand results of experiments. Making sense of the data was one of the most challenging parts of setting up our growth platform.
MongoDB aggregation
We rely heavily on MongoDB’s aggregation framework. It has been super handy for things like gauging API client requests by hour, response times separated by API endpoint, number of visitors based on referrers, cohort analysis and so much more.
Here’s a simple example of how we use MongoDB aggregation to obtain our average API response times between April 8th and April 9th:
Result:
With the aggregation framework, we have powerful insight into how clients are using our platform, which users are power users and a lot more. We previously created long running scripts to generate our cohort analysis reports. Now we can use MongoDB aggregation for much of this.
Running ETL jobs
We have several ETL jobs that run periodically to power our growth dashboard. This is the way we make sense of our data core. Some of the more complex reports need this level of reporting. For example, the way we measure product activation is whether someone has posted an update within a week of joining. With the way we’ve structured our data, this requires a join query in two different collections. All of this processing is done in our ETL jobs. We’ll upload the results to a different database which is used to power the views in our growth dashboard for faster loading.
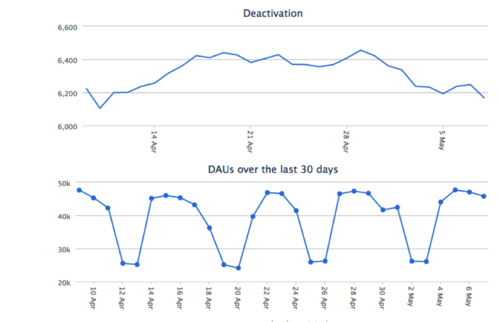
Here are some reports on our growth dashboard that are powered by ETL jobs
Scaling challenges and pitfalls
We’ve faced a few different challenges and we’ve iterated to get to a point where we can make solid use out of our growth platform. Here are a few pitfalls and examples of challenges that we’ve faced in setting this up and scaling our platform.
Plan for high disk I/O and write throughput
The DB server size and type has a key role in how quickly we could process and store events. In planning for the future we knew that we’d be tracking quite a lot of data and a fast pace, so a db with high disk write throughput was key for us. We ended up going for a large SSD replica set. This of course really depends on your application and use case. If you use an intermediate datastore like SQS, you can always start small, and upgrade db servers when you need it without any data loss.
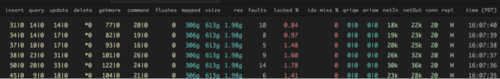
We keep an eye on mongostat and SQS queue size almost daily to see how our writes are doing.
One of the good things about an SSD backed DB is that disk reads are much quicker compared to hard disk. This means it’s much more feasible to run ad hoc queries on un-indexed fields. We do this all the time whenever we have a hunch of something to dig into further.
Be mindful of the MongoDB document limit and how data is structured
Our first iteration of schema design was not scalable. True, MongoDB does not perform schema validation but that doesn’t mean it’s not important to think about how data is structured. Originally, we tracked all events in a single user_metrics and visitor_metrics collection. An event was stored as an embedded object in an array in a user document. Our hope was that we wouldn’t need to do any joins and we could effectively segment out tracking data super easily by user.
We had fields as arrays that were unbounded and could grow infinitely causing the document size to grow. For some highly active users (and bots), after a few months of tracking data in this way some documents in this collection would hit the 16MB document limit and fail to write any more. This created various performance issues in processing updates, and in our growth worker and ETL jobs because there were these huge documents transferred over the wire. When this happened we had to move quickly to restructure our data.
Moving to a single collection per event type has been the most scalable solution and a more flexible solution.
Reading from secondaries
Some of our ETL jobs read and process a lot of data. If you end up querying documents that haven’t been read or written to recently, it is very possible this may be stored out of memory and on disk. Querying this data means MongoDB will page out some documents that have been touched recently and bring query results into memory. This will then make writing to that paged out document slower. It’s for this reason that we have set up our ETL and aggregation queries to read only from our secondaries in our replica-set, even though they may not be consistent with the primary.
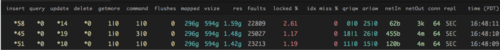
Our secondaries have a high number of faults because of paging due to reading ‘stale’ data
Visualizing results
As I mentioned before, one of the more challenging parts about maintaining our own growth platform is extracting and visualizing the data in a way that makes a lot of sense. I can’t say that we’ve come to a great solution yet. We’ve put a lot of effort into building out and maintaining our growth dashboard and creating visualizations is the bottleneck for us today. There is really a lot of room to reduce the turnaround time. We have started to experiment a bit with using
Stripe’s MoSQLto map results from MongoDB to PostgresSQL and connect with something like
Chart.ioto make this a bit more seamless. If you’ve come across some solid solutions for visualizing event tracking with MongoDB, I’d love to hear about it!
Event tracking for everyone!
We would love to open source our growth platform. It’s something we’re hoping to do later this year. We’ve learned a lot by setting up our own tracking platform. If you have any questions about any of this or would like to have more control of your own event tracking with MongoDB, just hit me up @sunils34.
Want to help build out our growth platform? Buffer is looking to grow its growth team and reliability team!
This post originally appeared on the MongoDB blog.
Try Buffer for free
200,000+ creators, small businesses, and marketers use Buffer to grow their audiences every month.