Up until recently at Buffer, we had a big problem: we were drowning in data.
Buffer is a data-driven company. So many of the decisions we make hinge on data that we collect and analyze. We track and measure analytics data for all kinds of things – user behavior, how our A/B experiments are running, as well as system-generated data such as API logs.
As outlined in this post by Sunil, we have built a pretty robust platform for tracking and measuring data, all powered by Amazon’s SQS and MongoDB.
There did seem to be a missing piece. We were still suffering from metrics debt.
Technical debt can inhibit developers from moving quickly and slow down the pace of innovation. It also causes organisations to lose faith and confidence in their software. In the same manner, metrics debt can slow down your team’s ability to measure and track data, ask the right kind of questions, and be confident that analyses are correct and that you’re not missing any data.
Although it was pretty easy for us to collect and store massive amounts of data, we still had a pretty hard time getting to the insights.
Our data team was always scrambling to keep up with the needs of the company. We wanted to empower anyone at Buffer to analyze and play with our data, but it was hard to do so without writing a lot of code.
We would often narrow down our scope to analyze only very recent data, but we have been tracking some data for over three years. It became increasingly difficult to visualize this information across the lifetime of Buffer.
Why was this the case?
MongoDB
We were relying on MongoDB’s aggregation framework to query and aggregate our metrics data. Many ad-hoc data requests were simple to meet by just querying the growth DB. But this needed a certain level of skill and knowledge of MongoDB. While it was easier for developers to jump in and play with the data, it became a hurdle for other team members. And because we had so much data, running queries on some collections where pretty slow.
Growth dashboard
For more complex and ongoing data needs, we also built a custom growth dashboard site. It’s written in Django and connects to the metrics database. This is where we’ve built some of the more complex daily reporting and tracking screens. Many of these were powered by ETL (Extract, Transform and Load) jobs. These run in the background and update data periodically.
Building something custom is flexible. But it sucks up a lot of developer time to design new ETL pipelines and surface them in the dashboard UIs.
We were fiddling with Javascript charts and nightly jobs that needed a lot of maintenance and support. We realized we would much rather just get quick insights into our data.
The way out
We quickly realized that we might need to look into some tools that are better suited to the job. After investigating various different platforms and technologies, two technologies kept popping up: Hadoop and Amazon’s Redshift.
Looking into Hadoop led us to Mortar, a platform-as-a-service company that helps you get up and running with big data technologies really quickly.
We felt we could start tackling the problems we had with the sheer size of our data using tools like Hadoop and Redshift, but that still meant that data lived in the domain of developers.
That is when we discovered Looker. Looker is a web-based BI platform that aims to make data analysis simple and accessible to everyone, from developer to data analysts and product people. It also runs really well on Redshift, which we were leaning towards using.
Now, how do we shift to Redshift?
All the pieces were starting to fall in to place for us. We were pretty sure that Redshift and Looker would be a great solution for our BI needs, but we were still not sure what would be the best way to transform the huge amount of data to a relational format and load it in to Redshift. After experimenting with MoSQL as well as some homegrown solutions we quickly ran into issues with the size of our MongoDB collections. It would simply take too long to load the data.
Hadoop to the rescue!
We had initially thought of Hadoop and Redshift as competing technologies, but it became clear to us that they could complement each other well.
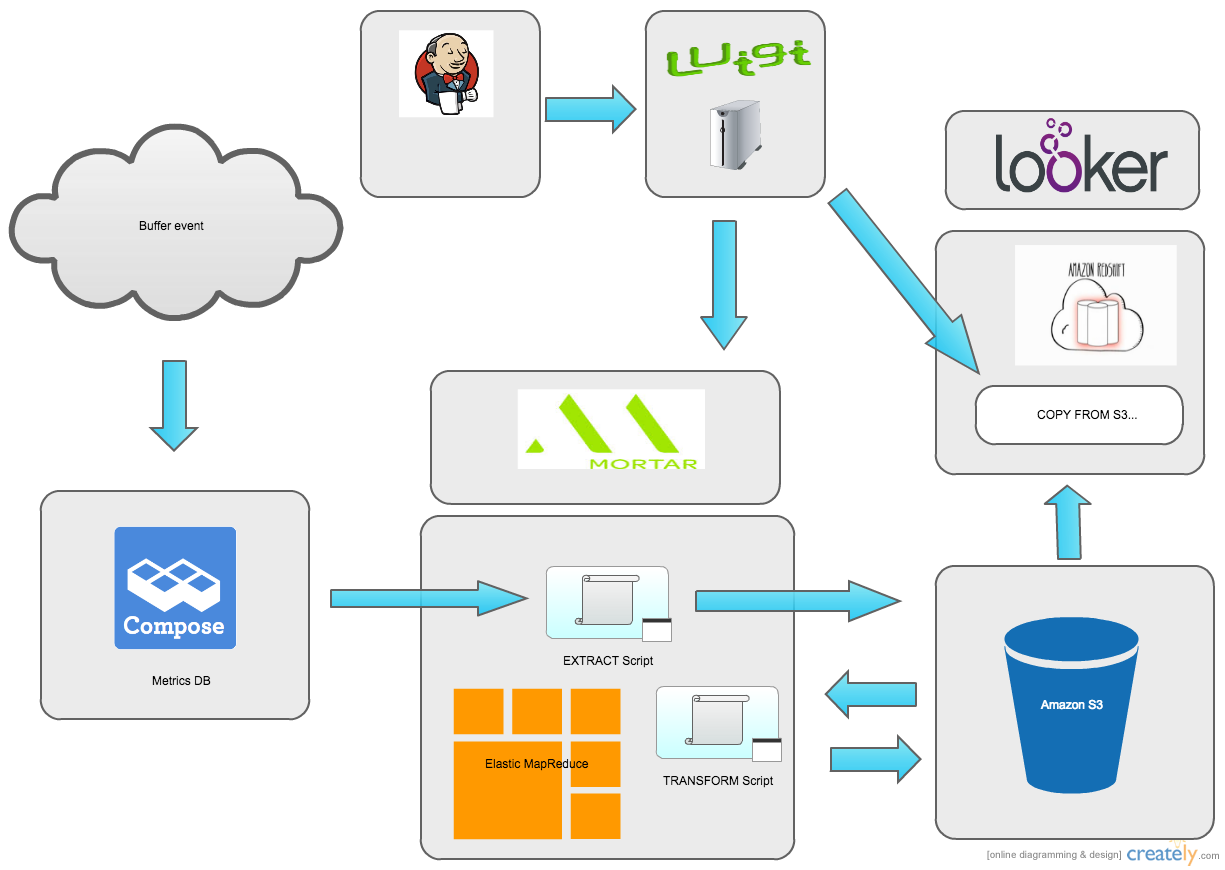
Turns out that Hadoop works really well as an ETL pipeline. Using the Mongo Hadoop connector it’s easy to load data into a Hadoop cluster. From there we can use the Pig scripting language and the power of parallel computing to quickly perform various transforms on the data and save the output to S3. Then we can load it into Redshift using the native COPY command.
Here is an example of how a Pig script to extract data from MongoDB:
https://gist.github.com/michael-erasmus/842735920578702f4b18
This script simply loads the data from MongoDB, filtering on the date field in the collection. It is then outputted to flat tab delimited files in an S3 bucket. From there we could run the transform step. This is the Pig script for that:
https://gist.github.com/michael-erasmus/935c652b281930c07805
Here we have a few more things happening. The data is being loaded from S3, transformed and then stored in S3 again. We run the data through a few transformations to get it ready to be copied into Redshift. Dates are formatted to the default timestamp format, and the value field, which is stored as a bounded array in mongo, is flattened into columns.
Mortar and Luigi
Since we were already using Mortar, it was simple to get started building this ETL pipeline. Mortar has full integration with Luigi, a neat open source framework built by Spotify. It lets you easily build complex data pipelines using Python.
Each step in your pipeline is called a Task. Tasks are usually derived from a base class that knows how to perform its data processing task and monitor its progress. Most importantly, each Task can specify which other Tasks it requires to be run first, which helps Luigi build up a dependency tree of your Tasks and figure out how to run your pipeline.
Our Luigi scripts are modeled after the typical ETL pipeline, with an Extract and Load Task that calls the Mortar API to run our Pig scripts, as well as a Load Task to load data from S3 into Redshift.
We have also tweaked our Luigi scripts to use a common set of base classes for each ETL, to easily share configuration and loading strategies. Here is the Luigi script for the actions_taken ETL:
https://gist.github.com/michael-erasmus/18c59e226f20bae93e51
Here we define Luigi Task classes for the Extract, Transform and Load steps. These class definitions are very declarative, they only need to override a couple of base methods to supply specific configuration for its pipeline. Most of the work here is happening in the base classes, which in turn rely on the built-in Luigi tasks for running Hadoop jobs and loading data into Redshift.
A busy week
All of this fell into place right about the time we had our team retreat in New York. Buffer is a fully remote, distributed team with people in timezones across the world. Every few months, we all meet up somewhere amazing and spend the week working together and getting to know each other better. Our data team embraced this opportunity to flesh out our new data architecture and to see how far we could get in our retreat week.

By the end of the week, we had data running all the way from MongoDB to Redshift and could already start showing off Looker and Redshift to the rest of the company!
Automating the pipeline
Once we had a good way of getting data into Redshift, we needed to automate the process to make sure that our BI database is constantly loaded with the most recent data. We already use Jenkins a lot within Buffer, so it felt like a great fit for automating our ETL scripts.
We set up a periodic Jenkins task that executed a bash script to run our ETLs. This worked great and we didn’t need to kick off ETLs from our developer machines whenever data got stale.
Incremental loads
Initially we were pulling in all the data from scratch every day, overwriting the existing tables in Redshift with new data from Mongo. As you can imagine, this didn’t scale too well. We had to run on very big Hadoop clusters (around a 100 instances) and the whole ETL pipeline would still take hours to finish. What we really wanted was to have a Jenkins job running every hour, only pulling in the most recent data.
This all became possible when we stumbled across a little known parameter that can be set by the MongoDB Hadoop loader: mongo.input.query
This allowed us to filter the input collection to only load documents after a certain date. We tweaked our Luigi scripts to first get the maximum timestamp field value of the latest record loaded in the existing Redshift table. This is passed as a parameter to the load Pig script, which it can use to filter the input collection.
This made a huge change in our loading times. Once we had most of the data in a Redshift table we could incrementally load the most recent documents in less than a minute, using a tiny, two instance Hadoop cluster.
The result
Once we had our BI database with data loaded on the hour, ready to be consumed in Looker, we could start to play ?
Looker uses LookML, a declarative, YAML based language that lets you model your underlying database in Looker. It’s pretty smart at letting you create new models with generators and using the GUI, so modeling data as you need it becomes pretty easy.
After you have your models set up, it’s really easy to explore data by joining, filtering, pivoting and aggregating data. Any dataset result you produce can easily be turned into a variety of different graphs.
Being able to explore data like this changes the way you do analysis.
Lots of fresh insights and novel ways of thinking about and modeling your business. Our product people were really quick to take up Looker and satisfy their own data needs, coming up with amazing insights really quickly:
1/ Here’s cohort chart of @buffer active users. Layer = signup month. Even 2 year old cohorts contribute 2k actives. pic.twitter.com/1zhsp4QgGG
— Joel Gascoigne (@joelgascoigne) October 29, 2014
Creating a chart like this would have taken a lot of time and effort before. In fact, being able to go back three years in time might not have been possible at all! But with the power of Redshift and Looker we where able to graph this in minutes and see results instantly.
Your thoughts?
Building our new data architecture has been an amazing and fun adventure. And we’re really happy with what we’ve ended up with. Having this kind of power and flexibility has really opened up a world of possibilities to explore data science in a new way. It feels like we’ve just scratched the surface of what’s possible and we know that we’ll continue building on what we have right now.
It’s great to be able to share this journey, and we would love to hear what we’ve done wrong or what could be improved in any way.
Please feel free to share your thoughts, ideas or suggestions with us! If you have any questions about any of this or would like just like to know more, just hit me up on Twitter at @michael_erasmus or of the other members of our data team: @sunils34 and @stevenc81.
Try Buffer for free
200,000+ creators, small businesses, and marketers use Buffer to grow their audiences every month.