

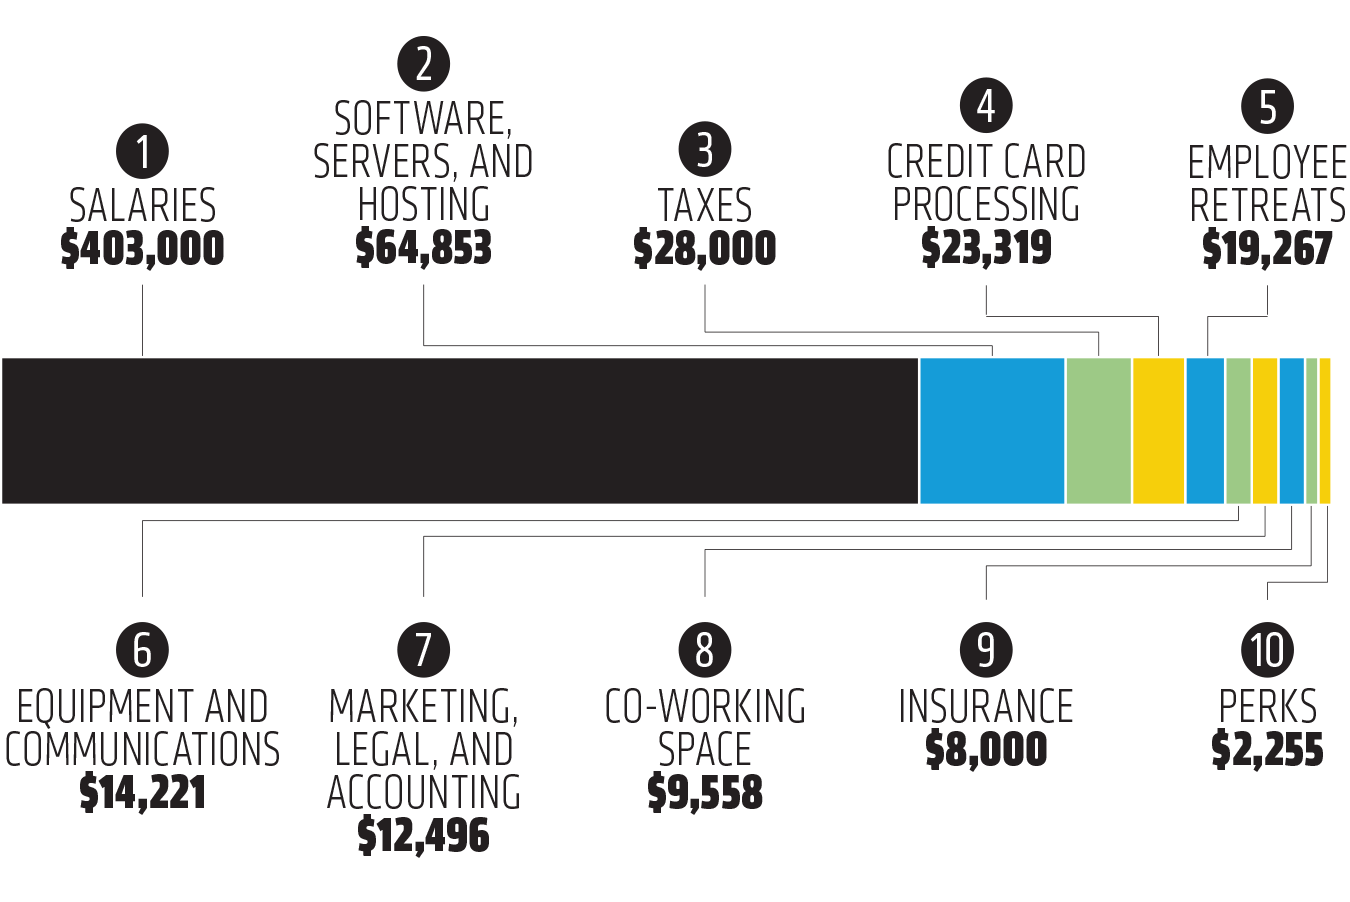
At Buffer we really value transparency. Defaulting to transparency is one of our core values, and we’ve been fortunate to have been involved in some incredible discussions about transparent company cultures as a direct result. For a quick sampler, you can check out our salaries and revenue here, and you can read about the rewards and challenges of building a fully distributed company of 80+ Bufferoos over on the Open Blog.
Transparency through Data
As data analysts, one of our challenges is introducing more transparency to the data analytic process. Buffer’s current structure allows some teams to move very quickly — similarly to an earlier stage startup — by keeping the size of the team small and minimizing stop energy. This means that some teams don’t have a dedicated analyst just yet, which is cool! The product creators are freed up a bit to take larger risks and worry less about smaller optimizations — experimental design and test statistic variance are still important, but perhaps not the most critical at these early stages.
To help these smaller teams — as well as the more “mature” teams — keep up a quick pace, we have been experimenting with building lightweight tools to make data more accessible and testing easier. One recent example is a simple proportion test calculator I built, also using R and Shiny. ?
Wait a Minute…What is Shiny?
To borrow a phrase from Shiny’s site, it’s a web application framework to turn R code into interactive web apps. This simplifies the process so much that even I have been able to contribute to cool projects like Buffer’s Diversity Dashboard!
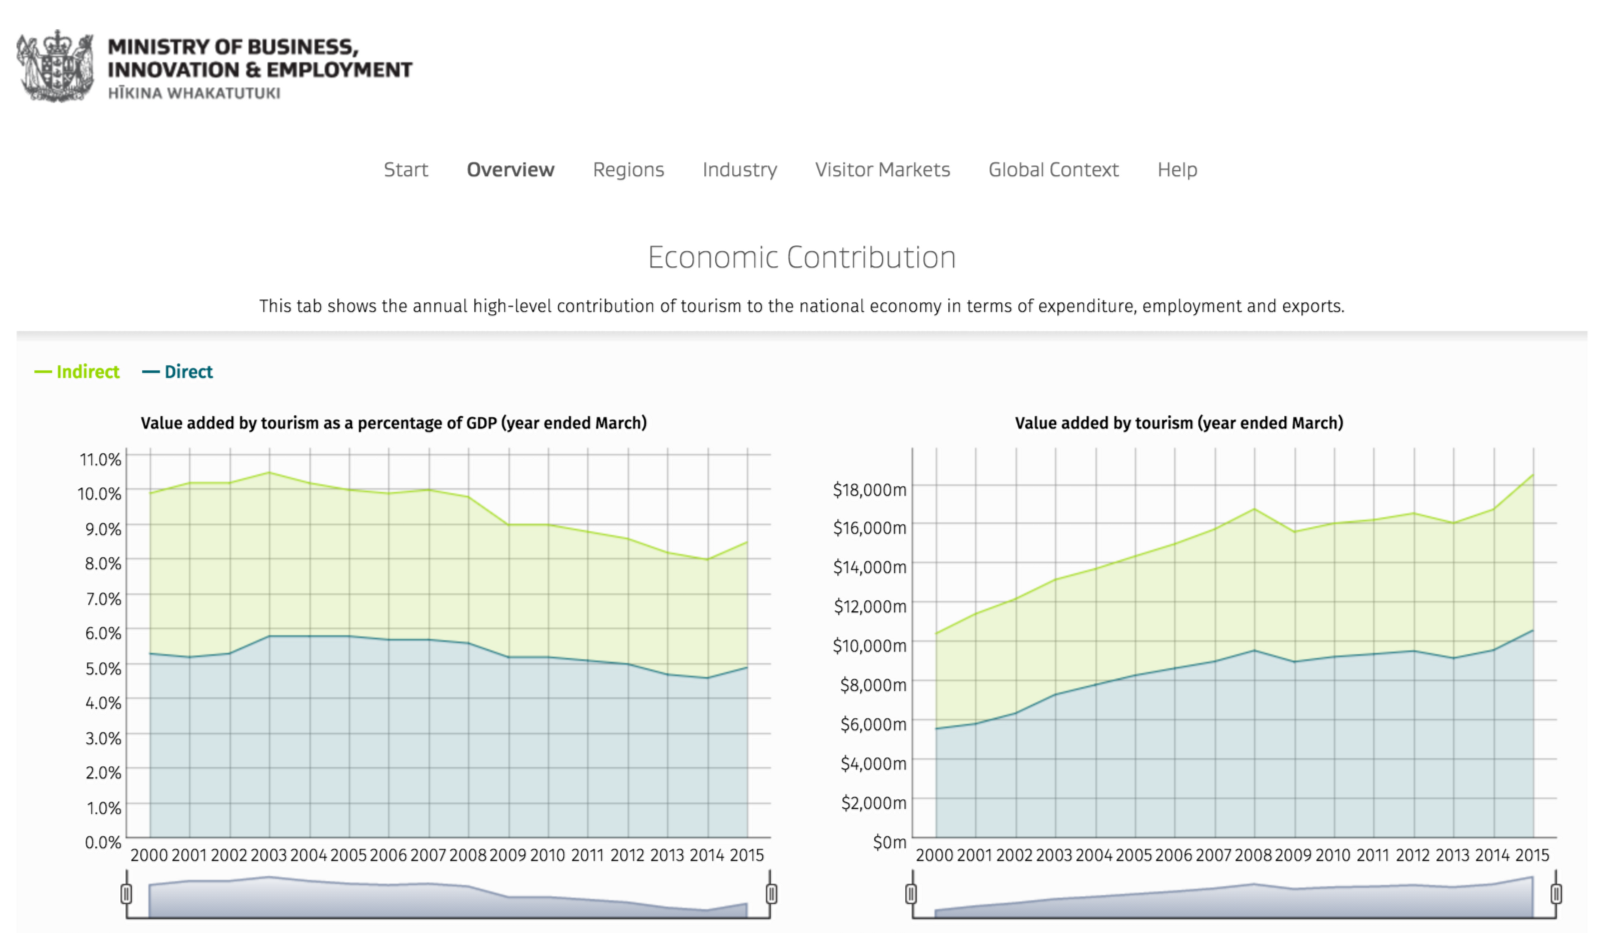
There are a bunch of really cool examples in Shiny’s app gallery – one of my personal favorites is New Zealand’s tourism dashboard. Hurray for R and Shiny! ?
The Forecaster
As a part of the Buffer for Business team, I get to analyze monthly recurring revenue (MRR) fairly often. However, I’ve found that the methodology and results of these analyses haven’t always been the most accessible for the rest of the team. This data could be interesting to the Awesome team, the Marketing team, and anyone else interested in these numbers.
The analyst team is keen on generally being more transparent about analysis (reproducibility is key), so we’ve decided to explore different ways to deliver data to the team. As a consequence, I present to you the very rough first version of an MRR forecaster tool, built with R and Shiny!
How it Works: Getting the Data
The first step was connecting the app to Buffer’s Looker instance using theLookR R package, so that the data is always up to date. The app calls the get_data function, which either queries an existing Look or reads a CSV file, depending on whether the day’s data has already been imported. The data is cleaned and returned as a data frame.
get_data = function(){

 ## Get current date and name file
 day = as.character(Sys.Date())
 filename = paste0(./data/,mrr-,day,.csv)

 if(file.exists(filename)) {

 df = read.csv(filename,header=T)
 df$date = as.Date(df$date)
 df

 } else {

 ## Query Looker’s API
 df = run_inline_query(model = growth, view =  stripe_and_apple_mrr_by_plan_,
 fields = c(stripe_and_apple_mrr_by_plan_daily.day_,
 stripe_and_apple_mrr_by_plan_daily.plan_,
 stripe_and_apple_mrr_by_plan_daily.total_),
 filters = list(c(stripe_and_apple_mrr_by_plan_daily.day_, 365 days)))

 ## Clean Data
 names(df) = c(date,plan,mrr)
 df$date = as.Date(df$date)
 df$mrr = as.numeric(as.character(df$mrr))
 df$plan = as.factor(df$plan)

 ## Write CSV file in data directory
 write.csv(df,file=filename,row.names =F)
 df

 }
Making the Forecasts
To forecast MRR out to the date input, we employ the forecast package in R, using an exponential smoothing state space model.
output$plot1 = renderPlot({
## Get data and create time series object
mrr = dataInput()
ts = xts(mrr$mrr, mrr$date)
if(input$date > max(mrr$date)) {
etsfit = ets(ts)
h = as.Date(input$date,%Y-%m-%d)-max(mrr$date)+20
fcast = forecast(etsfit, h=h)
plot(fcast,main=MRR Forecast)
abline(v = length(mrr$date) + as.Date(input$date,%Y-%m-%d)- max(mrr$date),col=red)
} else {
plot(ts)
}
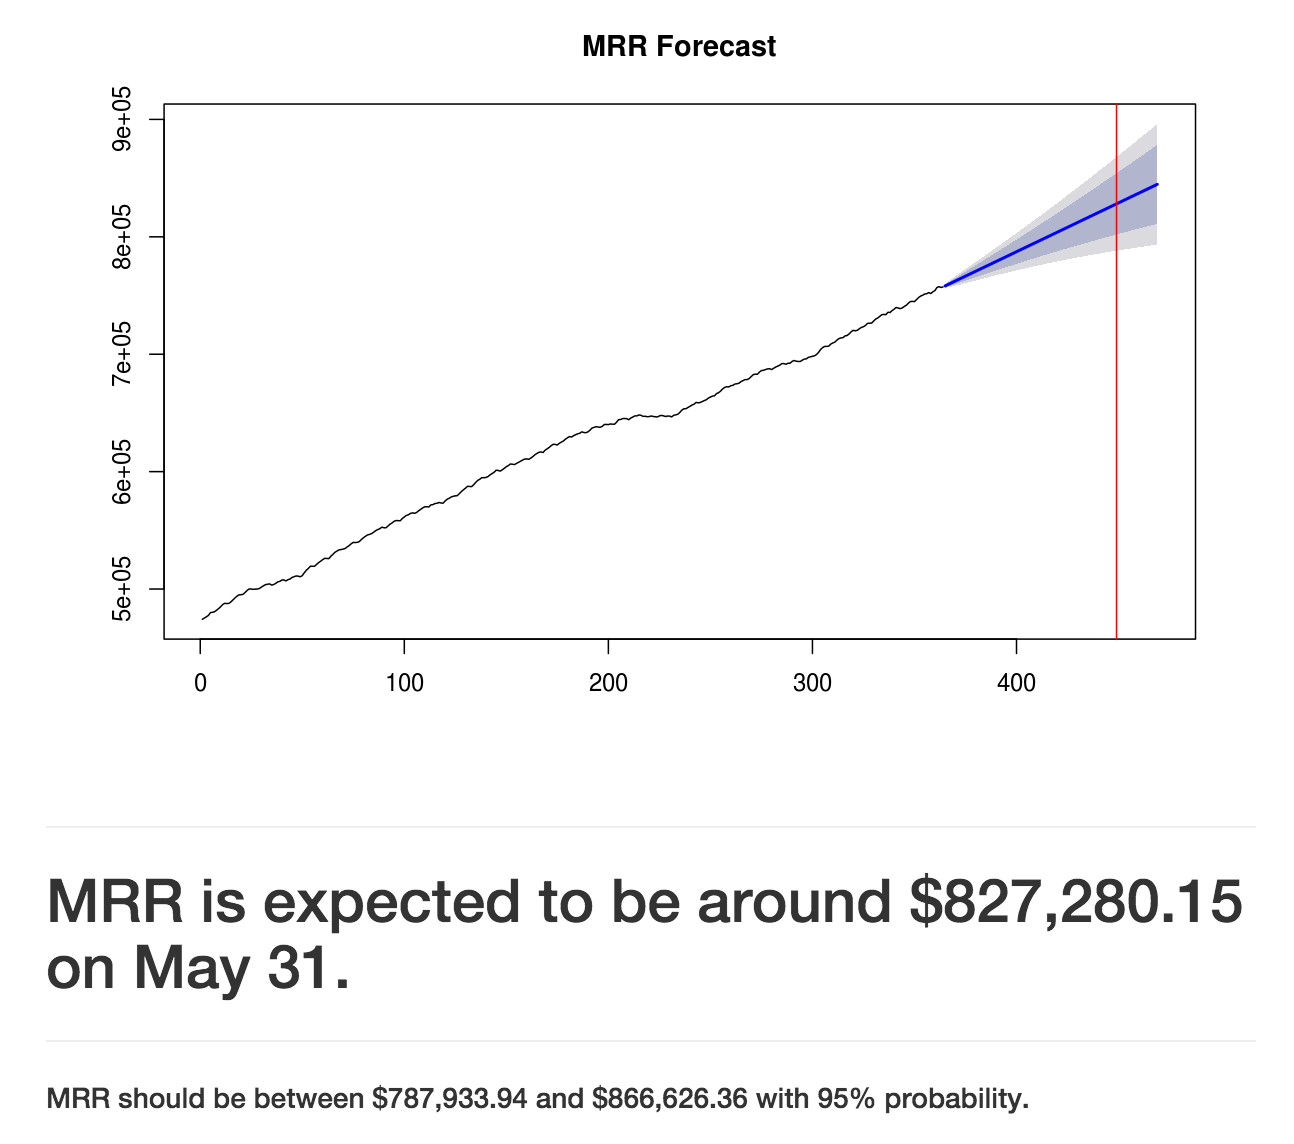
})The resulting output displays the forecast, as well as the 80% and 95% prediction intervals. I know…still a lot of polishing required. ?
What’s Next
There’s still a lot of work to be done. The app runs quite slowly at the moment, and there are a couple updates in the pipeline that should speed things up (like fitting the model only once per day, instead of on every load). Cleaning up the plan names and properly labeling the graphs are also high on the priority list, and I would also love to explore adding additional datasets, such as the more-seasonal updates or DAU data.
In the future, we may be able to build off of this and create a type of anomaly detection method that checks the differences in expected and observed values!
This is still very much an experiment, with the goal being to create a tool that the team finds useful and accessible. There will be some user testing and a fair amount of little tweaks in the near future, and we would also love to open source the code so that anyone interested can see how exactly it’s built!
Whaddya Think?
I’d love to hear any thoughts or feedback! Feel free to leave a comment or reach out on Twitter @julheimer!
Try Buffer for free
200,000+ creators, small businesses, and marketers use Buffer to grow their audiences every month.


