
This week on #bufferchat, “tech humanist” Kate O’Neill (founder of KO Insights) stopped by to share her thoughts about using data to shape experiences. The community discussed how to measure experiences, how to identify meaningful data, what to do when the data doesn’t match your intuition, and much more!
Read on to discover all of the awesome insights that were shared during the chat!
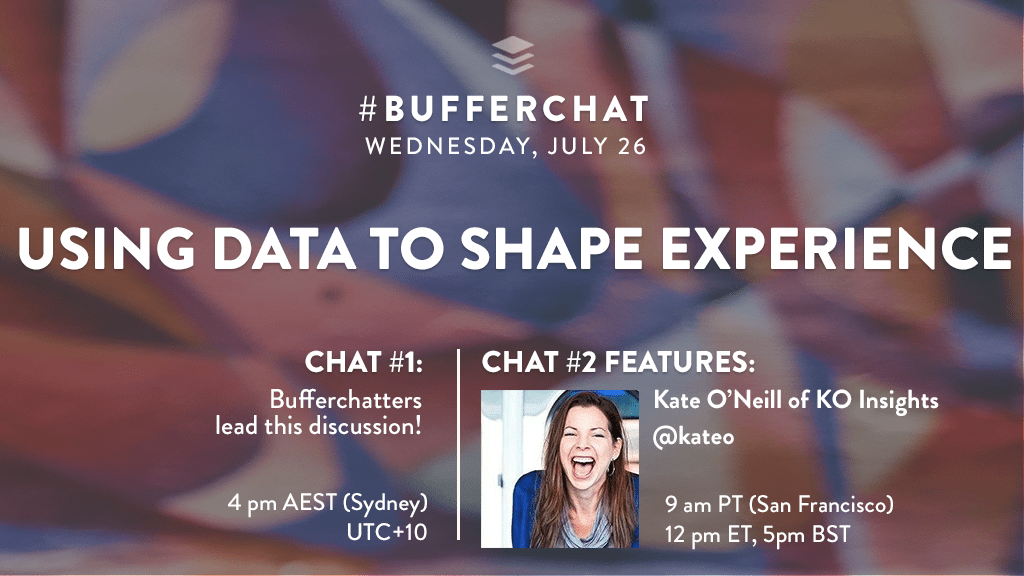
Catch our weekly Twitter chat, #bufferchat, at TWO times every Wednesday for valuable industry insights and to meet hundreds of other smart marketers and social media enthusiasts. Same topic, same place, just at different times – feel free to join in to whichever chat time works best for you!
4 pm AEST (Sydney time)
9 am PT (San Francisco time)
This week’s stats:
Bufferchat #1 (4 pm AEST): 26 participants, reach of 1,061,364
Bufferchat #2 (9 am PT): 111 participants, reach of 1,396,574
Q1: In your field of work, how would you define a “meaningful experience”?
From Kate:
- A meaningful experience is something that resonates, that aligns the creator of the experience & the person consuming it.
- I think of it this way: my education was in languages/linguistics, and there’s this three-part model of communication.
- In this model, the three parts of communication are: 1: speaker’s intent, 2: message itself, 3: what the listener takes away.
- To be an effective/meaningful communicator, you have to think all the way through the message to how listener will receive it.
- Creating meaningful experiences is similar: you create the opportunity to interact in a way that you hope will resonate.
- So it’s about working not just from the brand outward but also from the customer inward, and trying to make their needs align.
From the community:
- “Meaningful experience is when I see my clients succeed, grow and it’s beneficial for their personal & biz development.” @ZalkaB
- “It’s meaningful if it fits a defined user need/story. As a [name] I want to [do something] So I can [achieve my goal] etc.” @ComfortWriter
- “In
#HigherEd, the opportunity for students to grow + make connections beyond themselves.” @FeministSexEd
See all the great answers to question 1 here!
Q2: Following Q1, how could you measure that experience?
From Kate:
- You do have to measure the usual stuff, like clicks and page views and conversions because that’s the transactional stuff, the mechanics, that gives you immediate feedback on whether something is fundamentally broken.
- But if you’re looking for deeper insights, you have to look at less obvious measures and sometimes more complex things.
- As a silly and simple example, I use this example: say you’re trying to sell mattresses. You could just have a sale, or you could, say, stand on a busy street corner as people walk to work and hand out little cups of coffee printed w/ a message. Like “if you’d slept on a SleepAwesome mattress you wouldn’t need this coffee.” With a dedicated URL and/or QR code.
- It would at least have a chance at resonating, and you could bring people into a coffee-themed sleep experience. (I love coffee. ☕️)
- Not just because it’s catchy or clever; it’s about meeting the customer where they are. Then measuring and improving. More in line with unique characteristics of the brand, experience, & context. I’ll hit this a little more with the next Q/A.
From the community:
- “Long-term engagement and customer loyalty. Once you bring someone into your ecosystem, do they want to stick around?” @emmaemail
- “With
#SMARTgoals you’ll never have to wonder if an experience is in line w/ your campaign goals, you already mapped it out!” @BruceKennedy1 - “Truly meaningful experiences don’t end — the relationship will continue to grow. And THAT is how you measure your success.” @ImAGirl_YouKnow
See all the great answers to question 2 here!
Q3: How do you know what data is meaningful data and what isn’t?
From Kate:
- Well, generally speaking, data isn’t meaningful by itself, it’s meaningful in context. So you have to understand the context to understand what will be meaningful within it.
- I think a great parallel framework is in Jim Collins’ classic Good to Great, about finding your “profit-per-x denominator.” It’s about knowing what truly makes your business grow. It isn’t profit, per se; it’s profit as relates to some other measure.
- Thinking dimensionally like that is how you grow meaningfully, and in a similar way. Thinking dimensionally about what makes an experience meaningful helps you shape them that way.
- E.g. not profit per purchase, but profit per purchase or profit per repeat purchaser. Something more meaningful than profit.
From the community:
- “Create well defined goals / measurements and the stream of data that would help you focus on right dataset.” @BGelbendorf
- “If it impacts your customer and your business’s future decisions.” @jenfwright
- “Determine the key performance indicators by what is important to your business mission/vision, bottom line.” @pjervis
See all the great answers to question 3 here!
Q4: What’s an example of how data can be used to impact someone’s experience?
From Kate:
- There’s a huge range of ways that it can happen, but in practice let’s boil it down to manual vs. automatic implementation.
- Data comes in passively through tracking; someone may see and recognize an opportunity, then manually change an experience. AND/OR data comes in and actively shapes experience through predictive means.
- Algorithms have been shaping experiences for years (even since my Netflix days), and AI will be doing this more and more.
- On that: for some time we’ll need humans and machines to collaborate, in a sense, to get the most out of both kinds of data.
- Our surroundings are increasingly shaped by data through IoT, wearables, beacons/sensors, self-driving cars, voice assistants.
- The opportunity for marketers, strategists, etc is to think holistically about experiences, campaigns, landing pages, whatnot.
- And how they fit this larger context, and design them with intention so they shape the experiences we really want to shape.
From the community:
- “You can use data to create a more personalised experience tailored to the wants, needs & context of the individual.” @NeilMilliken
- “Knowing what your audience or consumer needs and when to help before they even do.” @ItsJeffHiggins
- “Use data on your customer journey to improve process, perfect service, personalize, innovate, design thinking etc.” @CardozaGab
See all the great answers to question 4 here!
Q5: What do you do when your data tells you something different from your intuition?
From Kate:
- Ha, oh sure, that happens in a bunch of ways, right? All the time.
- If you’re, say, A/B testing a message & you’re SURE that one variant will win but another one does, you can do a few things. One is just run with it. Push the winner out, move on. But you can also see it as a learning experience, adding to knowledge.
- And here’s the thing: that’s what marketing is. Or should be. Marketing is at its best when it’s a knowledge center. Marketing should be the repository of knowledge about customers, market, competitive landscape, trends, culture, everything. All parts of the organization should contribute to that collection of knowledge, & all parts of the org should draw from it. Experience design, data strategy, all customer interactions need to inform and be informed by this body of knowledge.
- That’s how I think it works best in the ideal, but it’s hard to make that happen in practice.
- It takes an iterative, disciplined approach to learning and cultural change in most orgs to make them eventually resemble it.
From the community:
- “You have to remember, that while data may not tell the whole picture, it doesn’t lie. All you can is ?? how it was gathered.” @Renoe
- “If your intuition is wrong, it becomes a learning opportunity; what is different, how can you evolve and adjust as a result?” @JMattMke
- “That’s the point! Drill down and get to the root of what’s causing the variance, then question EVERYTHING.” @maxthemarketer
See all the great answers to question 5 here!
Q6: What do you do when the data reveals something undesirable?
From Kate:
- Well, the easy, obvious answer is to follow the money and pivot towards the successful outcome. But… you do have the choice to go with what you wish that data had shown. But now you know what it’s costing you to do that.
- If you prefer the alternative, like if somehow what you perceive as the integrity of the brand means more to you than the incremental lift or hit you’ll get from aligning with what the data shows, that’s a choice you actually can make.
- I had a CEO client do that once. In a big redesign, there was an issue with getting all the landing pages redone & launched, and he wanted to introduce a more unified landing page template than what had evolved over time with the previous designs.
- So we tested the impact of doing that, and it turned out it’d be a pretty big cost over the time it would take to optimize. But since he understood the costs we presented to him, he decided to take the hit for the sake of brand consistency.
- There was nothing irrational about that CEO’s decision: he had the data, he knew the tradeoffs, he made the call. I love that story now, because it really shows how misleading the phrase “data-driven” can be. Data doesn’t have to *drive* your decisions, per se; it really should just inform them.
- Data can be really empowering if you don’t feel limited by it or bound to it.
From the community:
- “Learn from it. We tend to always seek data that confirms assumptions, but the learning is in finding something unexpected.” @maikegrk
- “Data can really help you to change anything undesirable because you’ll know the root cause and can prevent it in the future.” @wanderwomanmoe
- “Go back to look at overall trends. There’s comfort in seeing how far you’ve come, even if there’s a recent dip in results.” @mindvolt
See all the great answers to question 6 here!
Q7: What are great resources for learning more about collecting meaningful data?
From Kate:
- Jim Collins’ business classic Good to Great is a must-read anyway but especially the bit on profit-per-x denominator. (image from tweet here)
- That screenshot is from this article about the “hedgehog concept” which is an excerpt from the book.
- And, of course, I’ll add: read my book. Please. ? Pixels and Place: Connecting Human Experience Across Physical and Digital Spaces
- There’s a passage about measuring meaningful experiences across digital and physical spaces that applies here: [see excerpt here]
- All of this to say: It’s worth all of us thinking more deeply about. The easy measures are rarely most insightful.
- We can do better to create more meaningful experiences, and we should. With AI growing, our future depends on it, no kidding.
- Last thought: I often say “analytics are people.” It’s important to remember the human needs in the data you’re optimizing. ❤️
From the community:
- “Relevant to our use of Buffer
@OutYouth – Loving this book on#nonprofit#socialmedia measurement: ‘Measuring the Networked Nonprofit: Using Data to Change the World‘. ” @thelonestardiva - “Analytics for social and Google, plus case studies from
@marketingcharts and tips from@ZestisApp and@GrowthHackers ?.” @Pacific54 - “No shortage of FREE online courses from great institutions on survey methodology, data collection/cleaning/analysis
#AskAPhD.” @ARoberts021
See all the great suggestions for question 7 here!
Thank you so much to Kate and our awesome community for sharing such great insights in this chat!
Do you have any comments or answers to these questions? Leave your thoughts in the comments! We’d love to hear from you!
Image sources: UnSplash
Try Buffer for free
200,000+ creators, small businesses, and marketers use Buffer to grow their audiences every month.