

We recently shared about our transition from legacy code to clean architecture, where we’ve also begun to introduce testing to our project in the form of both Unit and Instrumentation tests. The introduction of these tests will help us to build a more stable product, boosting our confidence in the features that we ship.
But why are we talking about coverage?
Well, not only does this help us to measure how thoroughly tested our code is, but it’s also helping to act as a way to track our progress in the big refactor of our app. To help us with this we’re making use of two tools, these are:
- Jacoco – a code coverage plugin that will generate reports that we can use for coverage analysis
- Sonarqube – a platform that allows you to track metrics for projects such as technical debt, bugs, code coverage, etc.
The best way to learn about both of these is to set up both of the tools, run your tests and send the reports to Sonarqube – then you are free to explore your analyzed project from within Sonarqube.
The focus for today though is test coverage – and once you’ve sent the reports to Sonarqube, you’ll be able to see something a little like this:
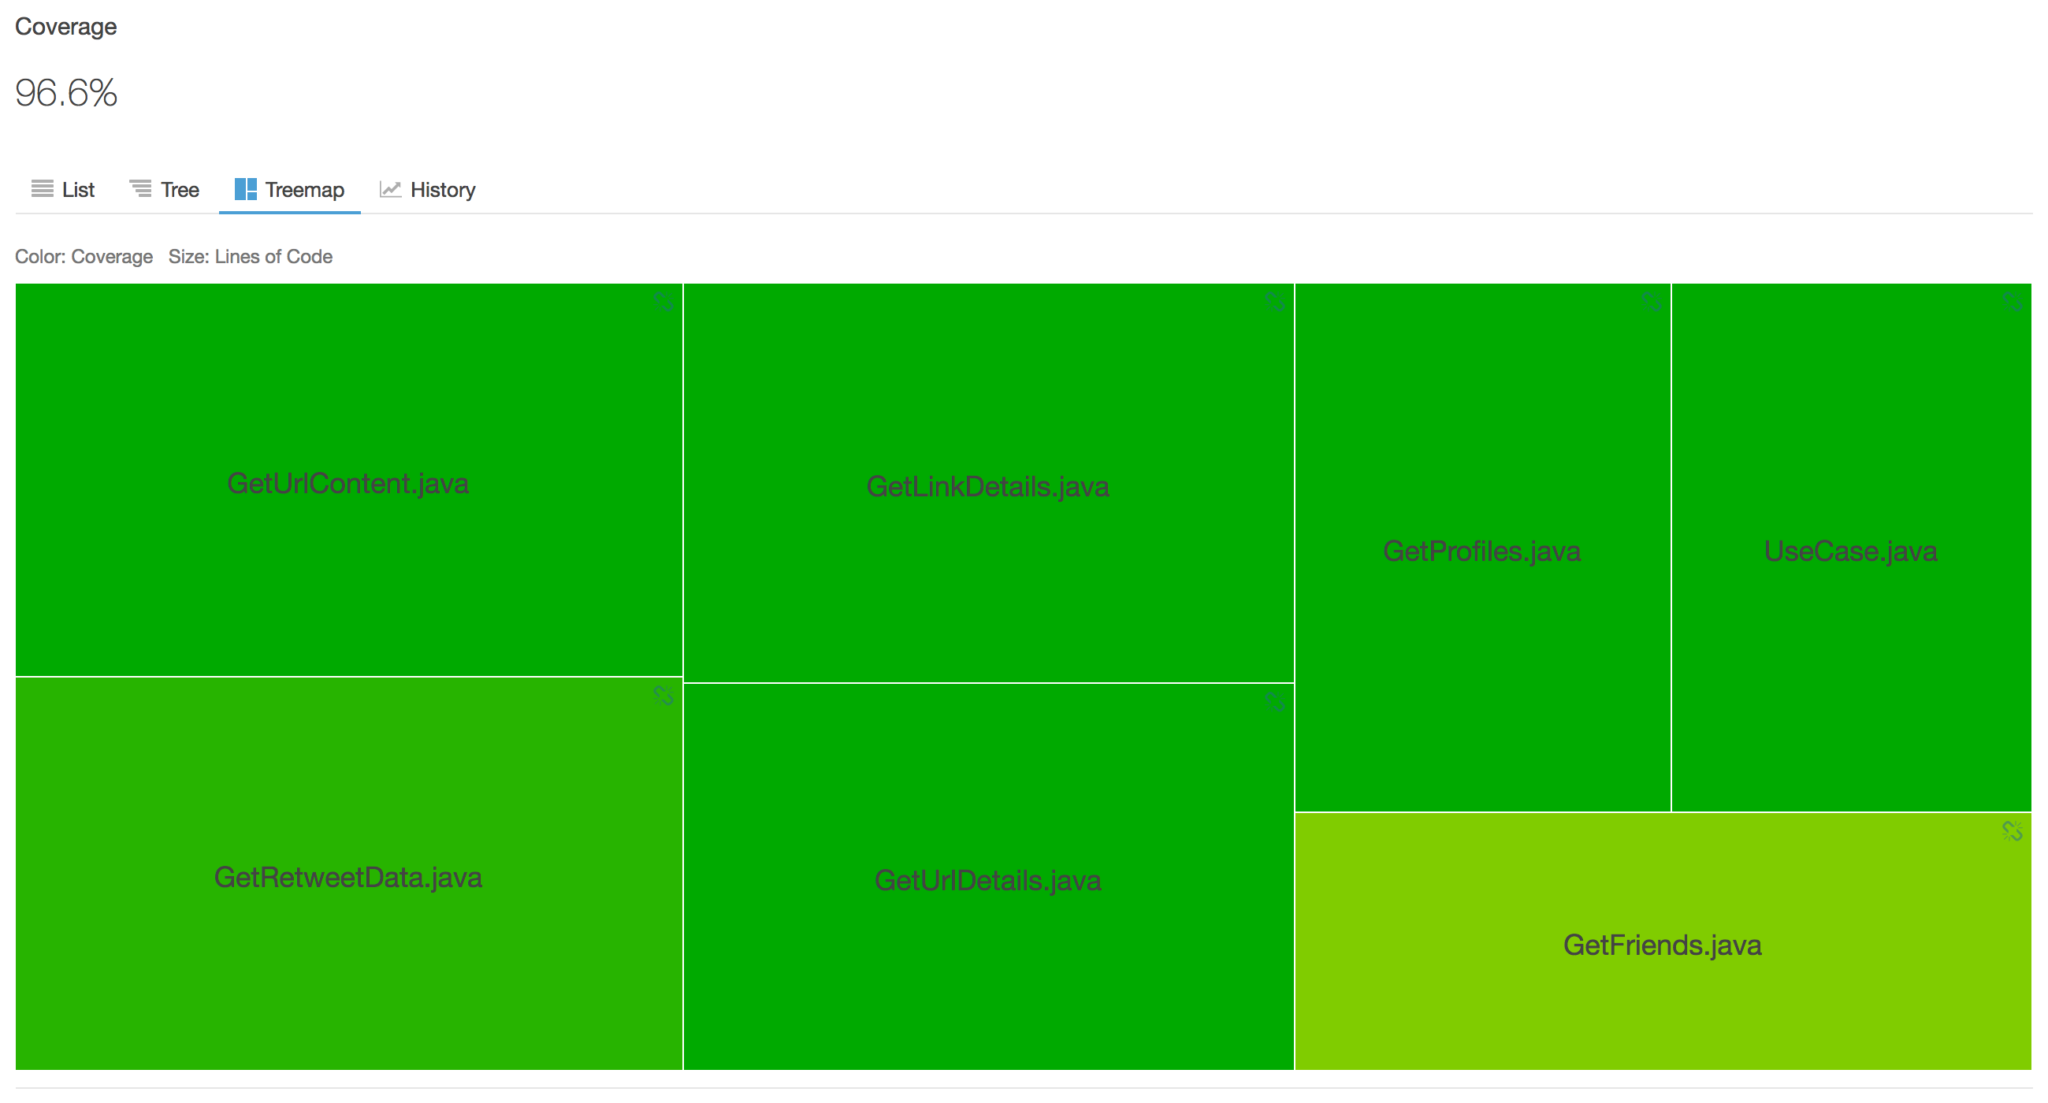
This is great, right? Within Sonarqube you can explore packages to see the coverage for each, as well as coverage for each class inside of that package. Each Package/Class will give you a coverage level both in terms of a percentage and a color (red to green, which is great for glancing over).
Whether you already have tests in place or you’re just starting to add tests, introducing coverage is a great way of learning how well tested your code is and finding areas in which you can improve. We’re now going to take a look at how we set this up in our project. Follow along if you wish to start tracking the code coverage for your project ?
Setting up Jacoco for Unit Test Coverage
To begin with, we need to add the plugin at the top of our app-level build.gradle file:
apply plugin: 'jacoco'This plugin gives us access to the jacoco tool, allowing us to create reports for our tests when they are run.
Note: As of Gradle 2.2 we are required to add the following test options to our build.gradle file also, this enables coverage for tests found in our src/test/java directory.
android {

...

    testOptions {
        unitTests.all {
            jacoco {
                includeNoLocationClasses = true
            }
        }
    }

...

}
Finally, we need to configure the generation of our code coverage reports. We created the gradle task below to handle this:
task createTestReport(type: JacocoReport, dependsOn: ['testDevDebugUnitTest']) {
    group = "Reporting"

    reports {
        xml.enabled = true
        html.enabled = true
    }

    def fileFilter = ['**/R.class',
                      '**/R$*.class',
                      '**/BuildConfig.*',
                      '**/*$ViewInjector*.*',
                      '**/*$ViewBinder*.*',
                      '**/*$MembersInjector*.*',
                      '**/Manifest*.*',
                      '**/*Test*.*',
                      'android/**/*.*']
    def debugTree = fileTree(dir: "${buildDir}/intermediates/classes/dev/debug", excludes: fileFilter)
    def mainSrc = "${project.projectDir}/src/main/java"

    sourceDirectories = files([mainSrc])
    classDirectories = files([debugTree])
    executionData = files("${project.buildDir}/jacoco/testDevDebugUnitTest.exec")
}
Let’s take a quick look at what everything here is doing:
- reports – These are the different report file formats that we have enabled jacoco to create reports for
- fileFilter – This is a collection of files that we wish to exclude from our coverage reports. This is extremely useful for removing any classes generated by Dagger, as well as any Test and framework classes from the test coverage.
- debugTree – This is a variable for the location of the .class files for your project
- mainSrc – This is a variable for the location of our projects main directory
- sourceDirectories – Used by jacoco to collect java files for analysis, here we’re giving it the path stored in our mainSrc declaration
- classDirectories – Used by jacoco to collect class files for analysis, here we’re giving it the path stored in our debugTree declaration
- executionData – Used by jacoco to save the results of the report generation, this must have the .exec extension but you can decide the path
Now, if you run the gradle task we’ve just created, you’ll see that your unit tests will run and jacoco .exec file will have been generated at the path given for the executionData property.
Adding Coverage Reports for UI Tests
Now we have Jacoco creating coverage reports for our Unit Tests, we’re now going to add some coverage for our User Interface tests also. Luckily for us, there is already a gradle task called createDebugCoverageReport – this will run your UI tests on a device and then create a coverage report from the results. Because of this, we’re going to add it as a dependsOn task to the createTestReports task that we previously created:
task createTestReports(type: JacocoReport, dependsOn: ['testDevDebugUnitTest', 'createDevDebugCoverageReport']) {Once the tests have run, a code coverage report will be generated and placed into a directory within your build directory, this will be something like:
your-app/build/outputs/code-coverage/connected/This will be an .ec file with the name of the device that the tests have been run on and there will be a file generated for each of the devices that the tests are run on. For coverage, we only really care about reading a single coverage report as this coverage will be the same for each device. Because of this, we use the following commands to extract a list of files in the directory where the reports are generated and grab the first one’s filename. We store this name in the instrumentationFileName for use when we send the reports to sonar.
def files = fileTree("${buildDir}/outputs/code-coverage/connected/flavors/DEV/").filter { it.isFile() }.files.name
instrumentationFileName = "${buildDir}/outputs/code-coverage/connected/flavors/DEV/" + files[0];
And altogether within our createTestReports task, this looks like below:
task createTestReports(type: JacocoReport, dependsOn: ['testDevDebugUnitTest', 'createDevDebugCoverageReport']) {
    group = "Reporting"

    reports {
        xml.enabled = true
        html.enabled = true
    }

    def fileFilter = ['**/R.class',
                      '**/R$*.class',
                      '**/BuildConfig.*',
                      '**/*$ViewInjector*.*',
                      '**/*$ViewBinder*.*',
                      '**/*$MembersInjector*.*',
                      '**/Manifest*.*',
                      '**/*Test*.*',
                      'android/**/*.*']
    def debugTree = fileTree(dir: "${buildDir}/intermediates/classes/dev/debug", excludes: fileFilter)
    def mainSrc = "${project.projectDir}/src/main/java"

    sourceDirectories = files([mainSrc])
    classDirectories = files([debugTree])

    executionData = files("${project.buildDir}/jacoco/testDevDebugUnitTest.exec")
    def files = fileTree("${buildDir}/outputs/code-coverage/connected/flavors/DEV/").filter { it.isFile() }.files.name
    instrumentationFileName = "${buildDir}/outputs/code-coverage/connected/flavors/DEV/" + files[0];
}
So now if you run this task you’ll find that your unit tests will run, followed by your Instrumentation Tests. Once both are complete (and passing!) you’ll notice that reports will have been generated in the directories that we stated.
Setting up Sonarqube
Sonarqube is fairly simple to setup and can be done so by following the instructions on this link. Setting up a local instance is great for trying out Sonarqube and working out if it fits your workflow. Then once you’re ready, it’s really simple to switch to a server instance as you just need to change the Sonarqube instance you’re pointing to once it’s been setup!
Configuring Sonarqube
Now we have our code coverage all configured, it’s time to configure Sonarqube so that we can view our coverage reports.
First, we need to add the Sonarqube plugin declaration to our build.gradle file:
plugins {
    id "org.sonarqube" version "1.2"
}
Next, we need to define a collection of properties that will be used when we send our reports to Sonarqube. To do so, we need to place these declarations within our app-level build.gradle file:
sonarqube {
    properties {

        property "sonar.host.url", "url-to-your-sonar-instance"
        property "sonar.username", "your-sonar-username"
        property "sonar.password", "your-sonar-password"

        property "sonar.projectKey", "key-for-your-project"
        property "sonar.projectName", "Some Project Name"
        property "sonar.projectVersion", "${version}"

        property "sonar.sources", "src"

        property "sonar.java.source", "7"

        property "sonar.android.lint.report", "build/outputs/lint-results.xml"
        property "sonar.java.binaries", "build/intermediates/classes/dev/debug"
        property "sonar.jacoco.reportPath","build/jacoco/testDevDebugUnitTest.exec"
        property "sonar.jacoco.itReportPath", instrumentationFileName
    }
}
Let’s take a look at what the key properties here are used for:
- host.url – This is the URL pointing to your sonarqube instance. If you’re running a local instance of sonarqube, then this will be “localhost:9000”
- username – The username used to access your sonarqube instance
- password – The password used to access your sonarqube instance
- projectKey – The key for your project, this is unique and is used by sonarqube to identify your project
- projectName – The name displayed for your project in sonarqube
- android.lint.report – The path to android lint reports for your project
- binaries – The path pointing to .class files used for analysis.
- reportPath – The path pointing to your unit test coverage report
- itReportPath – The path pointing to your instrumentation test coverage report. You’ll notice here that we’re using the instrumentationFileName path that we declared earlier. This is the filename of the single instrumentation test coverage report that was generated from our createTestReports task
Once you’ve set all of these properties to their corresponding values, you’re all set to run the sonarqube task and send your coverage reports to your sonarqube instance ?
We’re now covered!
So now we have coverage reports generated for all of our tests and Sonarqube is configured we’re able to send our reports to sonar. We can easily do this by running the following command:
./gradlew clean sonarqubeHowever, we decided to extend on this command so that it depends on our createTestReports task. This way our tests will run, reports will be generated and then uploaded to sonar within a single task. To achieve this yourself, simply add the following to your app-level build.gradle file:
tasks.sonarqube.dependsOn createTestReportsRunning the sonarqube command this time around will now run your tests and generate the reports before sending them to sonarqube ?
Note: Whilst choosing our instrumentation server setup, we put together a little script that will prompt you to run the tests locally and push to sonarqube if you choose to do so. You can check this out on our Github page here!
#!/bin/sh

# Show a dialog to ask if UI Tests should be run and results pushed to Sonarqube
RUNTESTS="$(osascript -e 'display dialog "Do you want to run UI Tests and Sonarqube?" buttons {"Yes", "No"} default button "No"')"

if [ "$RUNTESTS" = "button returned:Yes" ]; then
    # If Yes then run the gradle task
    echo "Alright, running tests."
    ./gradlew clean sonarqube --continue
else
    # If no then just continue to git push
    echo "No, not running tests."
fi
Over to you
We hope this post has been of use to you! We’d love to hear about how you’re using test coverage within your project setup ?
Try Buffer for free
200,000+ creators, small businesses, and marketers use Buffer to grow their audiences every month.


