We have Google Analytics installed on all the Buffer blogs (Social, Open, Overflow, and certainly also Happiness in the future). I imagine you might have it installed, too.
And though I could be in a much better habit of checking GA often, I am grateful to know that all the stats are there for me, whenever I choose to look.
The next question, then: Where should I be looking for helpful social media stats in GA?
There’s just so much to look at, with so many new and unusual titles. I’ve done my best to research and ask around about the best advice for social media marketers using Google Analytics. Here’s what I found to be the five most useful reports that you can set up quickly and let run forever.

1. Traffic by social channel
See your most valuable networks, plus the up-and-comers
Where to find this report:
Acquisition > Social > Network Referrals
What this report tells you:
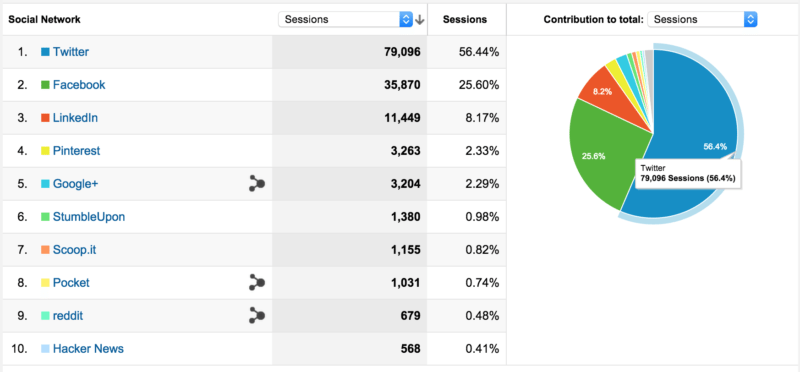
At-a-glance, you can see which social network sends you the most visits to your website. For instance, Twitter sent the Buffer blog 79,096 visitors last month.
You can view the data in a pie chart to see how the networks break down as an overall percentage of social traffic to your site. For instance, Twitter accounted for 56 percent of social traffic to the Buffer blog. Twitter and Facebook combined accounted for 81 percent.
You can expand the results to show 25 or 50 channels, then change the date range to include a comparison to last period. Voila! Now you can identify networks beyond your main ones that are beginning to send you more and more traffic. For the Buffer blog, we’ve noticed StumbleUpon and Hacker News seem to be on the rise.
Advanced:
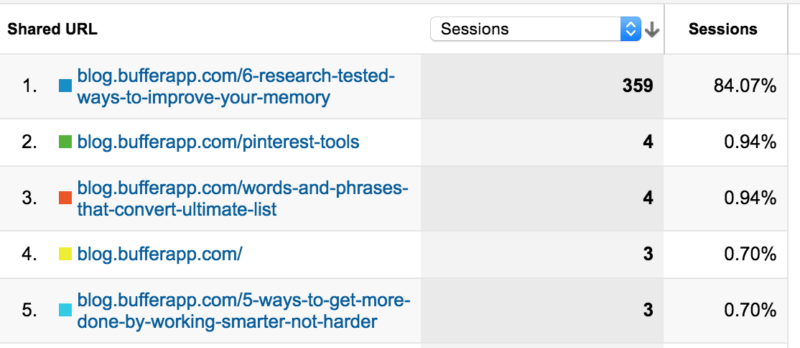
If you click on the individual network name in this report, you can see a breakdown of all the links of yours that have been shared on that network.
2. Social media traffic
See how much social media contributes to your overall visits
Where to find this report:
Acquisition > All Traffic > Channels
What this report tells you:
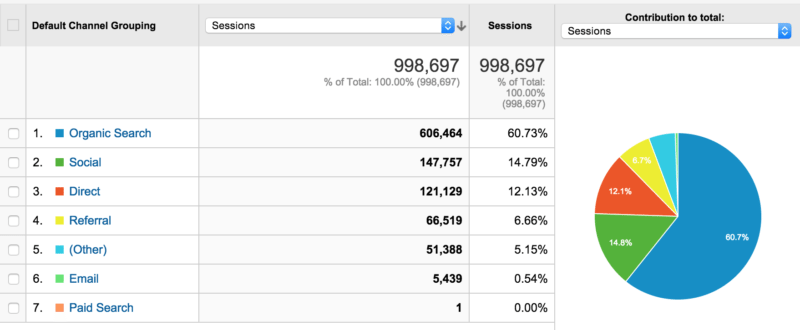
You can see your traffic sources at a high-level:
- Organic search (people clicking through from Google)
- Social (Twitter, Facebook, social visits)
- Direct (people typing your site in their browser or bookmarks)
- Referral (people clicking links from other sites to get to you)
- Paid search
- Other
With this info, you get a great sense of the importance of social media for bringing people to your site. If you ever need justification for focusing on social media, this report is it!
For the Buffer blog, we see 15 percent of our traffic from social, which accounts for nearly 150,000 visits each month.
Advanced:
Under the Acquisition > All Traffic category, you can click to view the Source/Medium, which will show you a granular break down of the search, social, and referral traffic. For a quick hack into your mobile vs. desktop traffic, look at how each social network URL is abbreviated. Twitter on mobile is represented by t.co, and desktop is twitter.com. Facebook on mobile is represented by m.facebook.com, and desktop is facebook.com.
In addition, to see the mobile vs. desktop traffic breakdown, you can add a Secondary Dimension to any view (by clicking the Secondary Dimension button at the top of any table). Type in “Mobile” and select “Mobile (Including Tablet).”
3. Landing pages
Where to find this report:
Acquisition > Social > Landing Pages
What this report tells you:
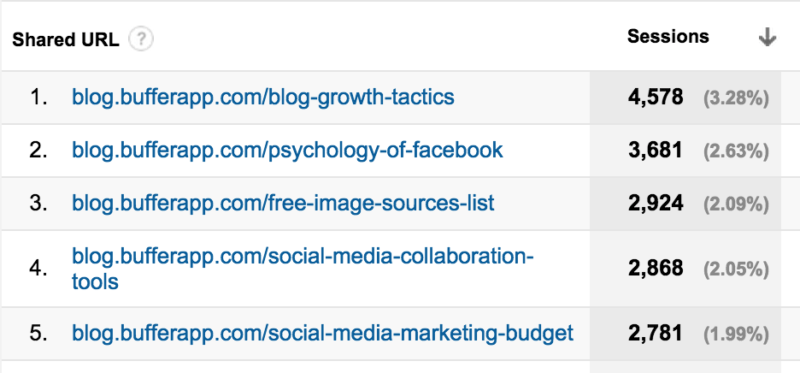
Use this report to see your website pages that get shared most often on social media. For the Buffer blog in the past 30 days, our most-shared story is Andrianes Pinantoan’s guest post about Canva’s growth strategy.
Advanced:
You can click any link in this report to see the specific breakdown of networks where this content was shared.
4. Multi-channel reports
Where to find this report:
Conversions > Multi-Channel Funnels > Overview
This report will work if you’ve got Goals set up for your website. (See below.)
What this report tells you:
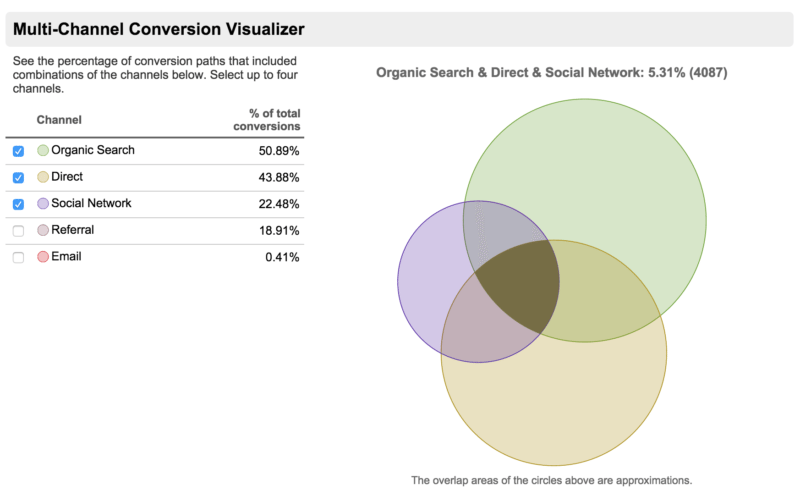
The Venn diagram you’ll get on this report page shows the various paths that people take to convert through your website or blog. For example, on the Buffer blog, a good majority of people convert after coming to the site from organic search. A smaller—but still significant—portion convert after coming directly or clicking on a link from social media.
The overlap in the Venn diagrams represent visitors who might, for instance, click a link in a tweet first, then come back to the site directly later on to go through the conversion flow. And Google Analytics tracks all this, all the way through!
Advanced:
Further down into the Multi-Channel Funnels, there are some neat reports:
- Top Conversion Paths
- Time Lag
- Page Length
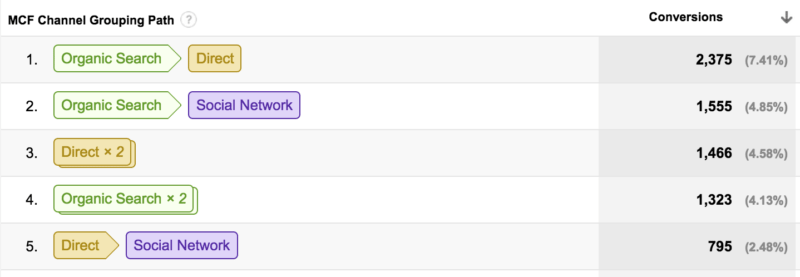
For Top Conversion Paths, you can see the frequency with which visitors take certain routes to conversion. For instance, I can see in my report that the most common path is a person visiting my site directly two times before converting. The top social path is a visit or two from social first, then a direct visit.
You can change the view here also by clicking on “Source/Medium Path” at the top of the chart to see the specific social networks involved in the conversion flow.
For Time Lag, you can see how many days come between first visit and conversion.
For Path Length, you can see a breakdown of how many paths are involved in each conversion typically. For my blog, the vast majority (75%) convert after one visit.
5. UTM campaign results
Where to find this report:
Acquisition > Campaigns
What this report tells you:
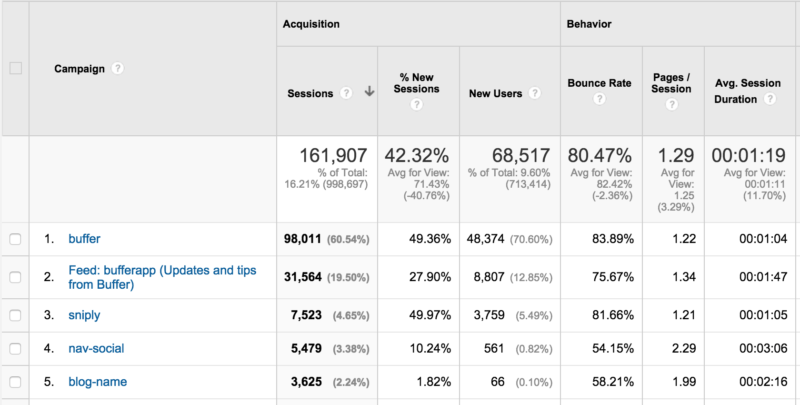
If you’re running a social media campaign, you can append the URLs you’re sharing with a UTM parameter, a bit of text that goes at the end of your link. Google’s free URL Builder is perhaps the simplest way to set these up.
If we were running a campaign for a bufferchat, we could change this link:
https://buffer.com/resources/free-marketing-tools
to this:
https://buffer.com/resources/free-marketing-tools?utm_source=twitter&utm_medium=tweet&utm_campaign=bufferchat
When setting up the new URL in Google’s URL Builder, just make note of what you’re calling the “Campaign Name,” as this is how you’ll find the results in your Google Analytics reports.
The value here is that you’ll then be able to track how many visits this campaign sent back to your website as well as what happened to these visitors once they landed. How long did they stay? Did they convert? Etc.
Advanced:
Within the Campaigns report, you might notice the term “buffer” popping up. When you share a link from Buffer, we automatically add a UTM parameter to the shortened URL so you can easily track the impact of your social sharing via Buffer. You can override these campaign settings by creating custom UTMs in your Buffer dashboard.

How to Set up Goals and Advanced Segments
The above five reports are excellent and great and wonderful, and to make things really powerful you can go through a few quick steps to add Goals and Advanced Segments to your traffic stats to make things even more targeted and useful.
For Goals, you can tell Google Analytics which actions on your website you value most, whether those are conversions or Time on Page or any number of other metrics.
How to set up Goals:
- At the very top of any Google Analytics page, click Admin.
- In the far right column, click on Goals.
- Choose a goal template.
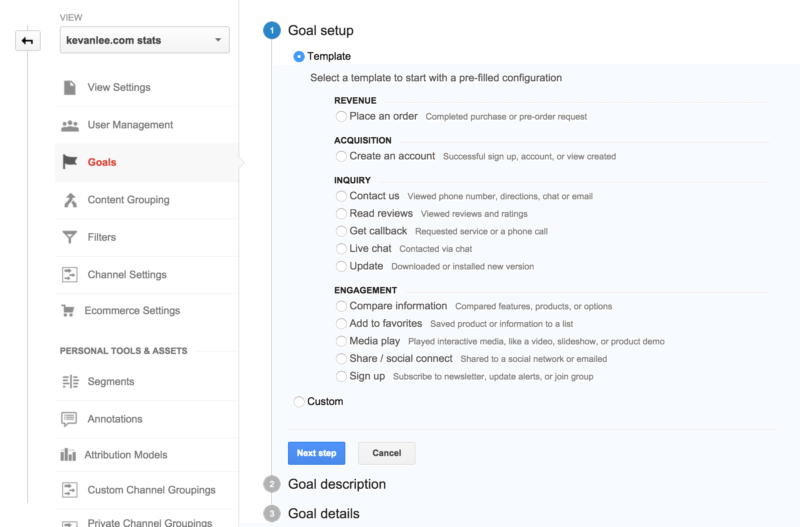
Google Analytics breaks these down into four different categories:
- Revenue
- Acquisition
- Inquiry
- Engagement
(I’ve personally used the Revenue category to track sales and the Engagement category to track newsletter signups.)
The next steps here will vary based on the category you choose. If you’ve got any specific questions on the details here, drop a comment on this post and I’ll see if I can dig up an answer!
For a quick overview, I love this advice from Kristi Hines:
The easiest goals set up type is URL destination – this is where you tell Google Analytics that a goal has been completed when a visitor lands on a particular page on your website. For example, you would set up the thank you page for a form submission or the final order confirmation page for a product purchase as a URL destination. For ecommerce websites, you can set up goal funnels that track all of the steps visitors take in your shopping cart process for more detailed reports.
At the end of the setup, you have a chance to verify the goal to see if all is in working order. If all’s good, then you’ll be able to start seeing your traffic in relation to the goals you’ve set up, which can be hugely helpful in identifying which channels and paths are most valuable for what you’re hoping to achieve with your site.
How to set up Advanced Segments:
- From your main overview page in Google Analytics, click the “+Add Segment” button above your main traffic graph.
- Click the red button to “+New Segment.”
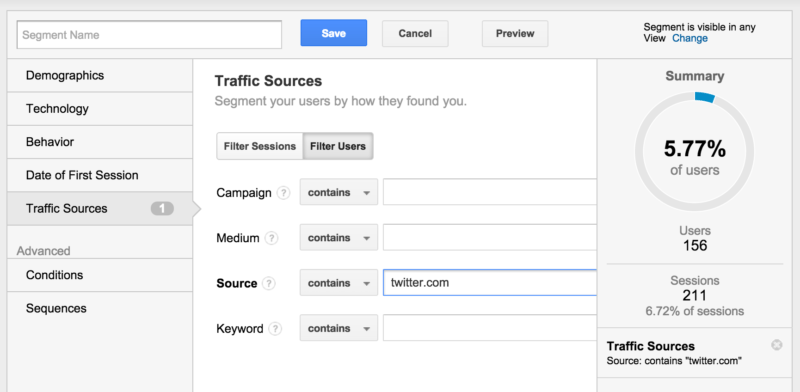
You can name your segment and choose the factors that you want to segment by.
The value here is in singling out a portion of your traffic based on particular options—only traffic from Twitter, say, or only Facebook mobile traffic. You can create these social media segments by adding the URLs for these networks to the Traffic Sources > Source in the segment settings.
For more on Advanced Segments, Convince and Convert has a useful overview on the topic.
Bonus: Free Social Media Dashboard
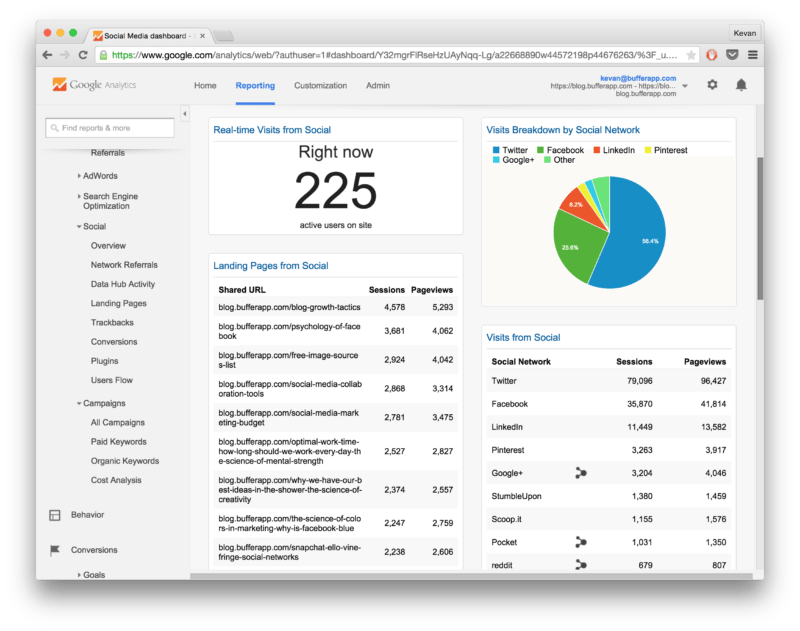
I’ve found that knowing about Google Analytics reports and using them can be two very different things, so I’d love to make it as easy as possible to get these reports into your social media marketing workflow.
Click here to receive a free social media dashboard.
It’s a free dashboard that adds straight into your Google Analytics once you click. From then on, you can access it quickly by clicking on Dashboards in the left column from any GA page.
What the dashboard includes:
- Real-time visitors to your website from social channels
- Which social networks are sending you the most traffic overall
- Your top landing pages for social traffic
- How your social traffic fits with traffic from search, direct, and referral
- Your most shared pages on Twitter and Facebook
- Your social media campaign results
Over to you
What have you found most useful with Google Analytics for your social media marketing?
Which reports do you find yourself checking often?
I’d love to learn from you on this! I feel I’m still quite green when it comes to Google Analytics and that there’s tons of untapped potential there. If you have any tips you’d be willing to share, it’d be an honor to learn from you!
Image sources: Pablo, IconFinder, UnSplash
Try Buffer for free
180,000+ creators, small businesses, and marketers use Buffer to grow their audiences every month.
Related Articles
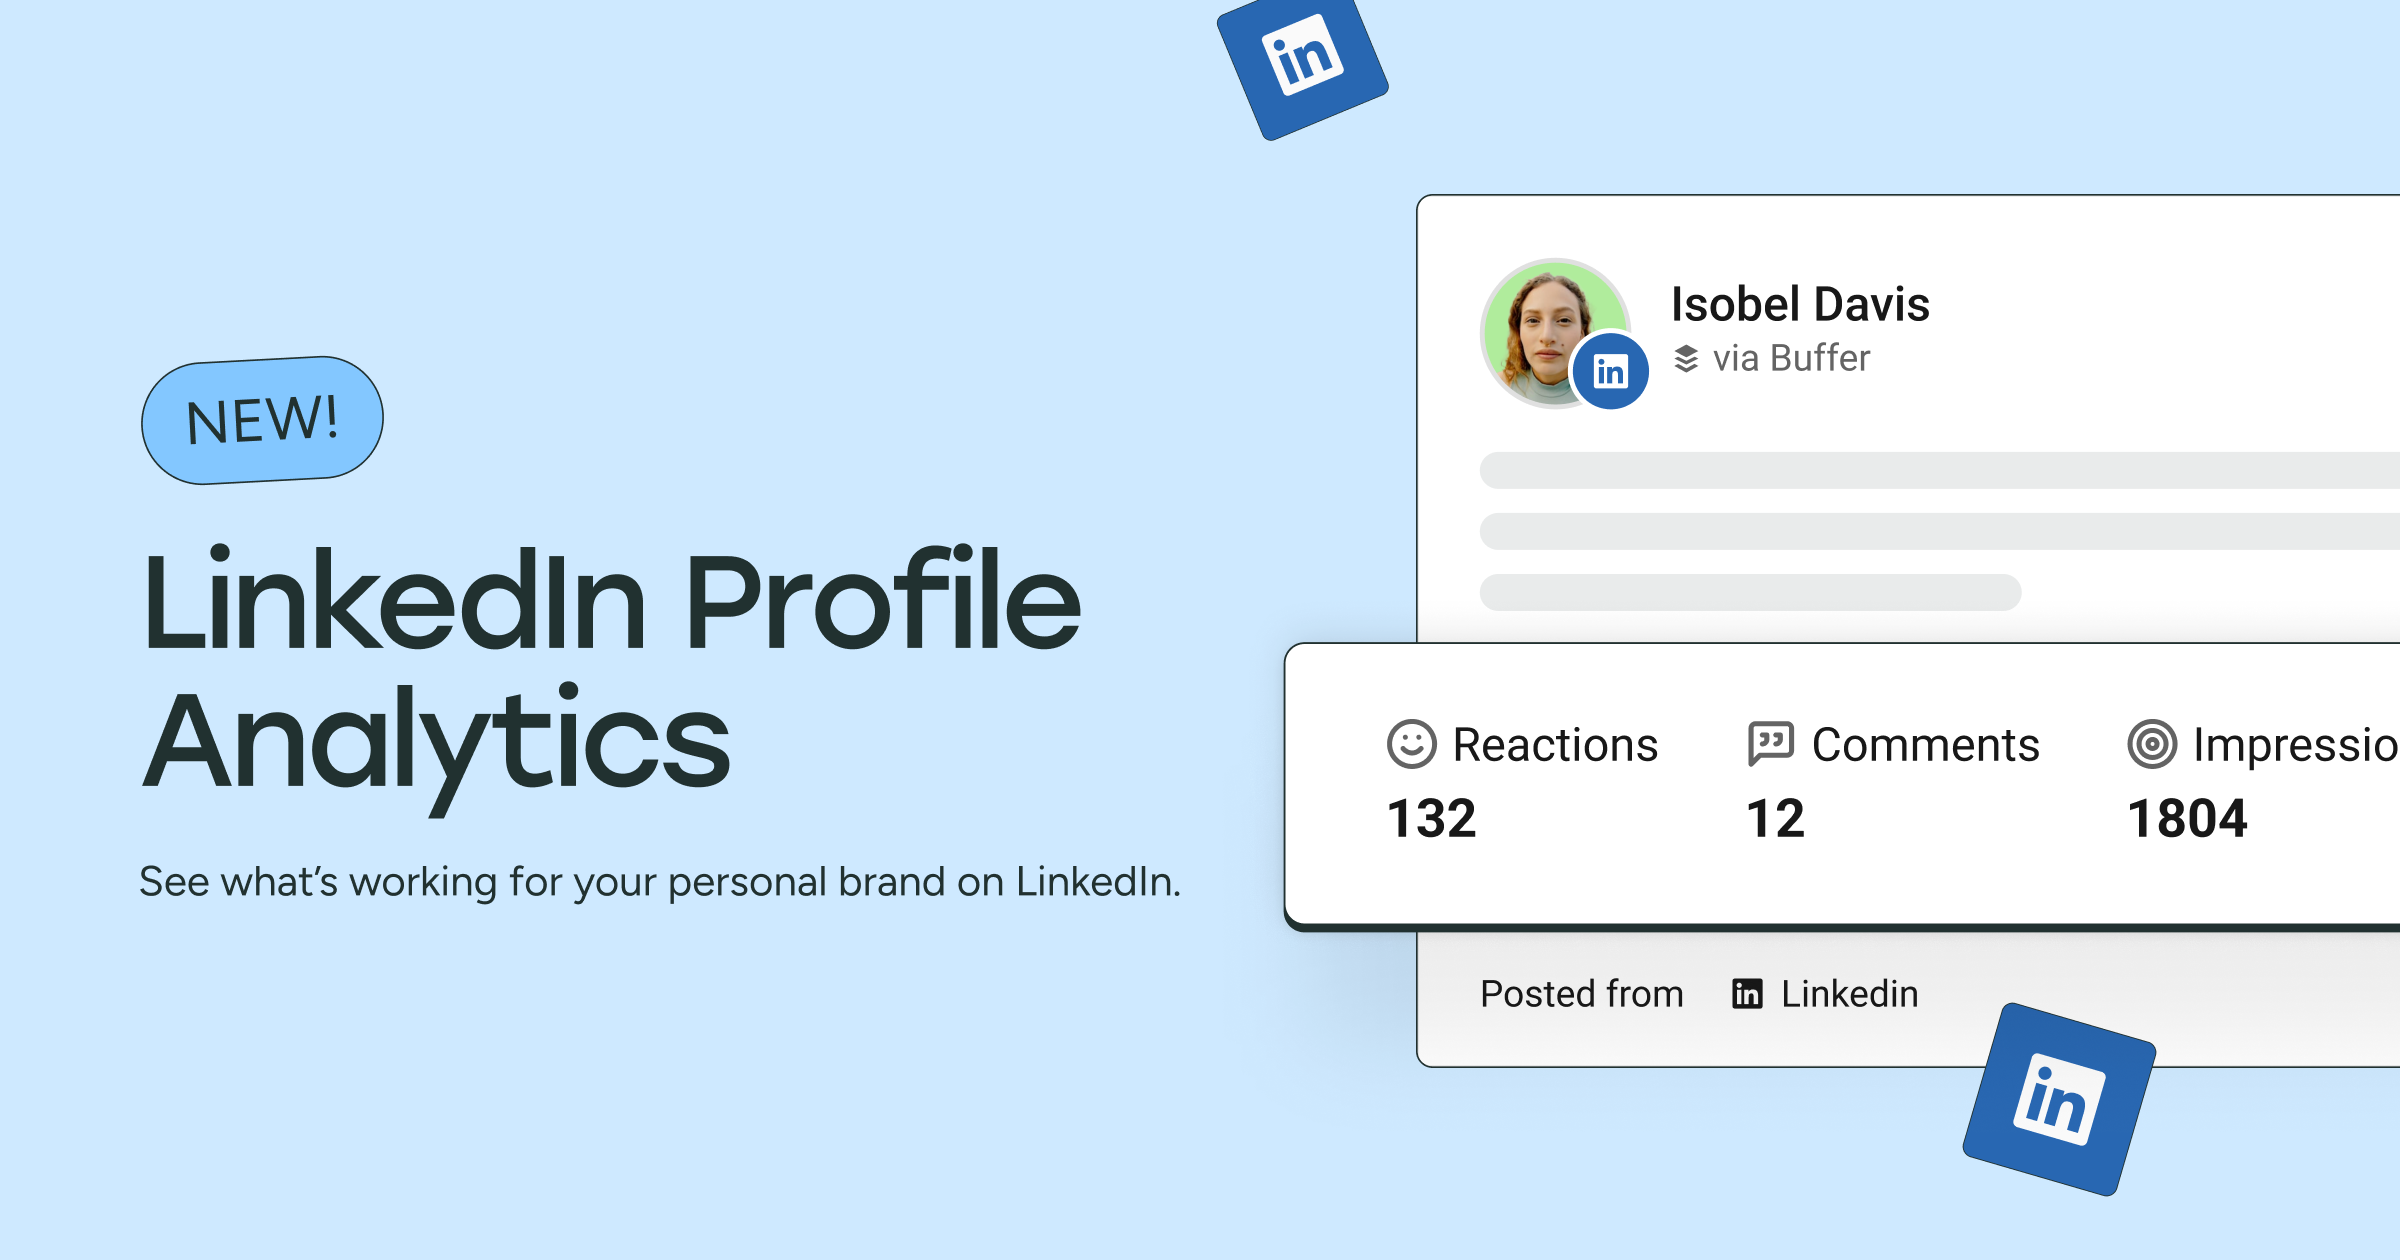
See how your LinkedIn posts perform with personal profile analytics. Track impressions, engagement, video views, and more right inside your Sent Posts tab. It’s never been easier to learn what’s working and keep growing.
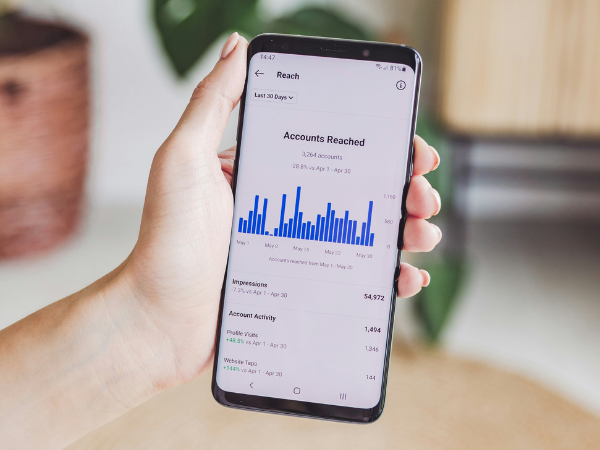
Social media platforms and analytics tools give you lots of metrics to track. But how do you know which ones are right for you — and how to make them work for your social media strategy?

A social media dashboard is a visual representation of the key metrics that prove the impact of your social media efforts. Here’s how to create one from scratch.
