Data is the fuel that powers a social media strategy.
And understanding the data behind your social media performance can help you to make better decisions about your content, ensure you’re connecting with the right audiences and help you to boost engagement and grow your following.
The problem is, there’s a lot of metrics to measure. Here are just a few you might need to keep an eye on:
- Likes
- Comments
- Shares
- Clicks
- Reach
And when you think about multi-platform performance (across Facebook and Instagram, for example), that list doubles in size — I’m feeling the strain just thinking about it!
Mastering social media analytics isn’t easy. But it’s essential if you want to create a winning strategy.
In this post, I’ll walk you through some steps you can take to make social media analytics your secret weapon.
Buffer Analyze: Buffer’s Social Media Analytics and Reporting Tool
We are excited to introduce Buffer Analyze, our social media analytics tool for online brands that want to make better decisions about their social media strategy and measure their results without feeling overwhelmed.
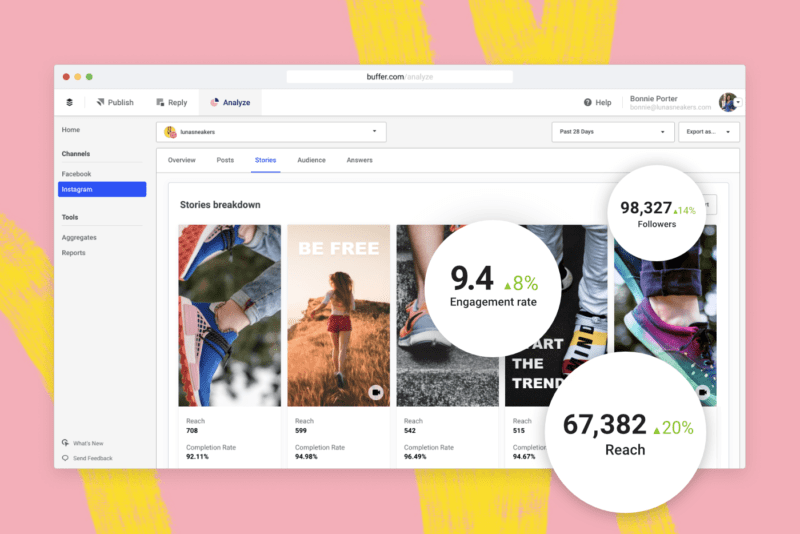
Read on to learn how you can use Buffer Analyze to grow your following and engagement on Instagram, Facebook, and Twitter.
How to create a data-informed strategy with social media analytics
The key to a data-informed social media strategy is understanding your audience and your own content. The two work hand-in-hand.
When you understand your audience, you can create content that they like, and by measuring the performance of your content, you can learn about your audience’s preferences.
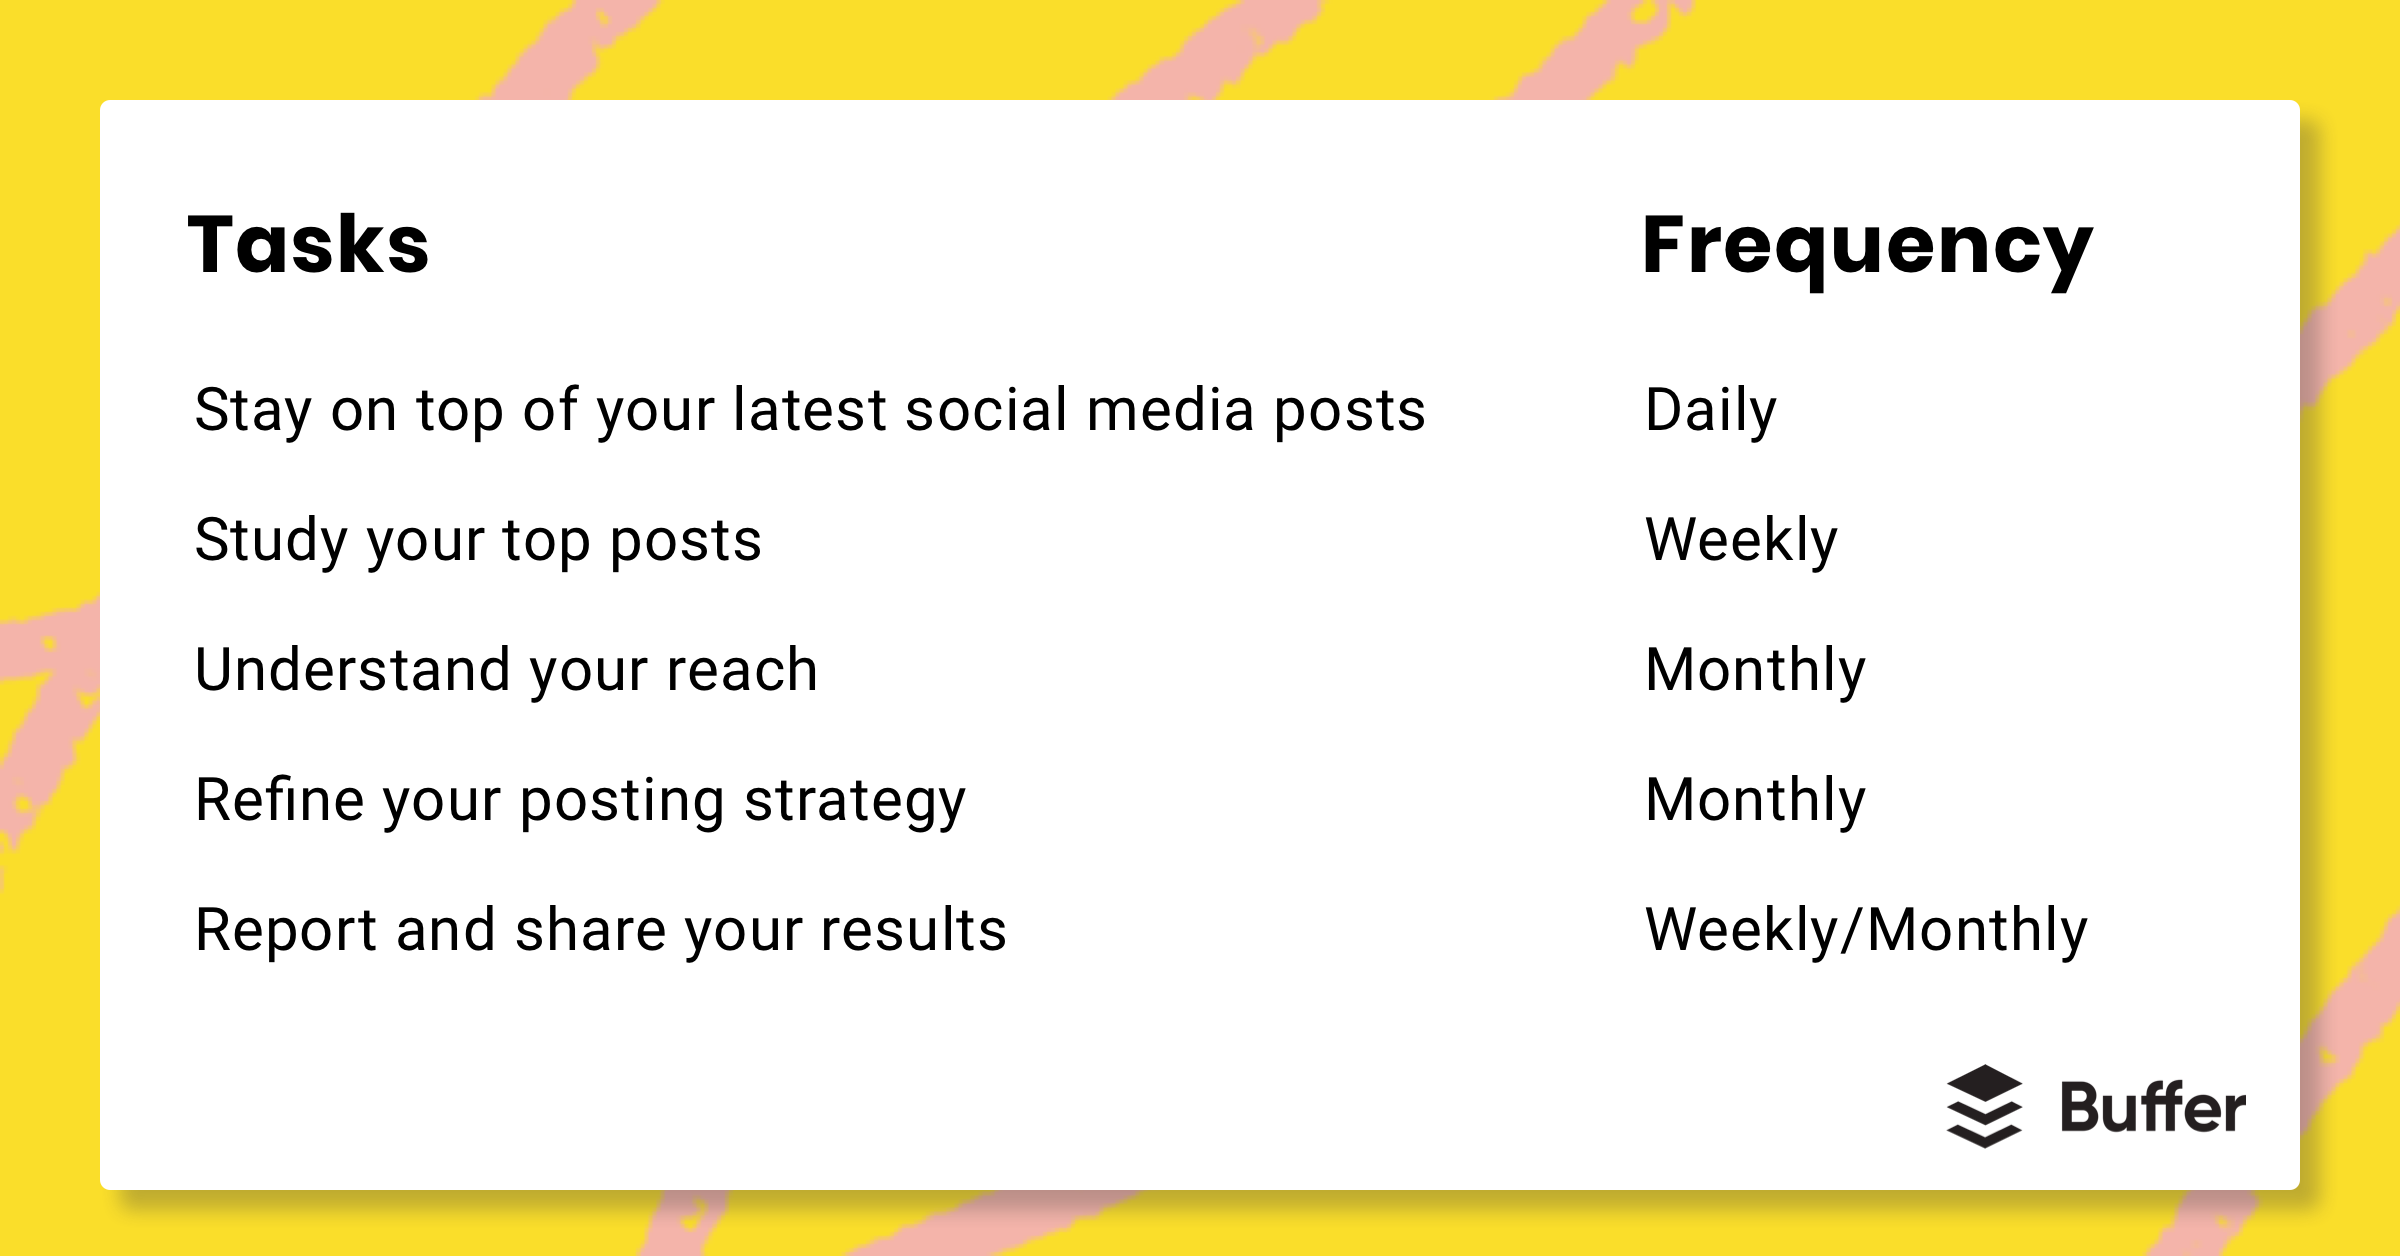
There are several things you can do with social media analytics tools to grow your reach and engagement — below I’ve broken them down to things you should do daily, weekly, and monthly.
1. Stay on top of your latest social media posts
It’s common for social media managers to regularly check their Instagram profile and Facebook Page to see how their latest posts are doing. This often means checking two separate apps multiple times a day.
Experiencing the pain ourselves, we wondered if there’s an easier way for social media managers to stay on top of their most recent posts.
Right on the home page of your Buffer Analyze account, you can see your five most recent posts across your Instagram profile and Facebook Page. You can also immediately see each post’s reach and engagement rate. To see more metrics for a post, you can simply click on the image.
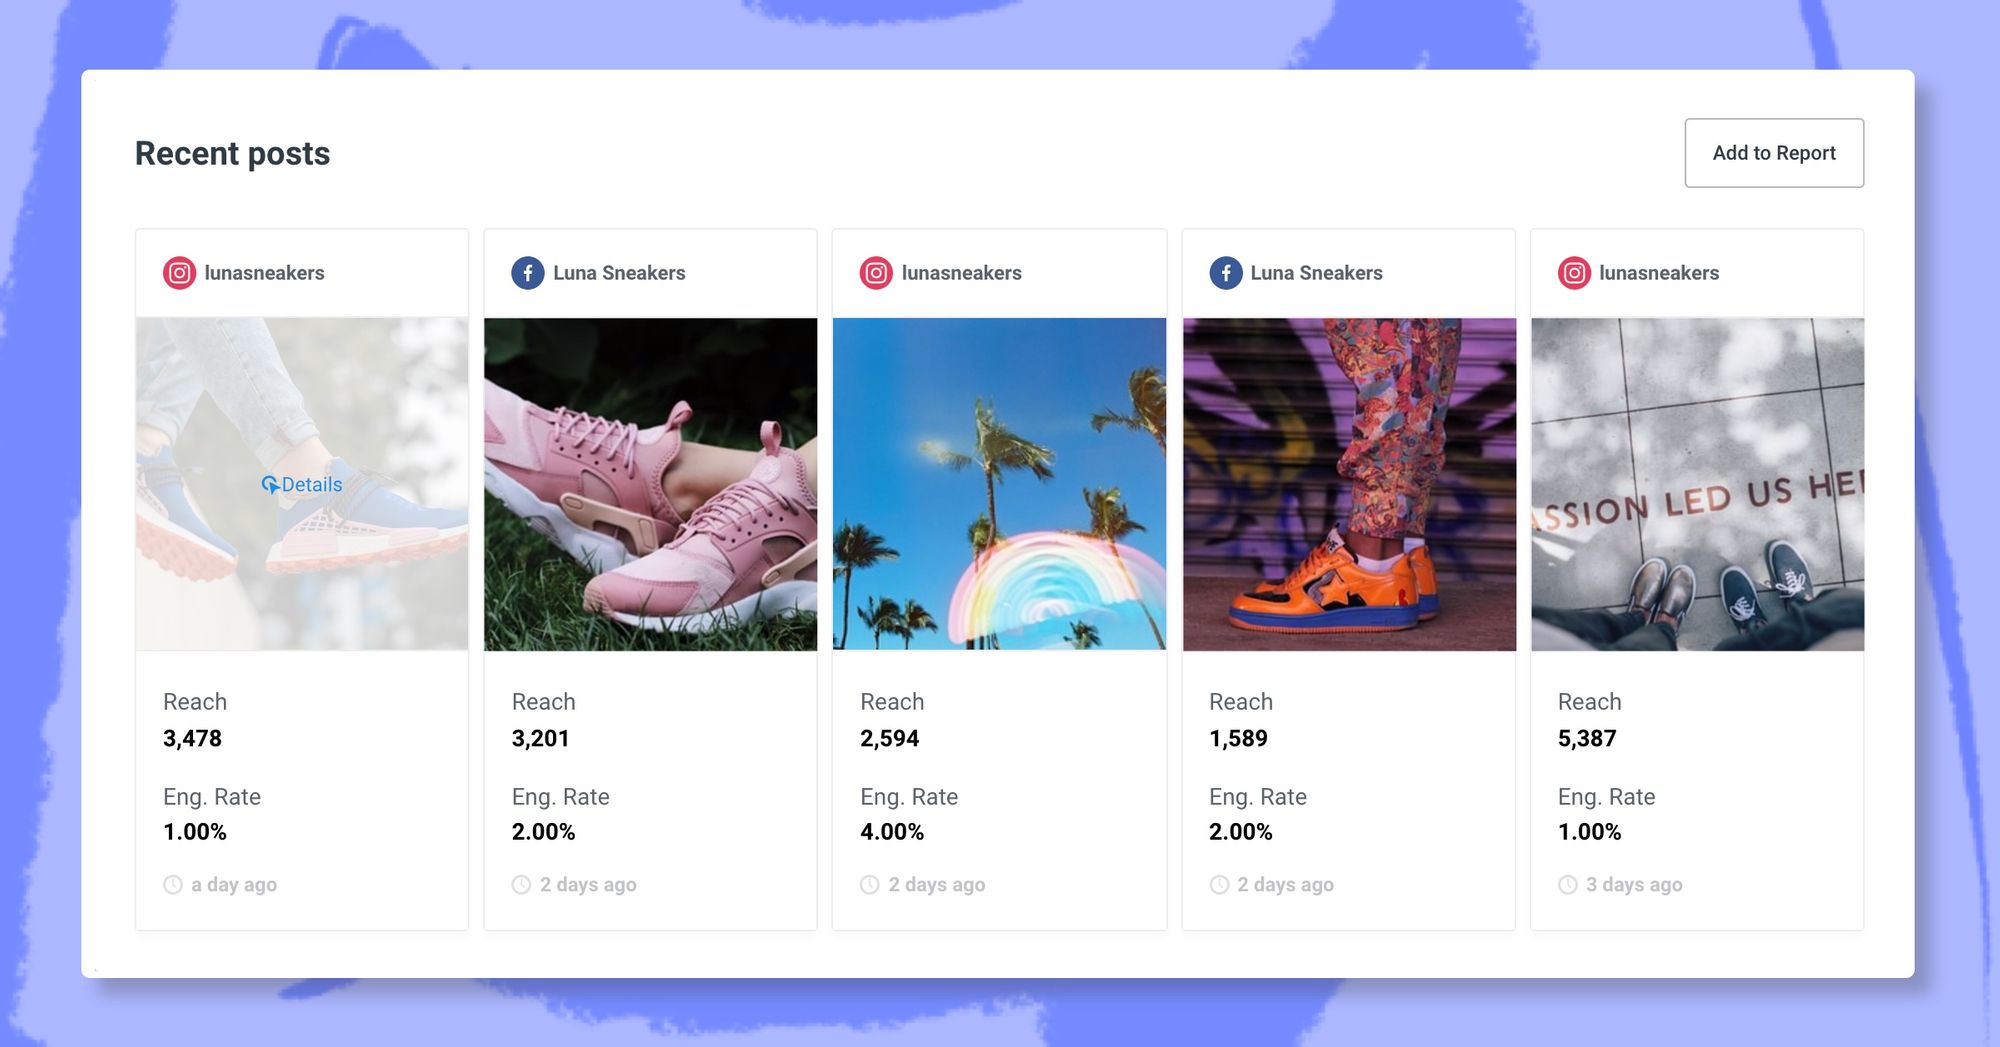
Depending on how often you post, you can pop into your Buffer Analyze account a few times a day to get a quick update on how your recent posts are performing. I would recommend doing this at least twice a day — once at the start of your day and once at the end.
2. Study your top posts
Studying your social media posts at the end of every week (or the start of a new week), enables you to learn which posts have resonated with your audience (highest engagement rate) and which have spread far and wide (highest reach). With this data, you can then plan your social media content for the new week.
In Buffer Analyze, you get a detailed breakdown of your social media posts, including boosted Facebook and Instagram posts.
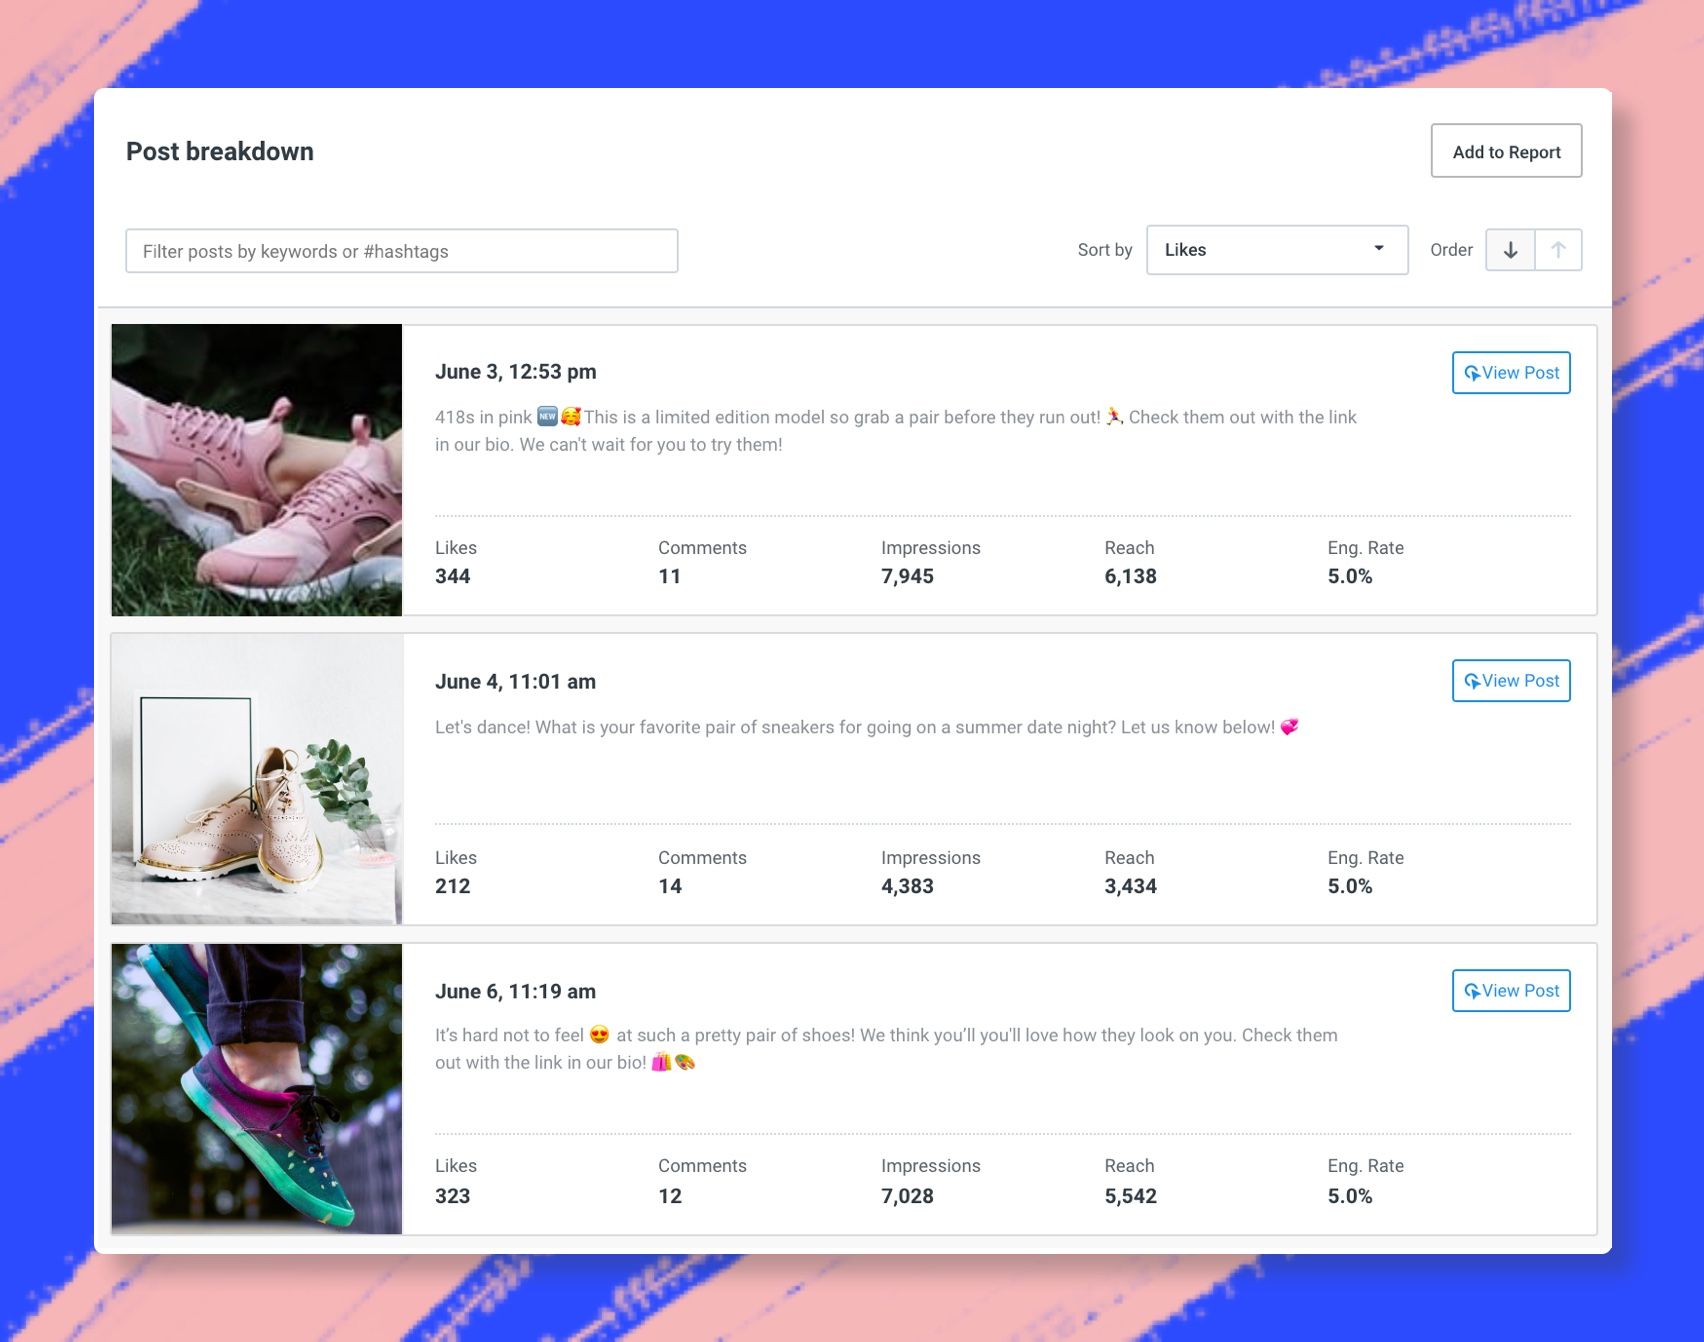
For each post, you get all the key metrics to help you understand how your audience reacted to your post:
- The number of likes
- Comments count
- Impressions
- Reach
- Engagement rate.

I would recommend taking a look at your top posts — be it highest engagement rate or highest reach — every week and try to deduce what helped them perform so well. Is it the creative? Or the caption? Doing this week over week will enable you to build up a good sense of what your audience loves to see from your brand.
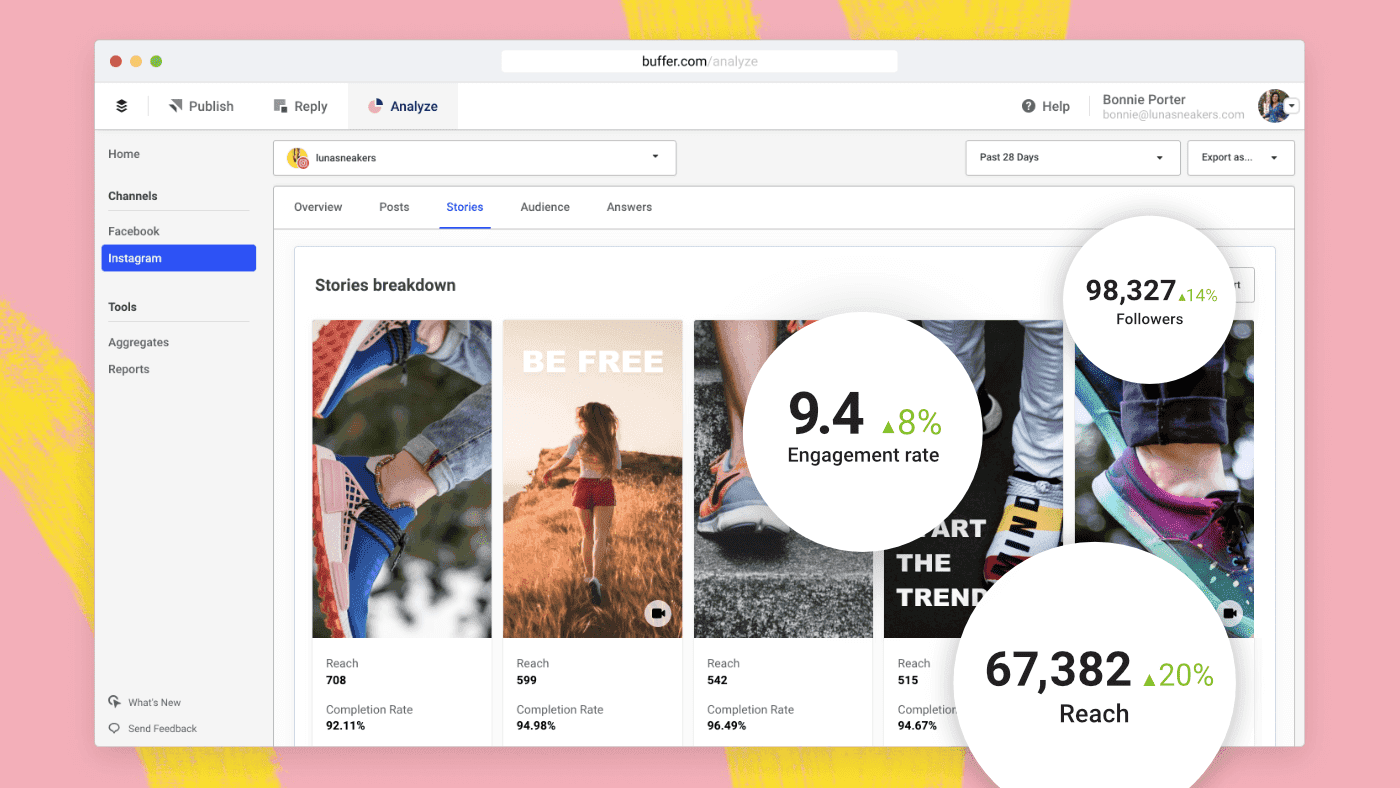
Besides data for your Instagram posts, Buffer Analyze is one of the few social media analytics tools that provide Instagram Stories analytics.
Buffer Analyze shares reach and completion rate for individual Instagram Stories and overall metrics, such as total impressions and average reach, for all the Instagram Stories you have posted within your chosen period.
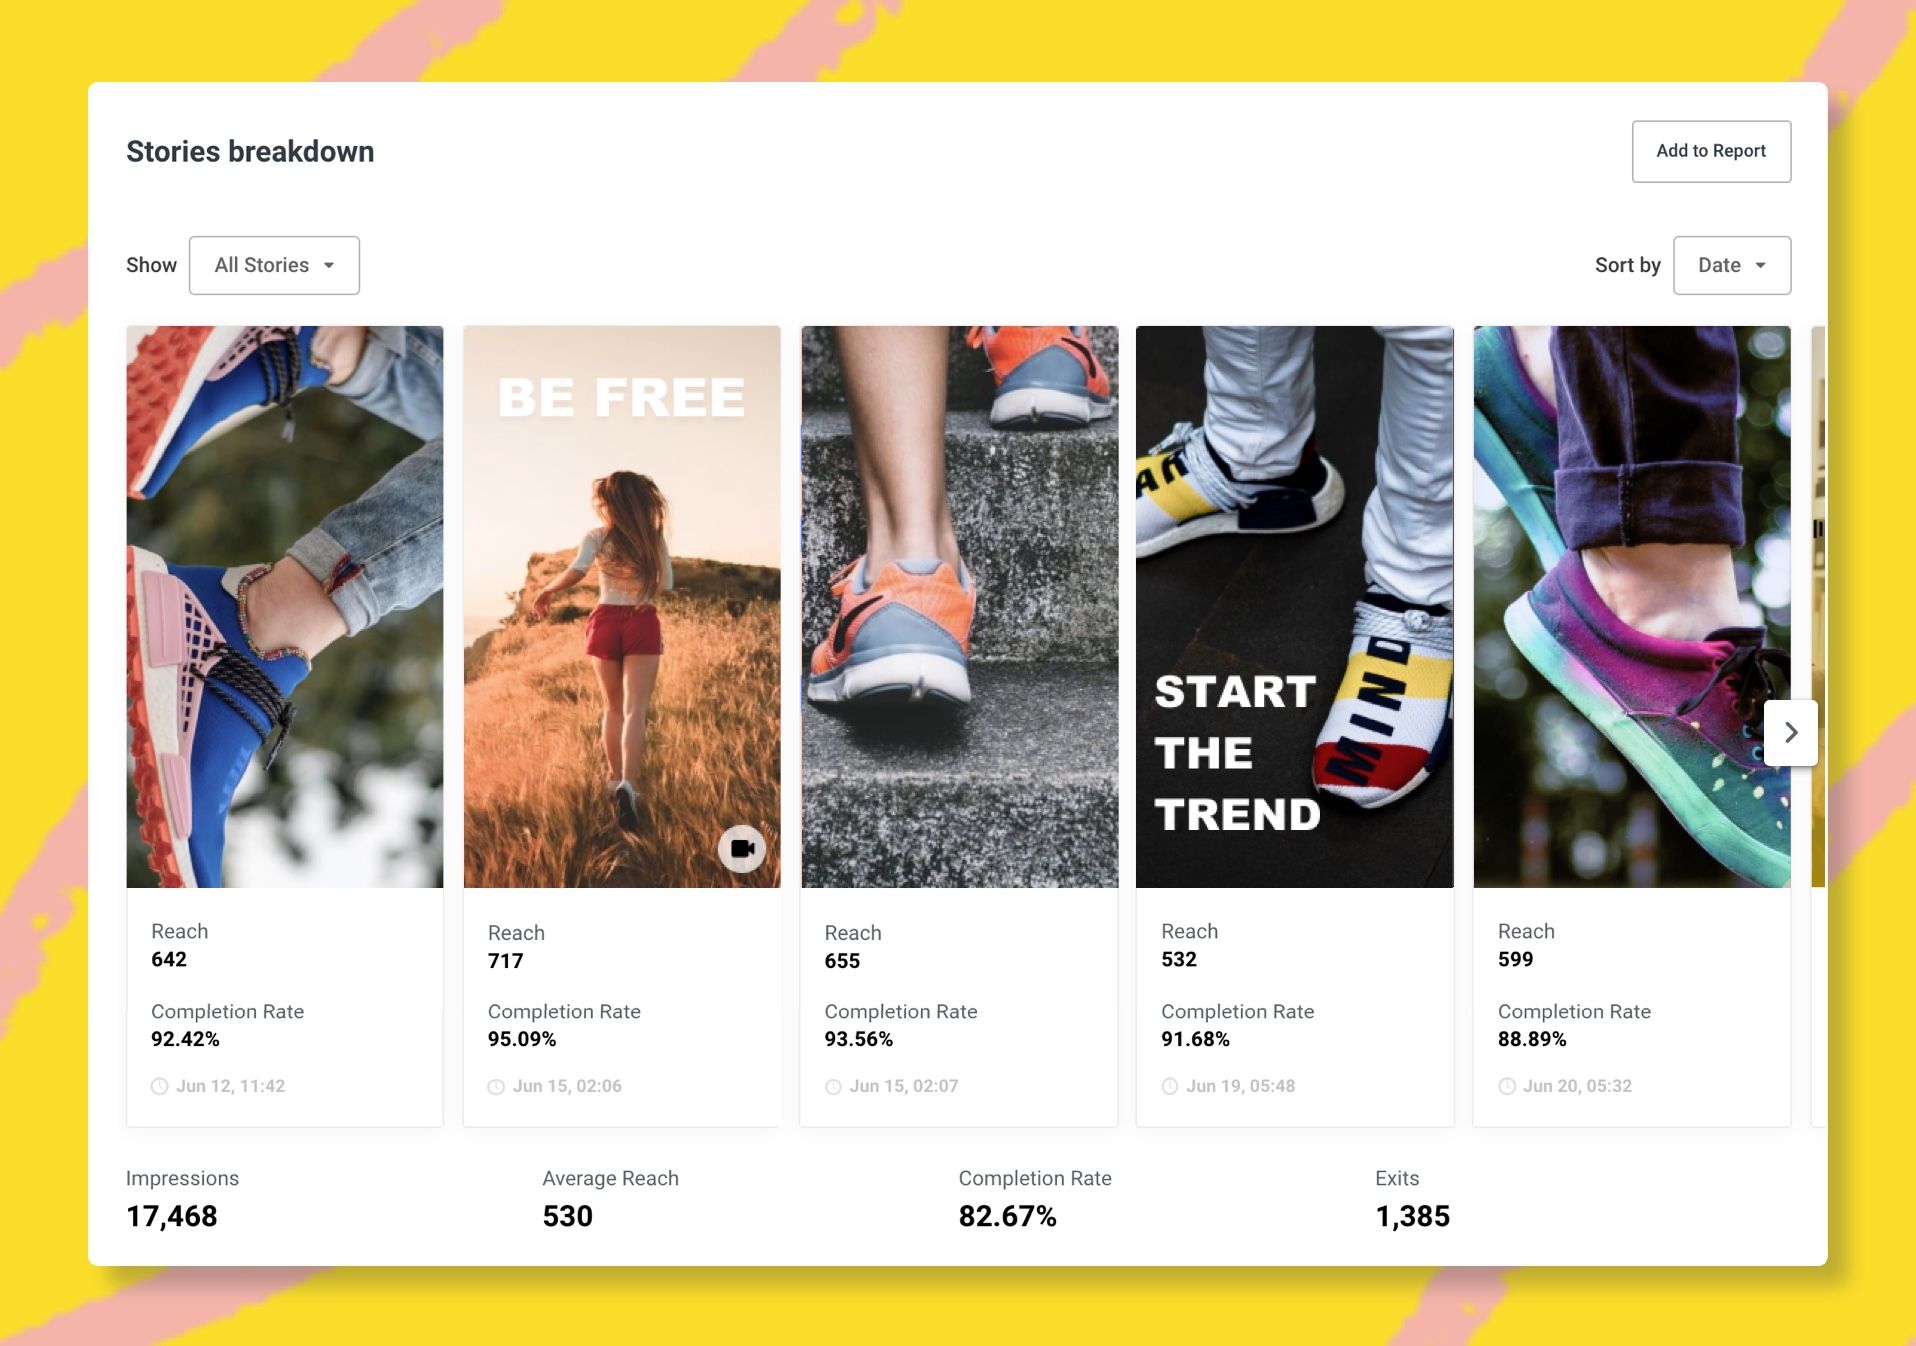
This is our first version of Instagram Stories analytics, and we are keen to make it better with your feedback. Feel free to email me at alfred@buffer.com if you have any thoughts. Thank you!
3. Understand your reach
A big part of a successful social media strategy is reaching the right audience.
It is more valuable to reach a small group (1,000~) of people who would be interested in your product than a large group (1,000,000~) who would not even consider your product.
But how can you ensure you’re connecting with the right people on social media?
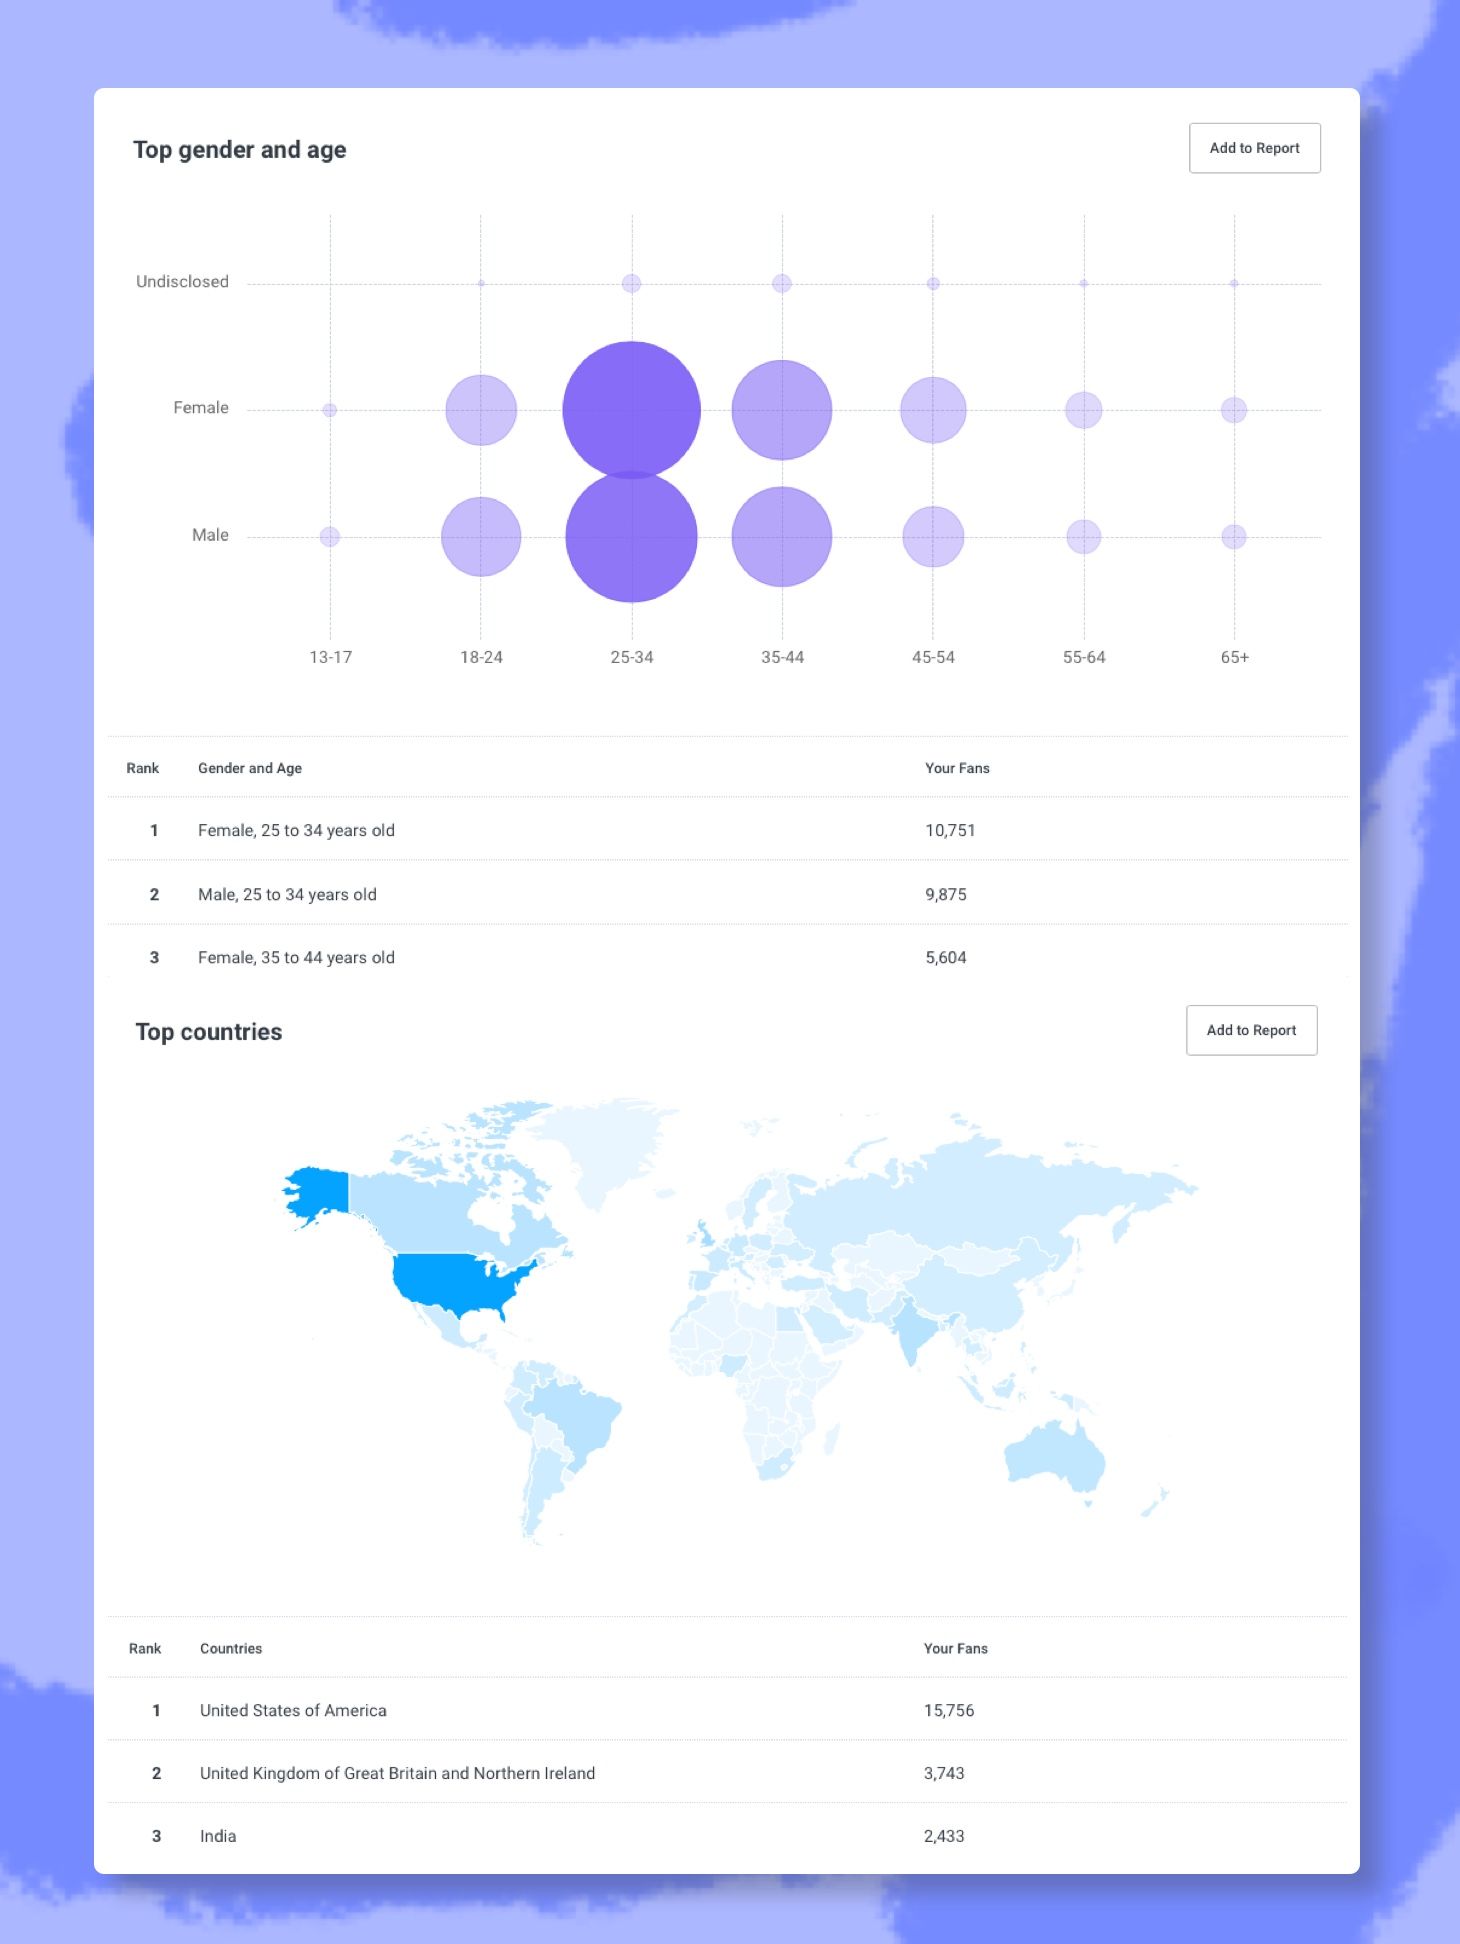
We believe you should be able to glance at your data and say “The majority of our fans are females, age 25 to 34, who live in London, which is precisely the audience we want to reach.” So we built an audience overview into Analyze:

Buffer Analyze also has a more detailed breakdown of your audience so that you can refine your content or posting strategy to reach your target audience.
For example, if most of your audience are not in your target location, you could experiment with local hashtags or posting times that match browsing behavior in that time zone.
Here’s something else to consider:
Instagram and Facebook ads offer very precise targeting, including gender, age, location, interests, and more. If you have the budget to spare, you could run some ads to shift your fan demographics accordingly.
Changing your fan demographics takes time. Consequently, it’ll make sense to check on your audience data every month, rather than every day or week.
4. Refine your posting strategy
The most common questions we get about social media strategy are:
- What is the best time to post?
- What should I post?
- How often should I post?
Quick disclaimer: There isn’t a universal best time to post. The answers to these questions are unique to your own brand because you have your unique set of audience.
In the past, we had always recommended social media managers to download their data from the native analytics or Buffer Publish, import it into a Google Sheet (or a template we created), and manually figure out their posting strategy.
We realized that can be tedious!
This is why we built these recommendations directly into your Buffer Analyze account. By studying your past posts, Buffer Analyze tells you the day, the type of post, and the frequency that got you the highest engagement rate. For Instagram, Buffer Analyze also tells you the best time to post for the highest reach. No more manual calculations!
To make things even easier for you, Buffer Analyze gives you the recommendations directly. You do not even have to study the charts yourself.
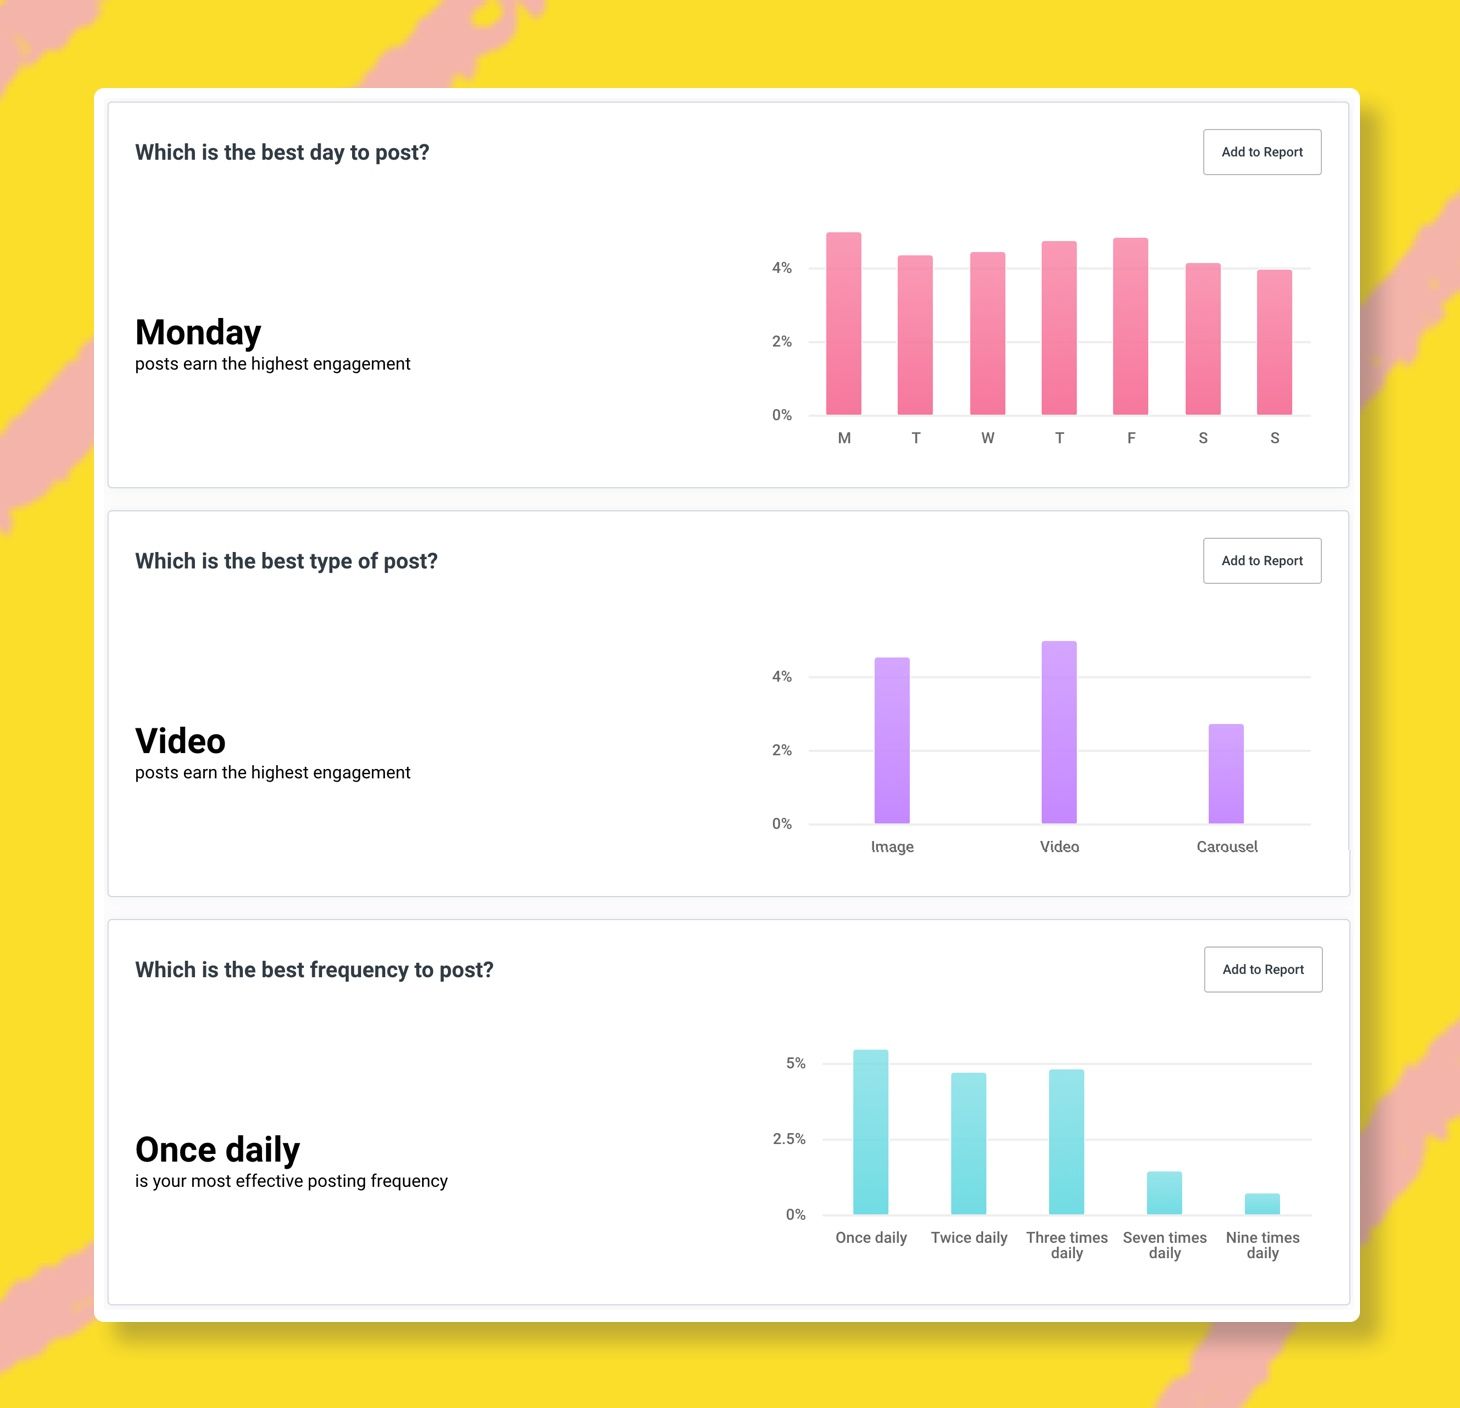
Your social media posting strategy shouldn’t have to change often as the behavior of your audience should remain fairly constantly. Hence, checking Answers in Buffer Analyze and tweaking your posting strategy (if necessary) about once a month should be sufficient.
5. Report your results
Finally, it’s good to create reports of your results every week or month to regularly show the value you are bringing to the business.
With Buffer Analyze, you can create professional reports in as few as two clicks. Every module in Buffer Analyze has an “Add to Report” button, which lets you add it to your report quickly. You can add modules from both your Instagram profile and your Facebook Page into a single report.
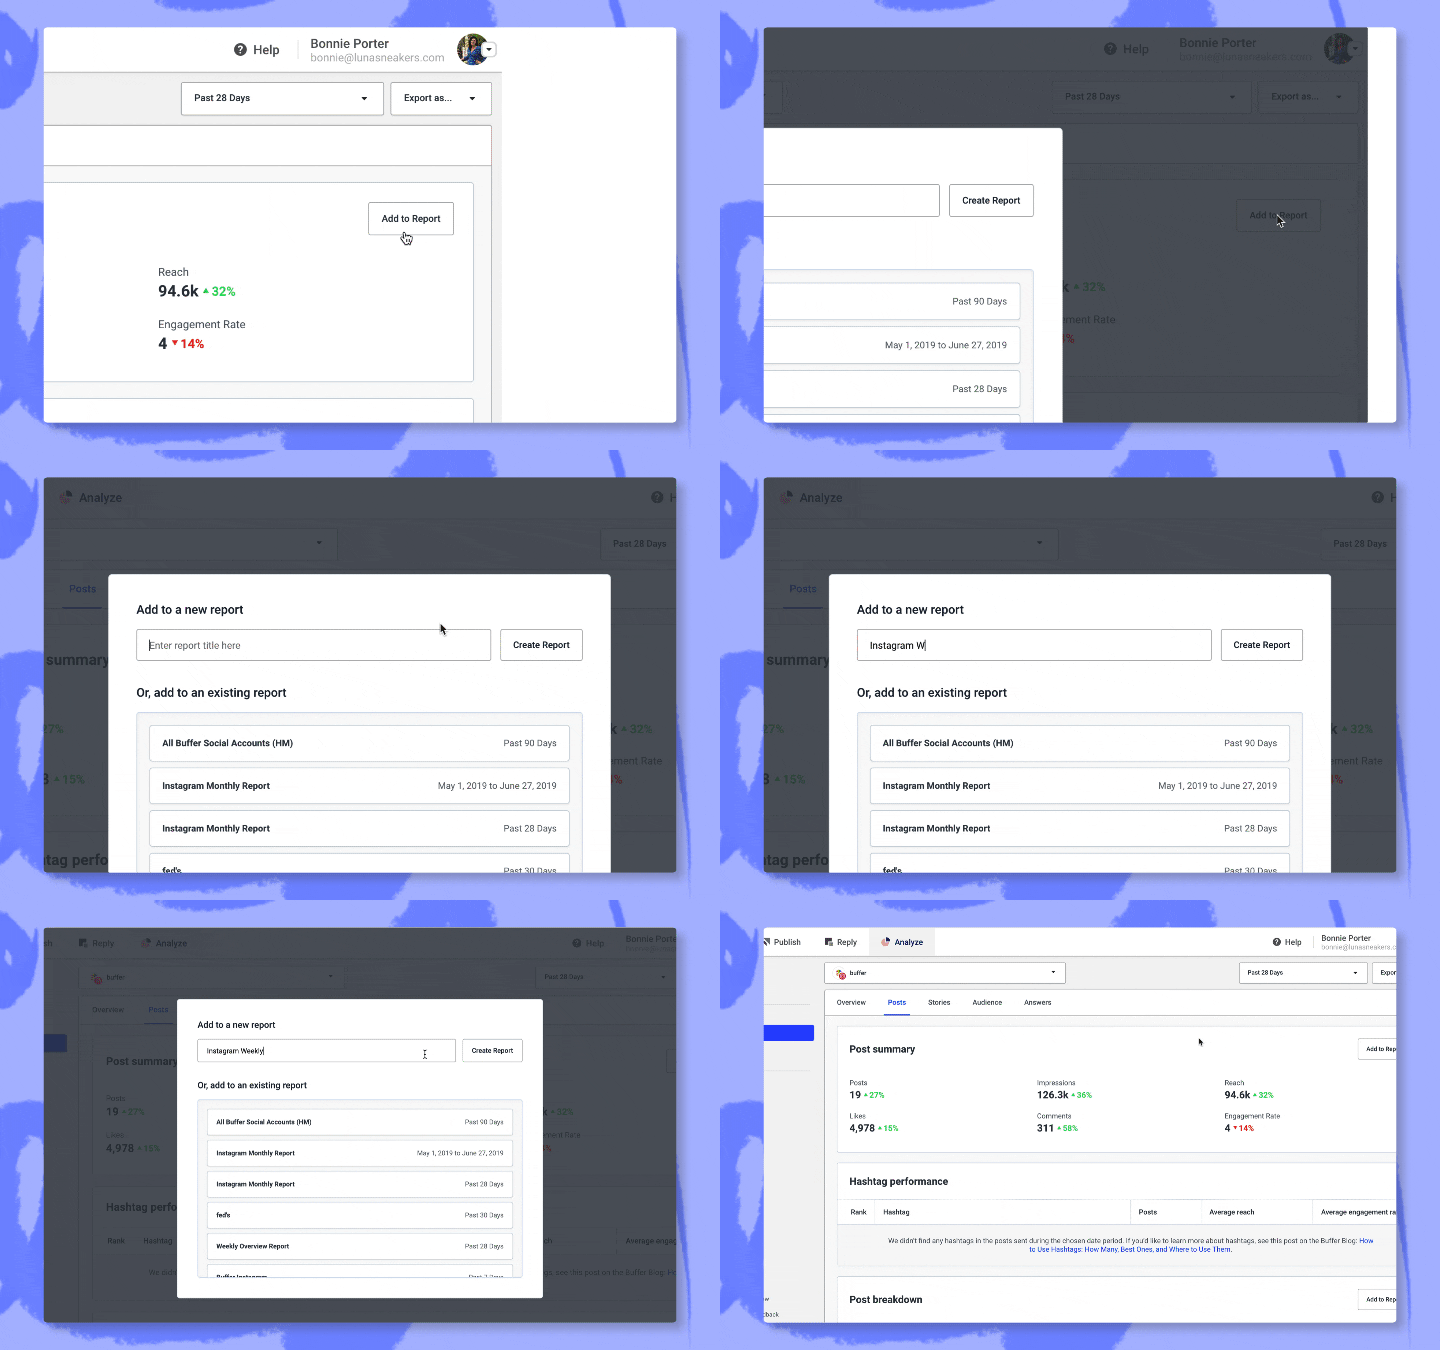
Here are three quick tips for reports:
- Automatically updated reports: If you have selected a fixed date period (e.g. past 7 days or 28 days), your report will automatically update itself every day — so you don’t have to manually create reports every time.
- Fast way to update other reports: If you’ve chosen a custom date period, you can simply change the dates to update the report, without having to recreate the report from scratch. For example, our social media manager, Bonnie, has an Instagram Sprint report, which she checks every two weeks.
- Analytics dashboard: Another great way to use reports in Buffer Analyze is to pull all the data you regularly need into one report, making it a dashboard. This saves you from having to navigate around your Buffer Analyze account to find those data all the time.
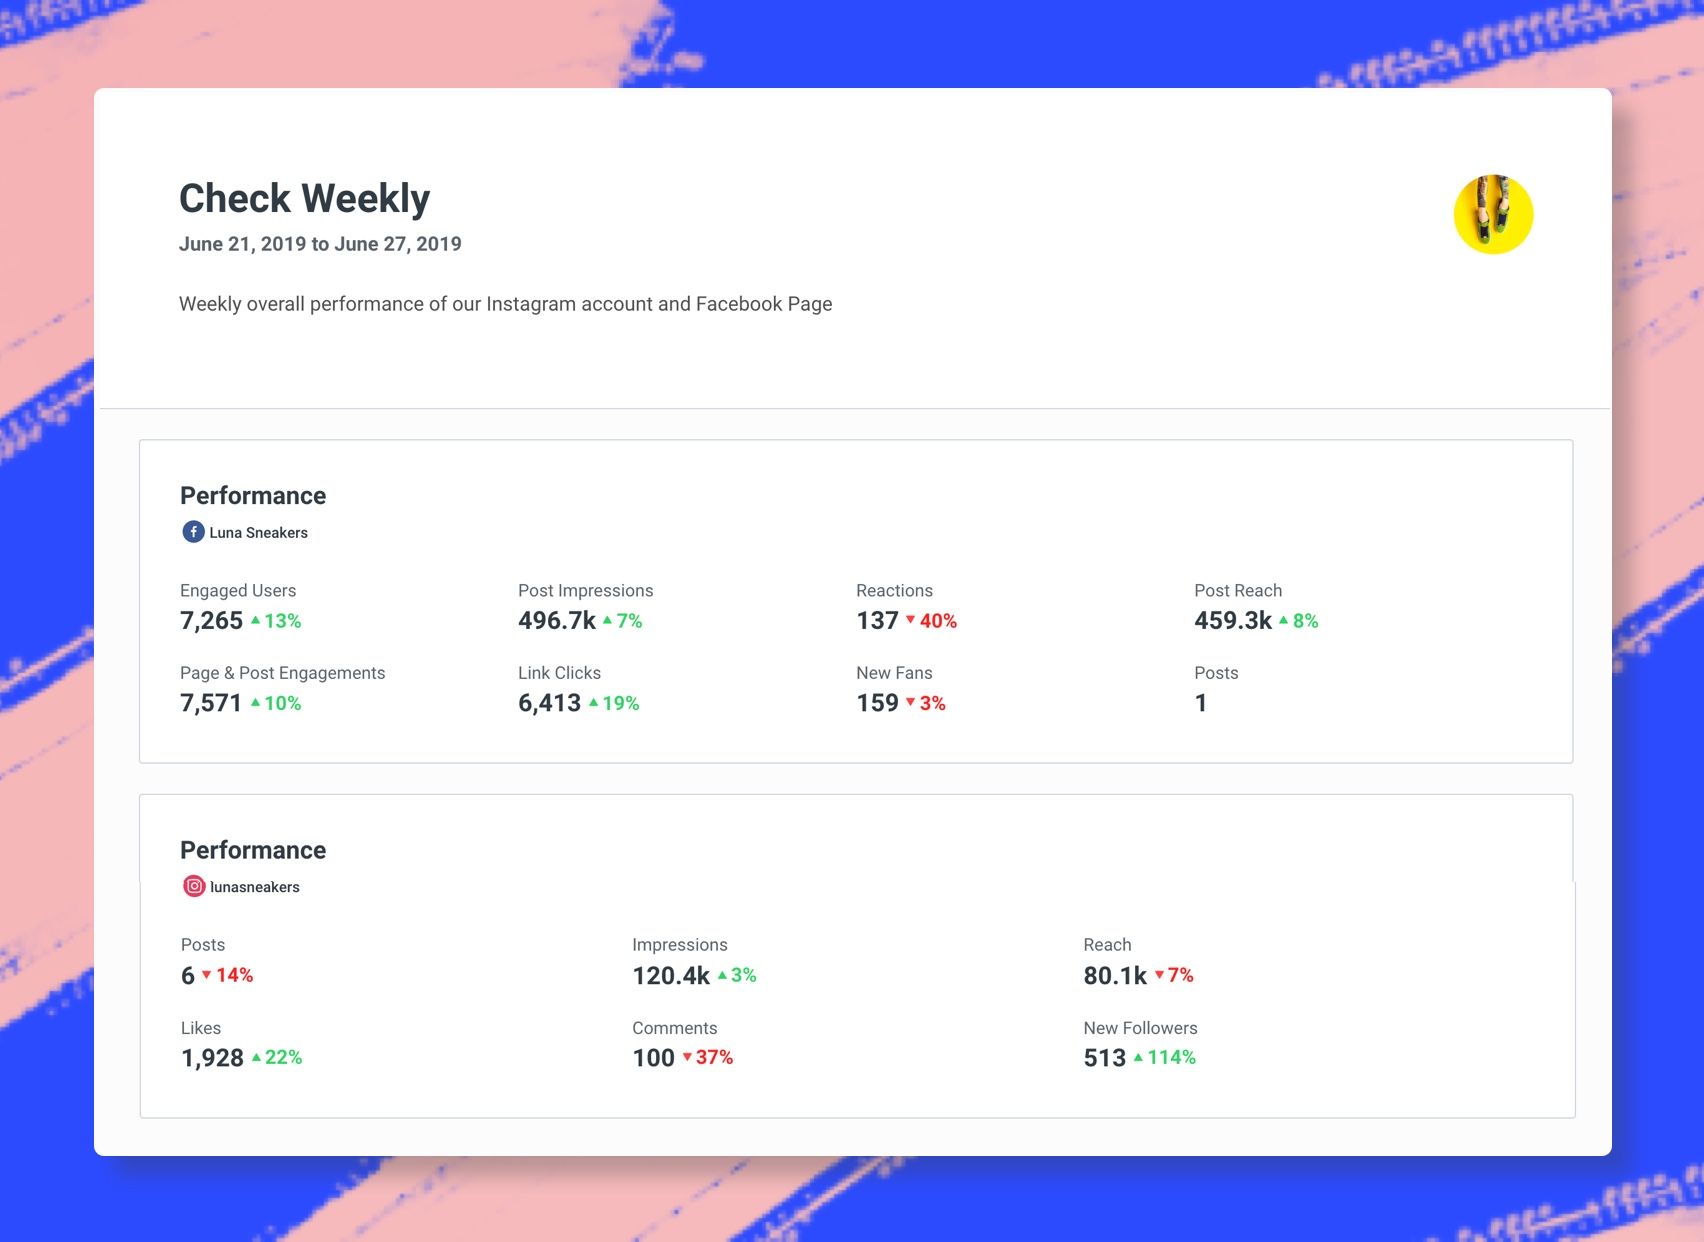
How often to report your social media results depends on your social media strategy. For instance, we set our social media goals every two weeks so we share the reports every two weeks. If you set monthly goals, reporting once a month works fine too!
Use data to grow your brand and engage your fans
You shouldn’t be taking shots in the dark with your social media content and posting strategy. By knowing what’s working and what’s not working, you can refine your tactics and strategies to grow your engagement and following.
We are excited to be part of this journey with you. If you have any questions about Buffer Analyze, feel free to reach us on social media.
Try Buffer for free
190,000+ creators, small businesses, and marketers use Buffer to grow their audiences every month.

