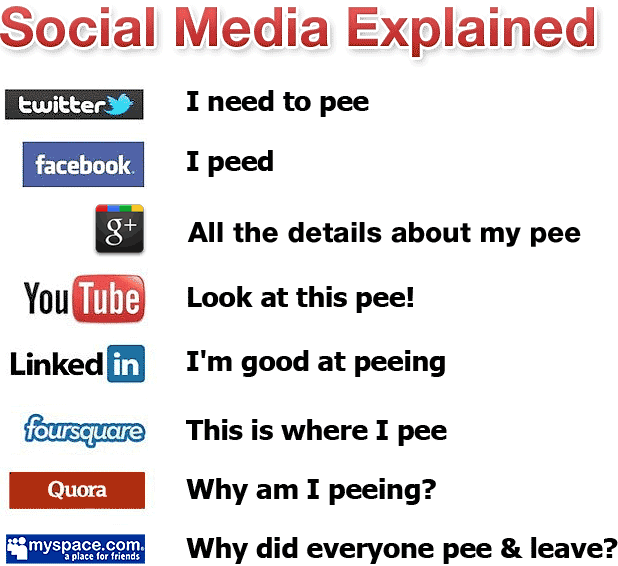
There are useful infographics…and then there are these infographics:
- All of Social Media Explained in One Diagram
- The Four Stages of “Getting” Twitter
- Profile of a Twitter User
Of course, you can click any infographic to enlarge it. But enough talk! Let’s get to the first infographic:
1. All of Social Media Explained in One Diagram:

2. The Four Stages of “Getting” Twitter
3. Profile of a Twitter User
![twitter-users-profile1[1]](https://buffer.com/resources/content/images/resources/wp-content/uploads/2012/10/twitter-users-profile11-1024x768.jpg)
Back To You
Had a laugh? Know of something funny that we missed? Leave a comment below. We’d love to hear from you ?
Try Buffer for free
140,000+ small businesses like yours use Buffer to build their brand on social media every month
Get started nowRelated Articles

In this article, you'll learn everything you need to know about starting a LinkedIn newsletter.

This article will share ten social media marketing tasks you can automate to free up some headspace and clear up that to-do list.

In this article, we cover how to use Bluesky as well as some tips to get started sharing your posts on the platform.