
How to Set Kubernetes Resource Requests and Limits - A Saga to Improve Cluster Stability and Efficiency
A mystery
So, it all started on September 1st, right after our cluster upgrade from 1.11 to 1.12. Almost on the next day, we began to see alerts on kubelet reported by Datadog. On some days we would get a few (3 – 5) of them, other days we would get more than 10 in a single day. The alert monitor is based on a Datadog check – kubernetes.kubelet.check, and it’s triggered whenever the kubelet process is down in a node.
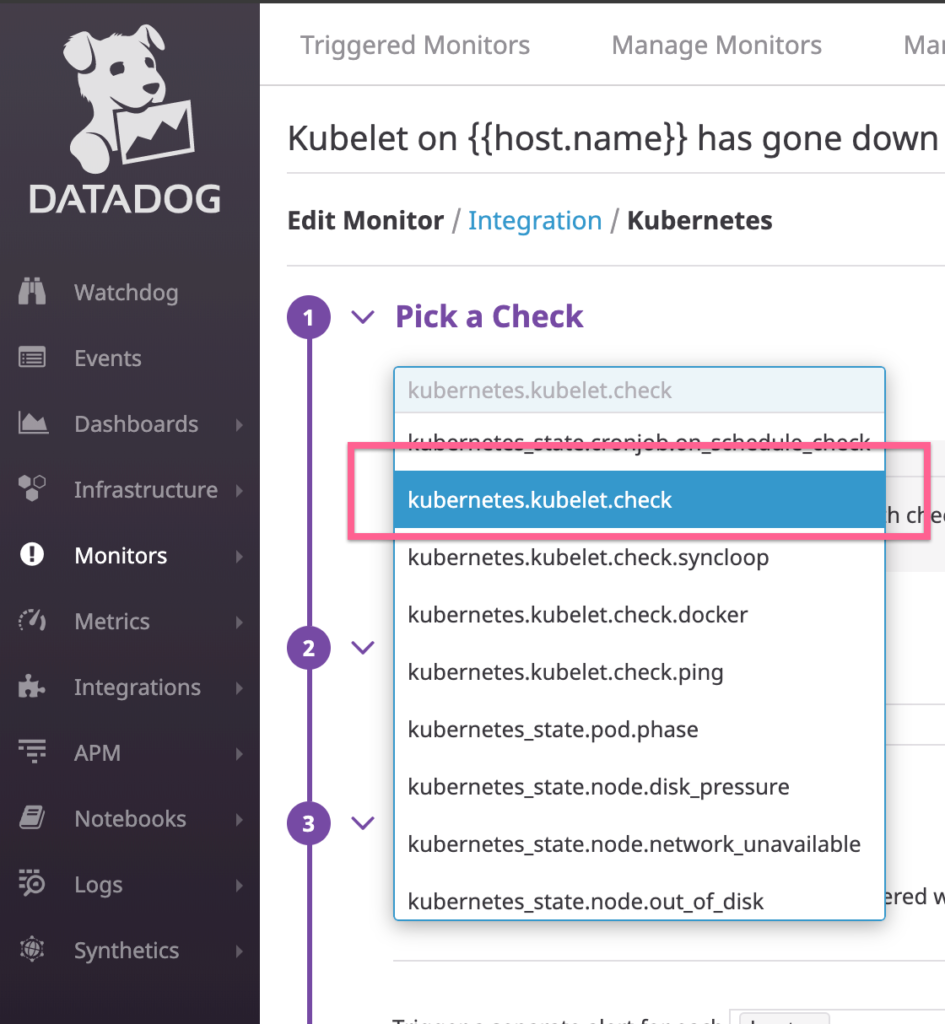
We know kubelet plays an important role in Kubernetes scheduling. Not having it running properly in a node would directly remove that node from a functional cluster. Having more nodes with problematic kubelet then we get a cluster degradation. Now, Imagine waking up to 16 alerts in the morning. It was absolutely terrifying.
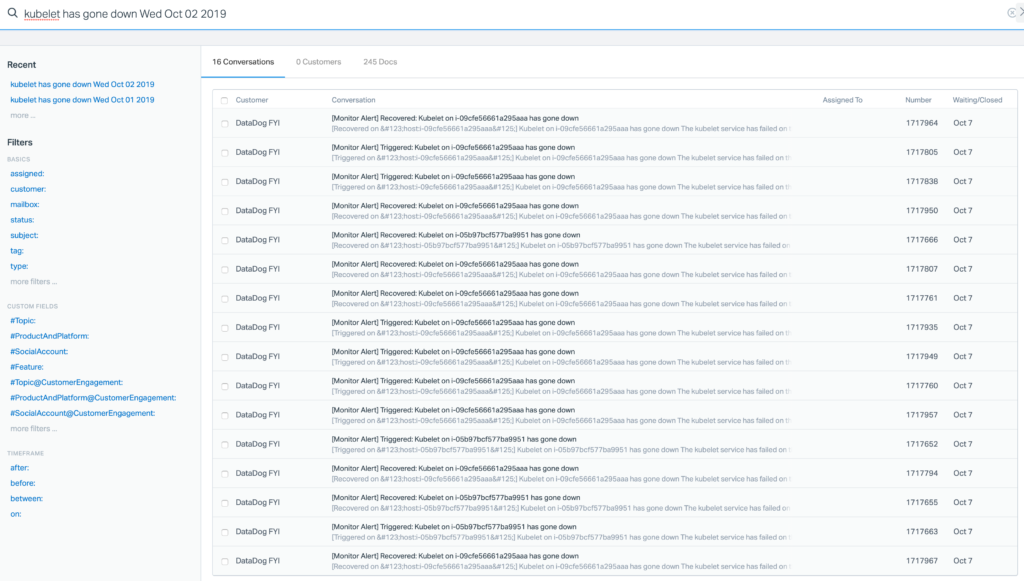
What really puzzled us was all the services running on the problematic nodes seemed to be innocuous. In some cases, there were only a handful of running services, and some high CPU usage right before. It was extremely hard to point the finger on anything when the potential offender might have left the scene, thus leaving no trace for us to diagnose further. Funny enough, there weren’t any obvious performance impact such as request latency across our services. This little fact added even more mystery to the whole thing.
This phenomenon continued to start around the same time every day (5:30AM PT), and usually stopped before noon, except for the weekends. To a point, I felt I could use these Datadog alerts for my alarm clock. Not super fun, and I certainly got some grey hair with this challenge.
Our investigation
From the start, we knew this was going to be a tough investigation that would require a systematic approach. For brevity, I’m going to just list out some key experiments we attempted and spare you from the details. As much as they are good investigative steps, I don’t believe they are important for this post. Here are what we tried
- We upgraded the cluster from 1.12 to 1.13
- We created some tainted nodes and moved all our cronjobs to them
- We created more tainted nodes and moved most CPU consuming workers to them
- We scaled up the cluster by almost 20%, from 42 nodes to 50 nodes
- We scaled down the cluster again because we didn’t see any improvements
- We recycled (delete and recreate) all the nodes that previously reported kubelet issue, only to see new nodes followed suit on the next day
- Just between you and me, I even theorized the Datadog alert might be broken because there wasn’t any obvious service performance impact. But I couldn’t bring myself to close the case knowing the culprit might still be at large.
With a stroke of luck and a lot of witch-hunting, this piqued my attention
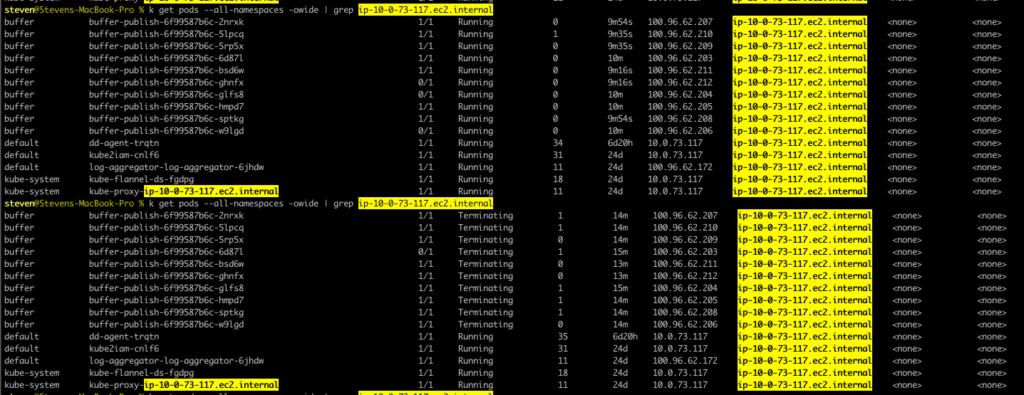
We saw 10 buffer-publish pods were scheduled to a single node for around 10 minutes, only to be terminated shortly. At the same time the CPU usage spiked, kubelet cried out, and the pods disappeared from the node in the next few minutes after termination.
No wonder we could never find anything after alerts. But what were so special about these pods, I thought? The only fact we had was the high CPU usage. Now, let’s take a look at the resource requests/limits
resources:
  limits:
    cpu: 1000m
    memory: 512Mi
  requests:
    cpu: 100m
    memory: 50Mi
CPU/Memory requests parameter tells Kubenetes how much resource should be allocated initially
CPU/Memory limits parameter tells Kubenetes the max resource should be given under all circumstances
Here is a post that does a much better job in explaining this concept. I highly recommend reading it in full. Kudos to the team at kubecost!
Now, back to where we are. The CPU requests/limits ratio is 10, and it should be fine, right? We allocate 0.1 CPU to a pod in the beginning and limit the max usage to 1 CPU. In this way, we have a conservative start while still having some kind of, although arbitrary upper boundary. It almost feels like we are following the best practice!
Then I thought, this doesn’t make any sense at all. When 10 pods are scheduled in a single node the total CPU this parameter would allow for is 10 CPUs, but there aren’t 10 CPUs in a m4.xlarge node. What would happen during our peak-hours, say 5:30AM PT when America wakes up? Now I can almost visualize a grim picture of these node killing pods taking all CPU, to a point that even kubelet starts to die off, then the whole node just crash and burn.
So now, what we can do about it?
The remedy
Obviously the easiest way is to lower the CPU limits so these pods will kill themselves before they kill a node. But this doesn’t feel quite right to me. What if they really need that much CPU for normal operations, so throttling ( more on this) doesn’t lead to low performance.
Okay, how about increasing the CPU requests so these pods are more spread out and don’t get scheduled into a single node. That sounds like a better plan, and that was the plan we implemented. Here are the details:
Figure out how much you typically need
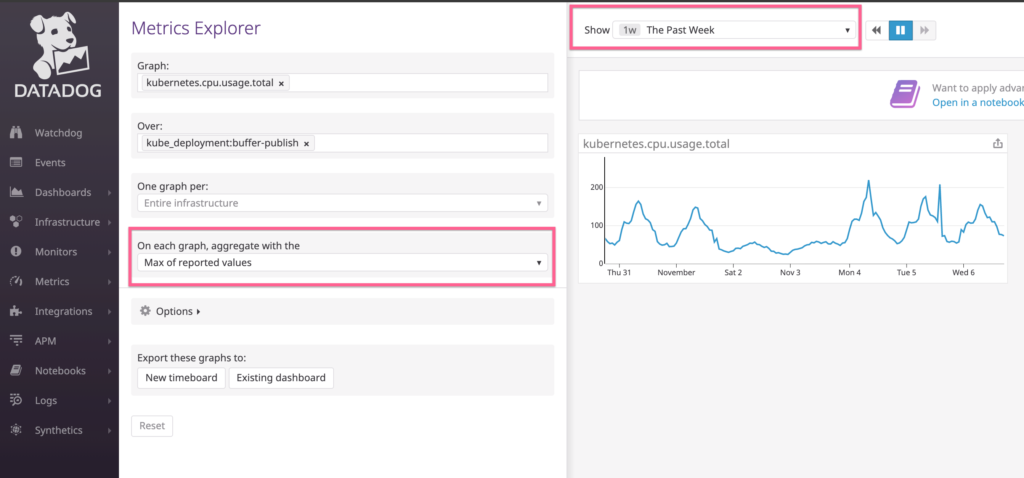
I used the Datadog metric kubernetes.cpu.usage.total over the past week on the max reported value to give me some point of reference
You could see in general it stays below 200m (0.2 CPU). This tells me it’s hard to go wrong with this value for CPU requests.
Put a limit on it
Now, this was the tricky part, and like most tricky things in life, there isn’t a simple solution. In my experiences, a good start would be 2x of the requests. In this case, it would be 400m (0.4 CPU). After the change, I spent some time eyeballing the service performance metrics to make sure the performance wasn’t impacted by CPU throttling. Chances are if it were, I would need to up it to a more reasonable number. This is more of an iterative process until you get right.
Pay attention to the ratio
It’s key not to have low requests tricking Kubernetes into scheduling all pods into one node, only to exhaust all CPU with incredibly high limits. Ideally, the requests/limits should not be too far away from each other, say within 2x to 5x range. Otherwise, an application is considered to be too spiky, or even has some kind of leaks. If this is the case, it’s prudent to get to the bottom of the application footprints.
Review regularly
Applications will undergo changes as long as they are active, so will their footprints. Make sure you have some kind of review process that takes you back to Step 1 (Figure out how much it typically needs). This is the only way to keep things in tip-top shape.
Profit
So, did it work? You bet! There were quite a few services in our cluster with disproportional requests/limits. After I adjusted these heavy-duty services, the cluster runs with more stability Here is how it looks now ?
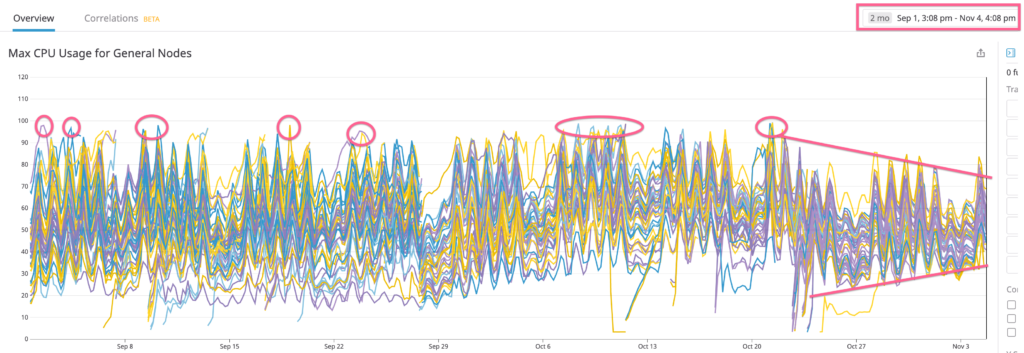
Wait! How about efficiency promised in the title? Please note the band has gotten more constricted after the changes. This shows the CPU resource across the cluster is being utilized more uniformly. This subsequently makes scaling up to have a linear effect, which is a lot more effective.
Closing words
In contrast with deploying each service on a set of dedicated computing instances, service-oriented architecture allows many services to share a single Kubernetes cluster. Precisely because of this, each service now bears the responsibility of specifying its own resource requirements. And this step is not to be taken lightly. An unstable cluster affects all the residing services, and troubleshooting is often challenging. Admittedly, not all of us are experienced with this kind of new configurations. In the good ol’ days all we needed was to deploy our one thing on some servers, and scale up/down to our liking. I think this might be why I don’t see a lot of discussions around the resource parameters in Kubernetes. Through this post, it’s my hope to help a few people out there who are struggling with this new concept (I know I did). More importantly, perhaps learn from someone who has some other techniques. If you have any thoughts on this, please feel free to hit me up on Twitter.
Originally published at http://github.com.
Try Buffer for free
140,000+ small businesses like yours use Buffer to build their brand on social media every month
Get started nowRelated Articles

Every year since 2016 we've closed Buffer for a week at the end of the year. It’s like a reset, except across the whole company.

In this article, the Buffer Content team shares exactly how and where we use AI in our work.

With so many years of being remote, we’ve experimented with communication a lot. One conversation that often comes up for remote companies is asynchronous (async) communication. Async just means that a discussion happens when it is convenient for participants. For example, if I record a Loom video for a teammate in another time zone, they can watch it when they’re online — this is async communication at its best. Some remote companies are async first. A few are even fully async with no live ca